

Trends in Colorectal Cancer Screening from the National Health Interview Survey: Analysis of the Impact of Different Modalities on Overall Screening Rates
- PMID: 38561018
- PMCID: PMC11148536
- DOI: 10.1158/1940-6207.CAPR-23-0443
Trends in Colorectal Cancer Screening from the National Health Interview Survey: Analysis of the Impact of Different Modalities on Overall Screening Rates
Abstract
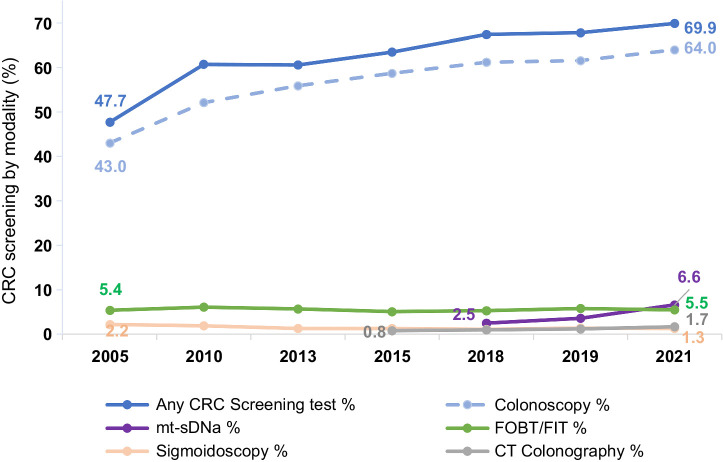
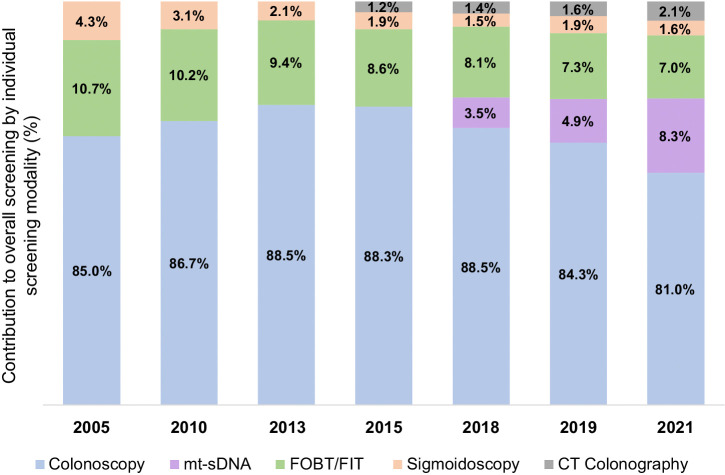
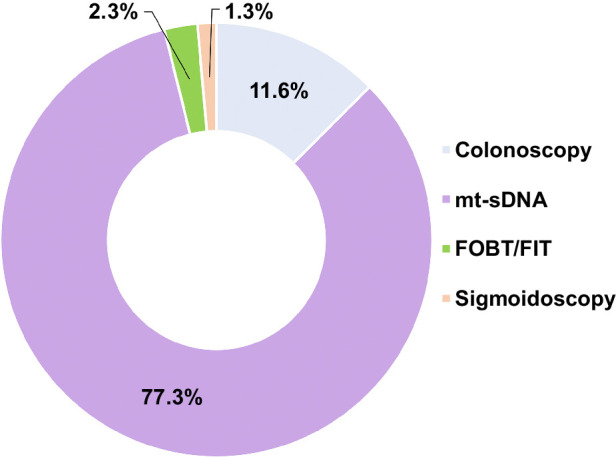
Colorectal cancer is the second leading cause of cancer-related mortality in adults in the United States. Despite compelling evidence of improved outcomes in colorectal cancer, screening rates are not optimal. This study aimed to characterize colorectal cancer screening trends over the last two decades and assess the impact of various screening modalities on overall colorectal cancer screening rates. Using National Health Interview Survey data from 2005 to 2021, we examined colorectal cancer screening [colonoscopy, multitarget stool DNA (mt-sDNA), fecal occult blood test (FOBT)/fecal immunochemical test, sigmoidoscopy, CT colonography] rates among adults ages 50-75 years (n = 85,571). A pseudo-time-series cross-sectional (pseudo-TSCS) analysis was conducted including a random effects generalized least squares regression model to estimate the relative impact of each modality on changes in colorectal cancer screening rates. Among 50 to 75 year olds, the estimated colorectal cancer screening rate increased from 47.7% in 2005 to 69.9% in 2021, with the largest increase between 2005 and 2010 (47.7%-60.7%). Rates subsequently plateaued until 2015 but increased from 63.5% in 2015 to 69.9% in 2018. This was primarily driven by the increased use of mt-sDNA (2.5% in 2018 to 6.6% in 2021). Pseudo-TSCS analysis results showed that mt-sDNA contributed substantially to the increase in overall screening rates (77.3%; P < 0.0001) between 2018 and 2021. While colorectal cancer screening rates increased from 2005 to 2021, they remain below the 80% goal. The introduction of mt-sDNA, a noninvasive screening test may have improved overall rates. Sustained efforts are required to further increase screening rates to improve patient outcomes and offering a range of screening options is likely to contribute to achieving this goal.
Prevention relevance: This retrospective study highlights the importance of convenient stool-based colorectal cancer screening options to achieve the national goal of 80% for overall colorectal cancer screening rates. Empowering screening-eligible individuals with a choice for their colorectal cancer screening tests is imperative.
©2024 The Authors; Published by the American Association for Cancer Research.
Figures
Similar articles
-
Impact of Patient Adherence to Stool-Based Colorectal Cancer Screening and Colonoscopy Following a Positive Test on Clinical Outcomes.Cancer Prev Res (Phila). 2021 Sep;14(9):845-850. doi: 10.1158/1940-6207.CAPR-21-0075. Epub 2021 May 21. Cancer Prev Res (Phila). 2021. PMID: 34021023 Free PMC article.
-
National Survey of Patient Factors Associated with Colorectal Cancer Screening Preferences.Cancer Prev Res (Phila). 2021 May;14(5):603-614. doi: 10.1158/1940-6207.CAPR-20-0524. Epub 2021 Apr 22. Cancer Prev Res (Phila). 2021. PMID: 33888515
-
Multitarget stool DNA tests increases colorectal cancer screening among previously noncompliant Medicare patients.World J Gastroenterol. 2017 Jan 21;23(3):464-471. doi: 10.3748/wjg.v23.i3.464. World J Gastroenterol. 2017. PMID: 28210082 Free PMC article.
-
PPV and Detection Rate of mt-sDNA Testing, FIT, and CT Colonography for Advanced Neoplasia: A Hierarchic Bayesian Meta-Analysis of the Noninvasive Colorectal Screening Tests.AJR Am J Roentgenol. 2021 Oct;217(4):817-830. doi: 10.2214/AJR.20.25416. Epub 2021 Mar 11. AJR Am J Roentgenol. 2021. PMID: 33703913
-
Optimal Strategies for Colorectal Cancer Screening.Curr Treat Options Oncol. 2022 Apr;23(4):474-493. doi: 10.1007/s11864-022-00962-4. Epub 2022 Mar 22. Curr Treat Options Oncol. 2022. PMID: 35316477 Free PMC article. Review.
Cited by
-
Next-Generation Multitarget Stool DNA vs Fecal Immunochemical Test in Colorectal Cancer Screening.JAMA Intern Med. 2025 Jan 1;185(1):110-112. doi: 10.1001/jamainternmed.2024.6149. JAMA Intern Med. 2025. PMID: 39556364 Free PMC article.
-
Impact of Spanish Language Outreach on Multi-Target Stool DNA Test Adherence in a Federally Qualified Health Center in the United States.Cancer Control. 2025 Jan-Dec;32:10732748251343334. doi: 10.1177/10732748251343334. Epub 2025 May 14. Cancer Control. 2025. PMID: 40366142 Free PMC article.
-
Re-screening adherence to multi-target stool DNA test for colorectal cancer: real-world study in a large national population.Int J Colorectal Dis. 2025 Feb 24;40(1):48. doi: 10.1007/s00384-025-04837-6. Int J Colorectal Dis. 2025. PMID: 39992481 Free PMC article.
-
Lower Neighborhood-Level Socioeconomic Status Is Associated with Lower Colorectal Cancer Screening Uptake in the Southern Community Cohort Study.Cancer Prev Res (Phila). 2025 Jun 2;18(6):355-363. doi: 10.1158/1940-6207.CAPR-24-0541. Cancer Prev Res (Phila). 2025. PMID: 40111080
-
Online Interest in Colorectal Cancer Screening in Florida.South Med J. 2025 Jul;118(7):365-369. doi: 10.14423/SMJ.0000000000001846. South Med J. 2025. PMID: 40663121 Free PMC article.
References
-
- American Cancer Society. Key statistics for colorectal cancer: how common is colorectal cancer? Available from: https://www.cancer.org/cancer/types/colon-rectal-cancer/about/key-statis....
-
- Siegel RL, Wagle NS, Cercek A, Smith RA, Jemal A. Colorectal cancer statistics, 2023. CA Cancer J Clin 2023;73:233–54. - PubMed
-
- US Preventive Services Task Force; Davidson KW, Barry MJ, Mangione CM, Cabana M, Caughey AB, Davis EM, et al. . Screening for colorectal cancer: US preventive services task force recommendation statement. JAMA 2021;325:1965–77. Erratum in: JAMA. 2021;326: 773. - PubMed
MeSH terms
LinkOut - more resources
Full Text Sources
Medical
