. 2024 May 22;44(21):e1337232024.
doi: 10.1523/JNEUROSCI.1337-23.2024.

Risk-Taking Is Associated with Decreased Subjective Value Signals and Increased Prediction Error Signals in the Hot Columbia Card Task

Affiliations

Risk-Taking Is Associated with Decreased Subjective Value Signals and Increased Prediction Error Signals in the Hot Columbia Card Task

Raoul Wüllhorst et al. J Neurosci. .

Abstract

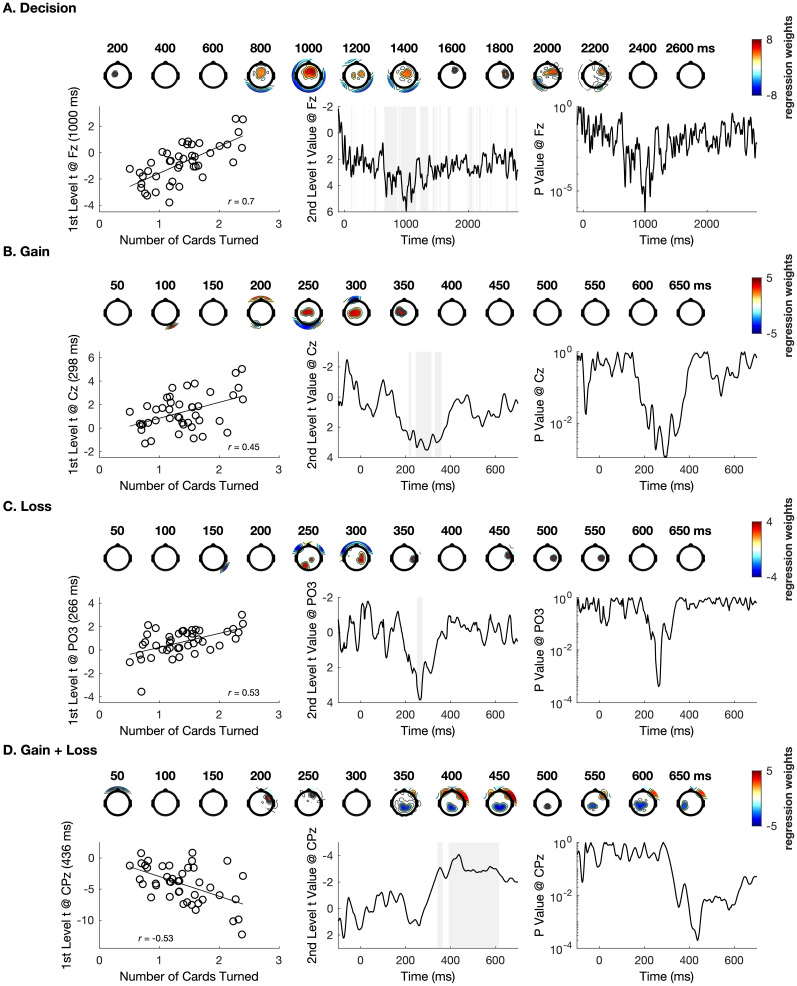
It remains a pressing concern to understand how neural computations relate to risky decisions. However, most observations of brain-behavior relationships in the risk-taking domain lack a rigorous computational basis or fail to emulate of the dynamic, sequential nature of real-life risky decision-making. Recent advances emphasize the role of neural prediction error (PE) signals. We modeled, according to prospect theory, the choices of n = 43 human participants (33 females, 10 males) performing an EEG version of the hot Columbia Card Task, featuring rounds of sequential decisions between stopping (safe option) and continuing with increasing odds of a high loss (risky option). Single-trial regression EEG analyses yielded a subjective value signal at centroparietal (300-700 ms) and frontocentral (>800 ms) electrodes and in the delta band, as well as PE signals tied to the feedback-related negativity, P3a, and P3b, and in the theta band. Higher risk preference (total number of risky choices) was linked to attenuated subjective value signals but increased PE signals. Higher P3-like activity associated with the most positive PE in each round predicted stopping in the present round but not risk-taking in the subsequent round. Our findings indicate that decreased representation of decision values and increased sensitivity to winning despite low odds (positive PE) facilitate risky choices at the subject level. Strong neural responses when gains are least expected (the most positive PE on each round) adaptively contribute to safer choices at the trial-by-trial level but do not affect risky choice at the round-by-round level.

Keywords: electroencephalography (EEG); expected utility; prediction error; prospect theory; sequential risk-taking.


Conflict of interest statement

The authors declare no competing financial interests.

Figures

Figure 1.
Figure 1.
Trial scheme.
Figure 2.
Figure 2.
Depiction of the first-level EU effect during decision-making in the time domain (A) and delta (B), theta (C), and high beta (D) bands of the time-frequency domain. Topographical maps show significant associations between EEG activity and EU [regression weights (t values) from within-subjects single-trial analyses averaged across subjects; red, positive; blue, negative; masked at p = 10−4; time domain critical p = 0.009; delta critical p = 0.006; theta critical p = 0.002; high beta critical p = 8 × 10−4]. Maps in A and B present specific time points, maps in C and D are averaged across the indicated time window. We show original event-related potential waveforms on trials with low versus high EU at selected electrodes (A–D, left; shades reflect standard error of the mean), trajectories of t values for the EU regressor (A,B, center; resulting from one-sample t tests of single-trial regression weights against zero; gray shades reflect significance masked at p = 10−4), and time courses of corresponding p values (A,B, right). Note that time domain data at Pz are presented at a higher temporal resolution (−100 to 800 ms) to enhance visibility of the parietal EU effects between 250 and 650 ms.
Figure 3.
Figure 3.
Depiction of the first-level regression for feedback processing. Effects of the prediction error regressor on (A) all feedback events (gain, loss), (B) gain feedback, and (C) loss feedback. In each figure section, the top rows present topographical maps of significant associations [regression weights (t values) from within-subjects single-trial analyses averaged across subjects; red, positive; blue, negative] between prediction error and time domain EEG activity (top row, time EEG, masked at p = 10−4; critical p = 0.013 in A; critical p = 0.010 in B; critical p = 0.001 in C) and delta, theta, and alpha band activity (bottom row, δ, θ, α, masked at p = 10−3; see Table 2 for a list of critical p values), respectively. The top left, center, and right panels show original event-related potential waveforms (shades reflect standard error of the mean), trajectories of t values for the regressor at selected electrodes (resulting from one-sample t tests of single-trial regression weights against zero; gray shades reflect significance masked at p = 10−4), and time courses of corresponding p-values, respectively.
Figure 4.
Figure 4.
Depiction of the first-level regressions predicting risky choice from the last gain-related EEG on the present round. A, Effects regarding the last response (stop vs turn; masked at p = 10−5; critical p = 0.011). B, Effects regarding the number of cards turned during the subsequent round (masked at critical p = 9 × 10−7). In the top rows, we show topographical maps of significant associations between EEG activity and the dependent variable [regression weights (t values) from within-subjects single-trial analyses averaged across subjects; red, positive; blue, negative) and below we present original event-related potential waveforms (shades reflect standard error of the mean), trajectories of t values for the regressor at selected electrodes (resulting from one-sample t tests of single-trial regression weights against zero; gray shades reflect significance masked at p = 10−5 in A), and time courses of corresponding p values. C, Conjunction maps presenting minimum t values of significant coactivation between the effects of stopping versus turning on the last trial of each round and the prediction error signal during gain feedback, averaged for the 250–350 and 400–600 ms time windows. ERP, event-related potential.
Figure 5.
Figure 5.
Second-level effects for risk-taking. Panels depict the relationship between the number of cards turned and (A) the EU signal during decisions, (B) the positive prediction error signal during gain feedback, (C) the negative prediction error signal during loss feedback, and (D) the overall prediction error signal from gain and loss feedback combined. In each panel, the top row presents topographical maps of significant associations between first-level regression weights and the number of cards turned [regression weights (t values) from between-subjects analyses; red, positive; blue, negative; masked at p = 5 × 10−3 in A and p = 10−2 in B–D). The bottom left, center, and right show scatterplots of the relationship between number of cards turned and first-level regression weights at electrodes and time-points where this association was maximal, t values for the second-level regressor at selected electrodes (resulting from one-sample t tests of second-level regression weights against zero; gray shades reflect significance masked at p = 5 × 10−3 in A and p = 10−2 in B–D), and corresponding p values, respectively.

Similar articles

References

    1. Baker AE, Galvan A (2020) Threat or thrill? The neural mechanisms underlying the development of anxiety and risk taking in adolescence. Dev Cognit Neurosci 45:100841. 10.1016/j.dcn.2020.100841 - DOI - PMC - PubMed
    1. Bayer HM, Glimcher PW (2005) Midbrain dopamine neurons encode a quantitative reward prediction error signal. Neuron 47:129–141. 10.1016/j.neuron.2005.05.020 - DOI - PMC - PubMed
    1. Benjamini Y, Yekutieli D (2001) The control of the false discovery rate in multiple testing under dependency. Ann Stat 29:1165–1188. 10.1214/aos/1013699998 - DOI
    1. Bjork JM, Pardini DA (2015) Who are those “risk-taking adolescents”? Individual differences in developmental neuroimaging research. Dev Cognit Neurosci 11:56–64. 10.1016/j.dcn.2014.07.008 - DOI - PMC - PubMed
    1. Blankenstein NE, Peper JS, Crone EA, van Duijvenvoorde ACK (2017) Neural mechanisms underlying risk and ambiguity attitudes. J Cognit Neurosci 29:1845–1859. 10.1162/jocn_a_01162 - DOI - PubMed

LinkOut - more resources