. 2024 Apr 1;9(1):70.
doi: 10.1038/s41541-024-00860-w.

Transcriptional signature of durable effector T cells elicited by a replication defective HCMV vaccine

Affiliations

Transcriptional signature of durable effector T cells elicited by a replication defective HCMV vaccine

Xiaohua Ye et al. NPJ Vaccines. .

Abstract

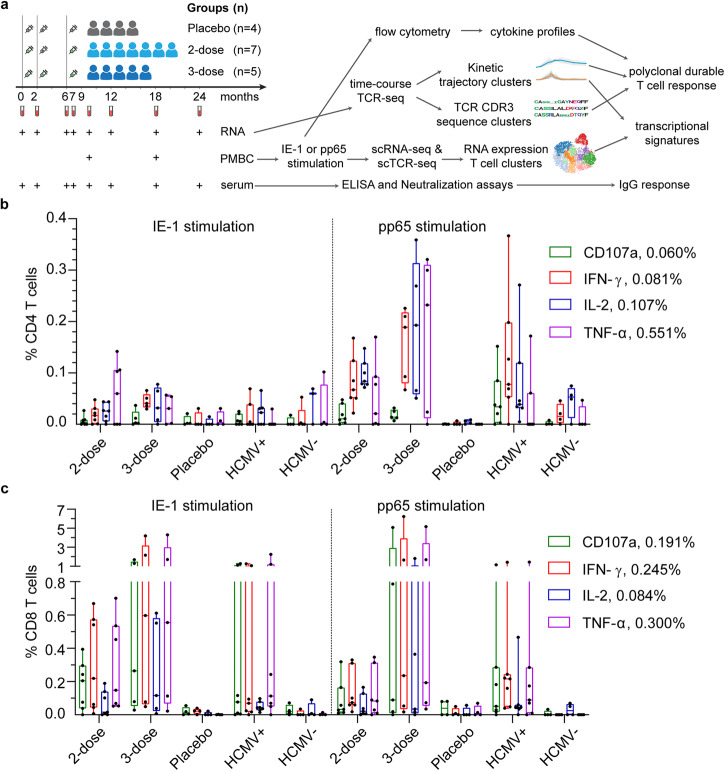
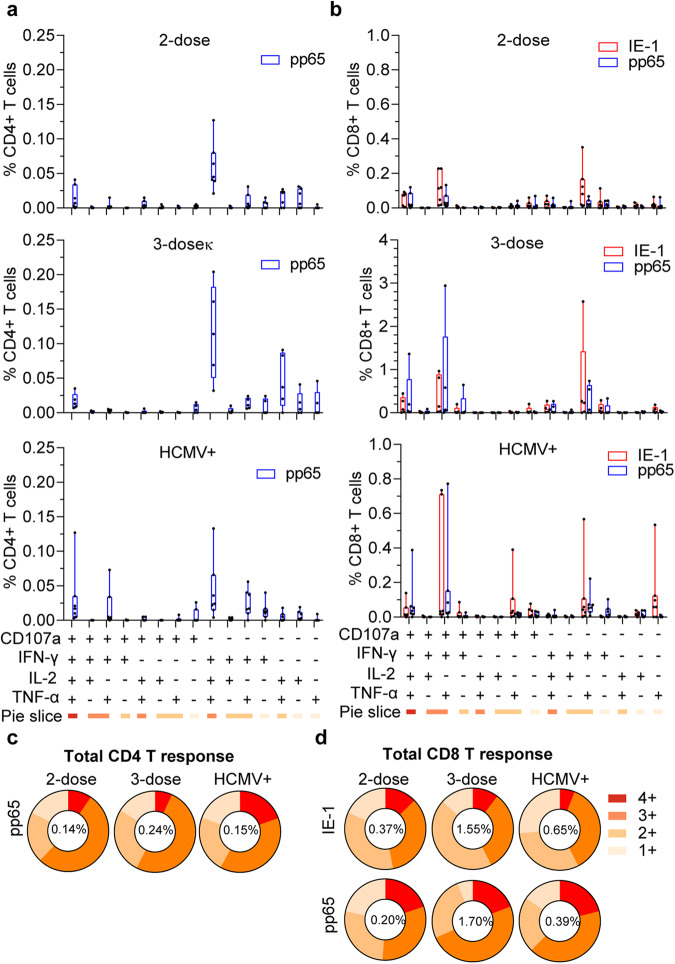
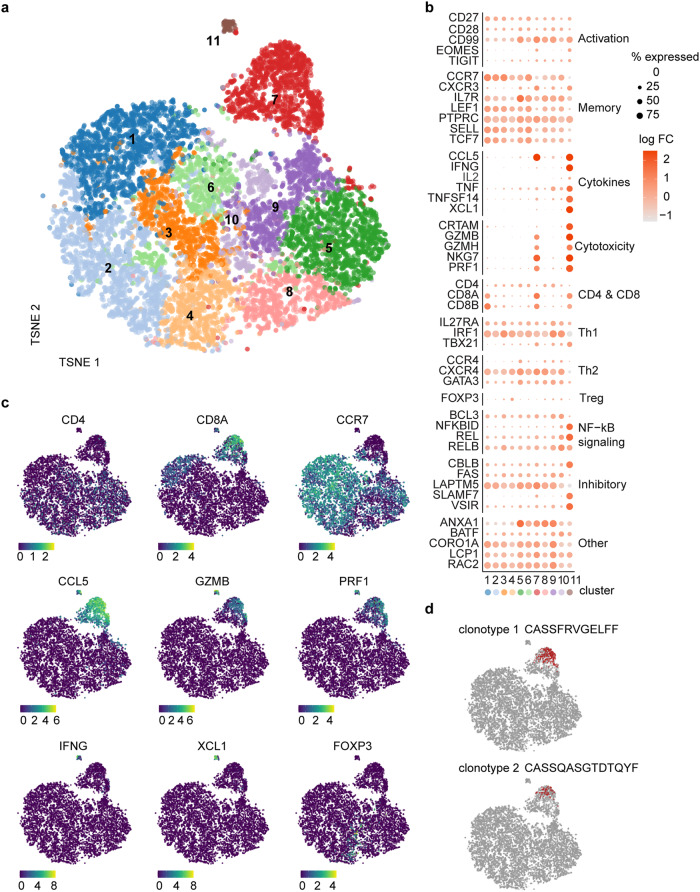
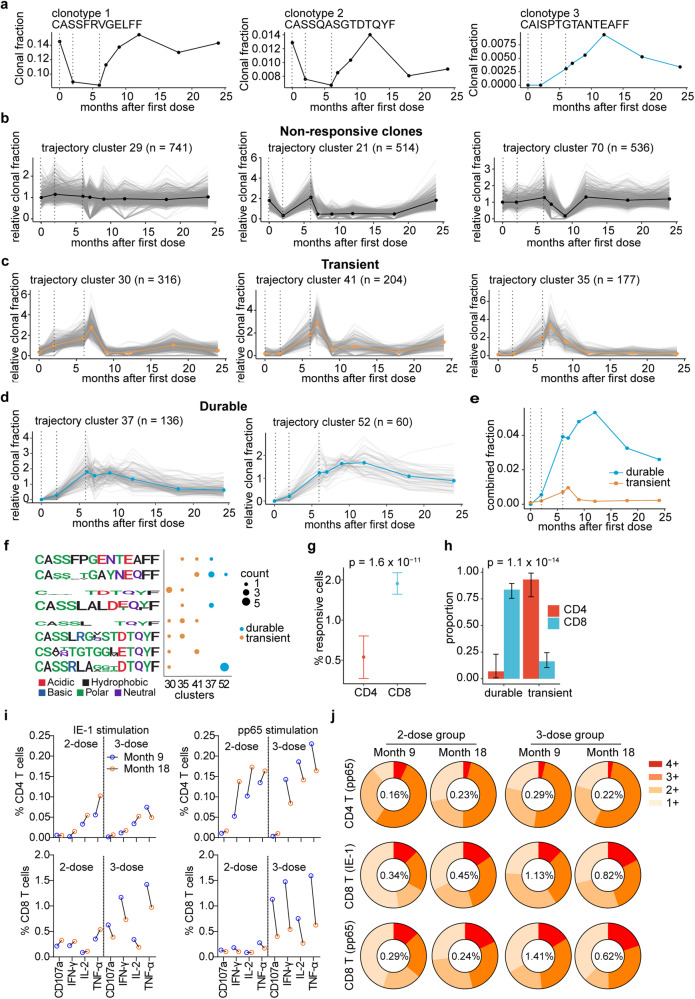
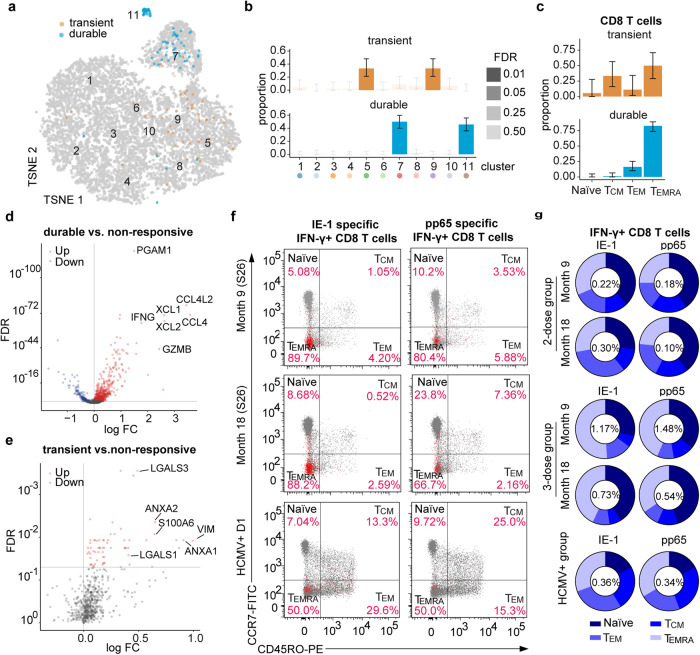
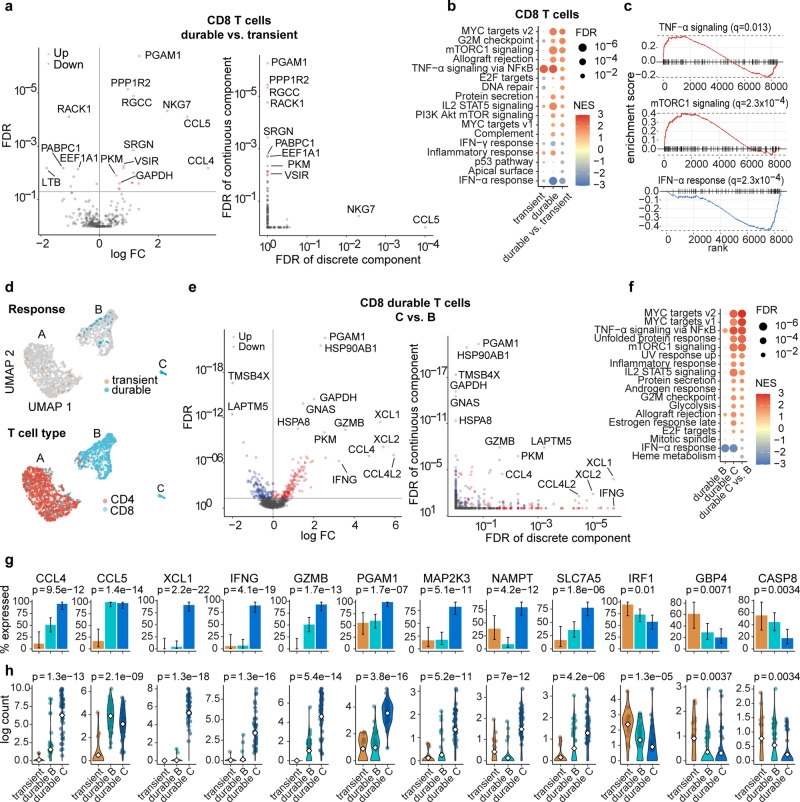
Human cytomegalovirus (HCMV) is a leading infectious cause of birth defects and the most common opportunistic infection that causes life-threatening diseases post-transplantation; however, an effective vaccine remains elusive. V160 is a live-attenuated replication defective HCMV vaccine that showed a 42.4% efficacy against primary HCMV infection among seronegative women in a phase 2b clinical trial. Here, we integrated the multicolor flow cytometry, longitudinal T cell receptor (TCR) sequencing, and single-cell RNA/TCR sequencing approaches to characterize the magnitude, phenotype, and functional quality of human T cell responses to V160. We demonstrated that V160 de novo induces IE-1 and pp65 specific durable polyfunctional effector CD8 T cells that are comparable to those induced by natural HCMV infection. We identified a variety of V160-responsive T cell clones which exhibit distinctive "transient" and "durable" expansion kinetics, and revealed a transcriptional signature that marks durable CD8 T cells post-vaccination. Our study enhances the understanding of human T-cell immune responses to V160 vaccination.


Conflict of interest statement

The study was in part funded by Merck & Co., which was the sponsor of the V160-002 clinical trial. The Sponsor had no influence on data collection and interpretation of the data. The authors declare no competing interests.

Figures

Fig. 1
Fig. 1. V160 induced IE-1 and pp65 T-cell responses as compared to natural HCMV infection.
a Overview of study design, sample collection, experiments, and analyses. Month 9 PBMCs of the 2-dose group (n = 7), 3-dose group (n = 5), and placebo group (n = 4) together with PBMCs of HCMV+ donors (n = 7) and HCMV donors (n = 4) were analyzed for T-cell responses to IE-1 and pp65 by intracellular cytokine staining (ICS) flow cytometry. b and c Percentages of (b) CD4 T cells and (c) CD8 T cells that expressed four kinds of effector molecules (CD107a, IFN-γ, IL-2, and TNF-α) after DMSO background subtraction (supplementary data file 1). Data are plotted in a box and whiskers style showing the median (center line), the first quartile, and the third quartile together with all data points. Black dots indicate individual responses. Positive cutoffs of specific T-cells were calculated from the median plus a two-fold standard error of the mean of background responses in all individuals (Supplementary Fig. 2) and were shown next to the corresponding legend.
Fig. 2
Fig. 2. Polyfunctional status of IE-1 and pp65 specific T cells induced by V160 and HCMV infection.
Combinatorial analysis of IE-1 and pp65 responding T cells in Fig. 1 was performed. a and b The percentages of (a) CD4 and (b) CD8 T cells that expressed fifteen combinations of four effector molecules (CD107a, IFN-γ, IL-2, and TNF-α) after background subtraction. Data were shown in a box and whiskers style showing the median (center line), the first quartile, and the third quartile together with all data points. Black dots indicate individual responses. c and d Average proportions of antigen-specific (c) CD4 or (d) CD8 T cells in each group that were positive for 1–4 effectors. The average total responsive T cells in each group were shown in the center of the pie chart. Individual data of Fig. 2c, d are shown in Supplementary Fig. 5.
Fig. 3
Fig. 3. Transcriptional makeup of CD3+ T cells post V160 vaccination.
a Single-cell transcriptomes of enriched CD3+ T cells from IE-1 and pp65 stimulated month 18 PBMC of S26 were shown as a t-distributed stochastic neighbor embedding (TSNE) plot, colored based on RNA expression cluster assignment by the Louvain graph-based method. b Percentage of cells expressing selected genes within each expression cluster (size scale) and log fold change (FC) of expression within each cluster vs. other clusters (color scale). c Expression levels of selected genes are shown as color overlays on the TSNE plot from (a). d Highlighting of T cells of the two most prevalent clonotypes (with CDR3β sequences shown) on the TSNE plot.
Fig. 4
Fig. 4. V160 elicits durable polyclonal CD8 T cell response.
a–e Time-course blood TCR profiling of a 3-dose V160 subject (S26) at eight time points with dotted lines indicating V160 injections (D1, M2, and M6). a Clonal fractions of three most prevalent clones are shown with CDR3β sequences. b–d Trajectory clustering of time-course TCR profiles. b Three representative clusters of non-responsive T cell clones. Clusters of T cell clones exhibiting (c) “transient” or (d) “durable” clonal expansion in response to V160 vaccination. n denotes the number of unique T cell clones. e Combined clonal fractions of durable and transient T cell clones. f TCR CDR3β sequence clusters are shown as sequence logos, with the number of T clones assigned to each CDR3β sequence cluster and each trajectory cluster shown as a dot plot. g Percentages of V160-responsive CD4 or CD8 T cells in scRNA-seq/scTCR-seq data were identified using the CDR3β as a natural barcode. Significance was assessed by Fisher’s exact test. h Proportions of V160-responsive CD4 and CD8 T cells that were “durable” and “transient” clones. Significance was assessed by Fisher’s exact test. Error bars in g, h indicate mean ± standard error of the mean. i Average percentages of IE-1 or pp65 specific CD4 or CD8 T cells in month 9 (blue circle) or 18 PBMCs (orange circle) from 2-dose (n = 5) and 3-dose (n = 5) subjects were compared side-by-side for expression of four effector molecules (CD107a, IFN-γ, IL-2, and TNF-α) by ICS flow cytometry. Data were background subtracted. Individual responses in i are shown in Supplementary Fig. 6. j Distributions of responsive CD4 vs. CD8 T cells positive for 1, 2, 3, or 4 of the four effector molecules in month 9 vs. 18 PBMCs following IE-1 or pp65 antigen stimulation. The average percentage of total responsive T cells in each group was shown in the center of the pie chart. Data were background subtracted. Individual responses in j are shown in Supplementary Fig. 8.
Fig. 5
Fig. 5. V160-responsive “durable” expanded T cells were dominated by a TEMRA phenotypes.
a Highlighting of responsive T cells with “transient” or “durable” expansion on the TSNE plot as in Fig. 2a. Statistical significance of the enrichment of each cluster for transient or durable clones was assessed by Fisher’s exact test. b Distributions of V160-responsive “transient” vs. “durable” expanded clones across the expression clusters. c Distributions of T memory subsets among V160-responsive “transient” or “durable” expanded clones of CD8 T cells, as determined based on single-cell expression profiles. Error bars in b and c indicate mean ± standard error of the mean. d and e Volcano plots of scRNA-seq differential gene expression analyses of responsive “durable” T cells versus non-responsive T cells (d), or responsive “transient” T cells versus non-responsive T cells (e). Each dot summarizes the result for a gene. FDR: false discovery rate. FC fold change. f Flow cytometry analysis of memory T cell subsets among IE-1 or pp65 specific CD8 T cells in months 9 and 18 PBMCs of subject S26 and in an HCMV+ donor. Antigen-specific T cells identified by IFN-γ expression are shown in red and overlaid with total CD8 T cells shown in gray. g Group average distributions of memory T-cell subsets among IE-1 or pp65 specific CD8 T cells in month 9 or 18 PBMCs from 2-dose (n = 5), 3-dose (n = 5), or HCMV+ (n = 7) groups. Group average percentage of IFN-γ+ CD8 T cells was shown in the center of the pie chart. Individual-level data of memory T cell subset distributions among IFN-γ+ CD8 T cells, IL-2+ CD8 T cells, TNF-α+ CD8 T cells, and CD107a+ CD8 T cells are shown in Supplementary Fig. 9.
Fig. 6
Fig. 6. Transcriptional signature of V160-responsive “durable” expanded CD8 T cells.
a Left, Volcano plots of scRNA-seq differential expression analysis of “durable” vs. “transient” expanded CD8 T cells. Right, Breakdown of the statistical significance of differential expression into the discrete component (expressed vs. non-expressed) and continuous component (changes in expression level given that the gene is expressed). Each dot summarizes the result for a gene. FDR: false discovery rate. FC: fold change. b Summary of gene set enrichment analyses for responsive “transient” vs. non-responsive, responsive “durable” vs. non-responsive, and responsive “durable” vs. “transient” expanded CD8 T cells. NES, normalized enrichment score. c Gene set enrichment plots for selected significant pathways in the differential expression of “durable” vs. “transient” expanded CD8 T cells. Dashed lines represent minimum and maximum cumulative enrichment scores. d Uniform manifold approximation (UMAP) plots of T cells from expression clusters enriched for “transient” or “durable” expanded V160-responsive clones identified in Fig. 4b. Cells are colored by V160 response type (top) or T cell type (bottom). e Left, Volcano plots of scRNA-seq differential expression analysis of V160 responsive “durable” CD8 T cells subcluster C vs. B in (d). Right, Breakdown down the statistical significance of differential expression into the discrete and continuous components. f Summary of gene set enrichment analyses for V160 responsive “durable” CD8 T cells subcluster C vs. all other CD8 T cells; subcluster B vs. all other CD8 T cells; or subcluster C vs. B. NES, normalized enrichment score. g Percentages of cells expressing selected genes within each V160 responsive T cell cluster. Significance was assessed by Fisher’s exact test. Error bars indicate the mean ± standard error of the mean. h Violin plots showing the distributions of log single-cell expression counts in each response group. Each filled dot represents the log expression of a cell expressing the gene. Open diamonds represent mean log expression. Significance was determined by the Kruskal–Wallis test.

Similar articles

Cited by

References

    1. Schottstedt V, et al. Human cytomegalovirus (HCMV)—revised. Transfus. Med. Hemother. 2010;37:365–375. doi: 10.1159/000322141. - DOI - PMC - PubMed
    1. Ljungman P, et al. Definitions of cytomegalovirus infection and disease in transplant patients for use in clinical trials. Clin. Infect. Dis. 2017;64:87–91. doi: 10.1093/cid/ciw668. - DOI - PubMed
    1. Davis NL, King CC, Kourtis AP. Cytomegalovirus infection in pregnancy. Birth Defects Res. 2017;109:336–346. doi: 10.1002/bdra.23601. - DOI - PMC - PubMed
    1. Institute of Medicine. In Vaccines for the 21st Century: A Tool for Decision making (eds Stratton, K. R., Durch, J. S. & Lawrence, R. S.) (The National Academies Press, Washington, DC, 2000). 10.17226/5501. - PubMed
    1. Plotkin SA, et al. The status of vaccine development against the human cytomegalovirus. J. Infect. Dis. 2020;221:S113–S122. doi: 10.1093/infdis/jiz447. - DOI - PMC - PubMed