. 2024 Apr 1;15(1):2810.
doi: 10.1038/s41467-024-47031-y.

Systematic analysis of RNA-binding proteins identifies targetable therapeutic vulnerabilities in osteosarcoma

Affiliations

Systematic analysis of RNA-binding proteins identifies targetable therapeutic vulnerabilities in osteosarcoma

Yang Zhou et al. Nat Commun. .

Abstract

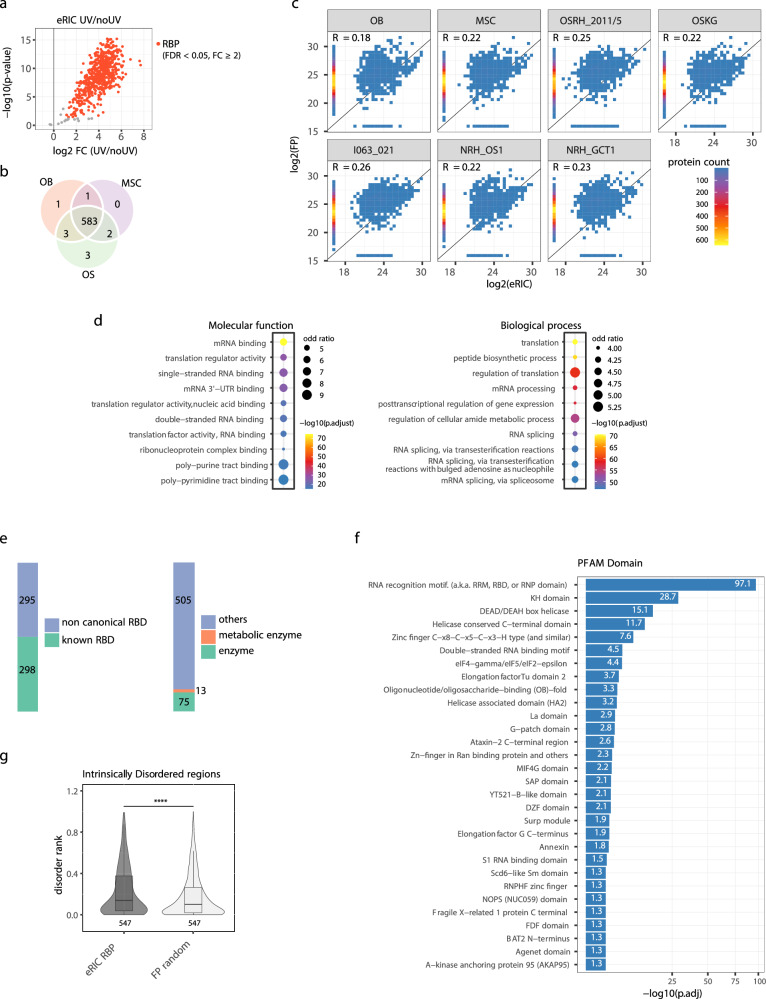
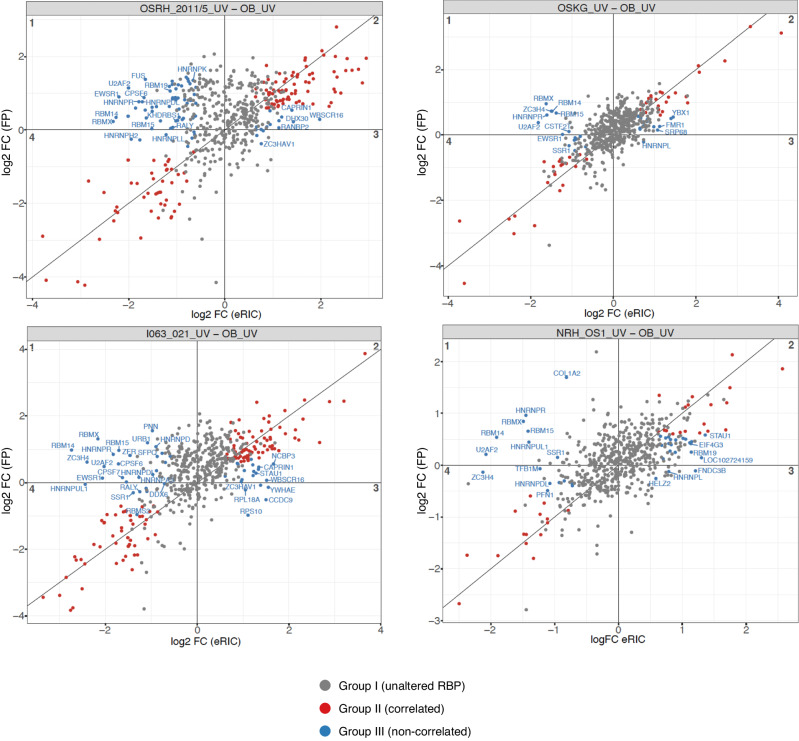
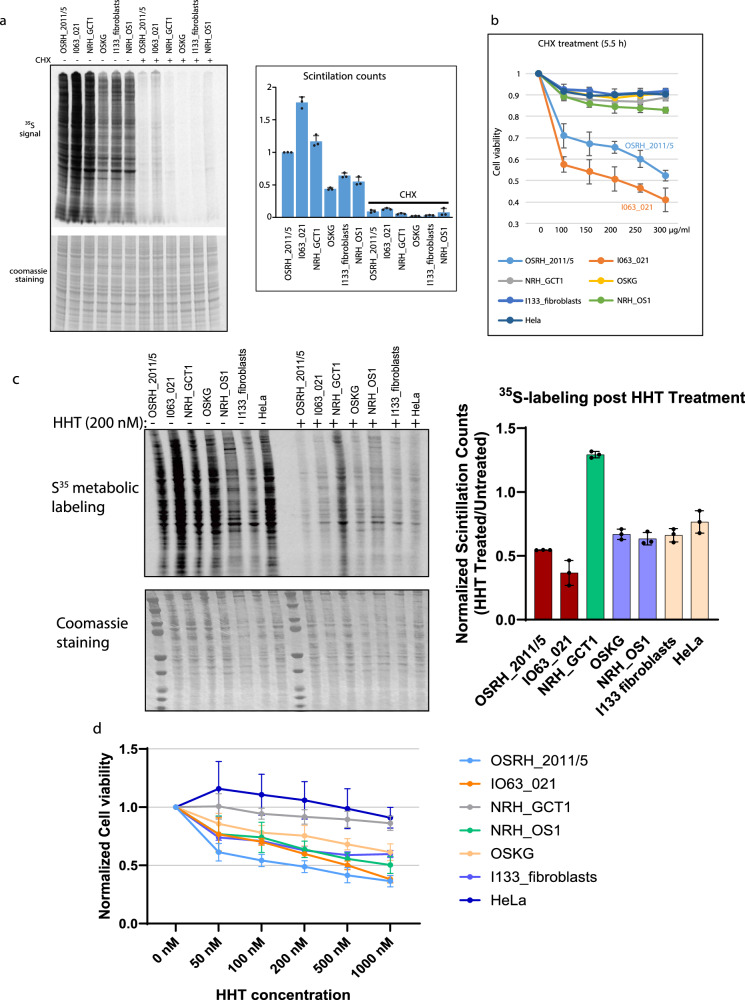
Osteosarcoma is the most common primary malignant bone tumor with a strong tendency to metastasize, limiting the prognosis of affected patients. Genomic, epigenomic and transcriptomic analyses have demonstrated the exquisite molecular complexity of this tumor, but have not sufficiently defined the underlying mechanisms or identified promising therapeutic targets. To systematically explore RNA-protein interactions relevant to OS, we define the RNA interactomes together with the full proteome and the transcriptome of cells from five malignant bone tumors (four osteosarcomata and one malignant giant cell tumor of the bone) and from normal mesenchymal stem cells and osteoblasts. These analyses uncover both systematic changes of the RNA-binding activities of defined RNA-binding proteins common to all osteosarcomata and individual alterations that are observed in only a subset of tumors. Functional analyses reveal a particular vulnerability of these tumors to translation inhibition and a positive feedback loop involving the RBP IGF2BP3 and the transcription factor Myc which affects cellular translation and OS cell viability. Our results thus provide insight into potentially clinically relevant RNA-binding protein-dependent mechanisms of osteosarcoma.


Conflict of interest statement

The authors declare no competing interests.

Figures

Fig. 1
Fig. 1. RNA interactome capture of osteoblasts, MSC, and patient-derived sarcoma cells using eRIC.
a Schematic representation of RNA interactome capture by eRIC. “T” colored in red represents LNA thymidine. b, c RNA-protein complexes captured on LNA-coupled beads were eluted with RNases for protein analyses using silver staining (b) and western blot (c). Crosslinked samples are indicated as UV +, and non-crosslinked samples are indicated as UV -. Western blots include the known mRNA binding proteins CSDE1, HuR and hnRNPK, and the non-mRNA binding proteins α-tubulin and Histone H3 as negative controls. The silver staining and western blot were performed twice with the eRIC eluates and the FP aliquots from two biological replicates which showed similar results. d Input RNA and RNA captured by eRIC from non-crosslinked samples were analyzed by Bioanalyzer. Note that the RNA captured by eRIC shows the typical length distribution of mRNAs and substantial depletion of rRNA. The Bioanalyzer analyses were performed twice with the eRIC eluates and the FP aliquots from two biological replicates, which showed similar results. Abbreviations used in the figure: OB, osteoblasts; MSC, mesenchymal stem cells. Source data for blots are provided as a Source Data file.
Fig. 2
Fig. 2. Analysis of the RNA interactomes of osteosarcoma, normal mesenchymal stem cells and osteoblasts.
a Volcano plot depicting the log2 fold change (FC) of UV crosslinked (UV) over non-crosslinked (noUV) (x-axis) versus the p values (-log10; y-axis). The p values were obtained from the moderated t-statistic in the R package limma, after Benjamini-Hochberg adjustment. Proteins significantly enriched in the UV samples compared to the noUV controls with a FC ≥ 2 and an FDR < 0.05 were classified as high probability RBPs (red). Background non-RBPs are depicted in grey. b Venn diagram showing the overlap of RBPs identified in the OB, MSC and OS RNA interactomes. c Scatter plots showing the correlation between protein abundance (normalized TMT reporter ion intensities) in the UV crosslinked sample of the eRIC (y-axis, log2 transformed value) versus the corresponding full proteome (x-axis, log2 transformed value). These data show that the abundance of RBP in the interactomes does not correlate with protein abundance in the full proteomes thus demonstrating enrichment of RBPs by eRIC. d Gene ontology analyses for the identified 593 RBPs in the normal and malignant bone/mesenchymal-cell RNA interactomes with ten of the most significant overrepresented molecular function terms (left panel) and biological process terms (right panel). The p values were obtained from the one-sided version of Fisher’s exact test in the R package Clusterprofiler, after Benjamini-Hochberg adjustment. e Number of the bone/mesenchymal-cell RNA-binding proteins that contain non-canonical RNA-binding domains (RBDs) and known RBDs, and that are known (metabolic) enzymes. f Analysis of protein domains using PFAM in DAVID (version 6.8) showing the significantly enriched (p.adj<0.05) domains in the RBPs identified in the bone/mesenchymal-cell RNA interactome. The p values were obtained from DAVID by using the one-sided version of Fisher’s exact test, after Benjamini adjustment. g Box-and-whisker plot showing the disorder rank of the bone/mesenchymal-cell RNA interactome relative to an equal number of proteins randomly chosen from the full proteome (****p = 8.4e-05). In the box-and-whisker plot, the line inside the box represents the median, while the lower and upper hinges of the box indicate the lower quartile (Q1) and upper quartile (Q3), corresponding to the 25th and 75th percentiles, respectively. The whiskers extend to a maximum of 1.5 times of Interquartile Range (IQR) beyond the box, and the lower and upper whisker ends represent the minima (Q1 – 1.5 * IQR) and maxima (Q3 + 1.5 * IQR), respectively. Outliers are not shown. This comparisonis based on the RNA interactomes and the full proteome data generated from 2 biological replicates. The p-value was obtained using the Wilcoxon test.
Fig. 3
Fig. 3. Comparative analyses of RNA interactomes reveal systematically altered RNA-binding proteins in bone tumors.
a Bar plot showing the number of significantly altered RBPs (FDR < 0.05 and FC ≥ 1.5 in the UV versus UV sample comparisons in the eRIC) in individual bone tumor RNA interactomes compared to OB/MSC. The number of elevated and reduced RBPs is indicated in pink and blue, respectively. b The malignant bone tumor cells can be grouped into a fast- and a slow-growing subgroup according to the population doubling time of the cells. Bars represent mean doubling time (h)± SD and dots represent individual data points for 2 biological replicates. c Upset plots showing the number of significantly altered RBPs in each OS RNA interactome compared to the OB RNA interactome. The RBPs that are systematically altered in all 4 OS are shown with protein names. The terms “elevated” and “reduced” refer to the apparent RNA-binding activity from eRIC. d The most strongly (top-ranked 20%) altered RBPs in the RNA interactomes of each sarcoma compared to OB. The significantly altered RBPs (FDR < 0.05 and FC ≥ 1.5 in the UV versus UV sample comparisons) in each pairwise comparison were depicted in filled circles and unaltered RBPs were depicted in hollow circles. The elevated and reduced RBPs are shown in the left and right panel, respectively. Source data for graphs are provided as a Source Data file.
Fig. 4
Fig. 4. Correlation between RNA-binding activity (as defined by protein abundance detected in eRIC) and total protein abundance in the full proteome (FP).
The relative RNA-binding activity reflected by UV sample comparisons (log2 FC) in the eRIC (x-axis) is plotted against the relative RBP abundance (log2 FC) in the full proteome (y-axis). Red dots indicate proteins whose changes of RNA-binding correlates with changes of abundance in the FP in the indicated comparison. Blue dots indicate proteins whose RNA-binding is either decreased (quadrants 1 and 4) or increased (quadrants 2 and 3) in the indicated OS cells compared to OB. Gray dots indicate proteins showing unchanged RNA-binding independently of changes of protein abundance in the full proteome.
Fig. 5
Fig. 5. Comparative analyses of RNA interactomes reveal translation and RNA splicing/processing as differential functional categories in osteosarcoma.
a Heat map showing the relative RBP abundance (log2 FC among UV crosslinked samples in eRIC) in the comparative RNA interactome analysis in each indicated sarcoma in comparison with either OB or MSC (FDR < 0.05, FC ≥ 1.5), and in MSC compared to OB (FDR < 0.05, FC ≥ 1.5). Color indicates the log2 FC. The resulting 350 differentially enriched proteins were clustered hierarchically resulting in 7 main clusters. b Consensus analysis based on the RBP abundance in RNA interactomes (UV samples from eRIC) shows the classification of sample subgroups. Subgroups of samples were identified by hierarchical consensus clustering using the “ConsensusClusterPlus” R package. The color gradients indicate consensus values from 0 (never clustered together, white color) to 1 (always clustered together, dark blue). The color bar indicates cluster 1 (light blue) and cluster 2 (dark blue), respectively. The output report shows that a cluster number (k) of 2 is optimal. c Principal component analysis (PCA) plots of the transcriptome, proteome and RNA interactome (eRIC) of the OS, GCTB, OB and MSC. R1 and R2 represent the two replicates of each experiment for each cell type. The coloured boxes (red, blue and green) indicate the differential clustering of the fast-growing OS, the slow-growing OS and MSC and the GCTB cells respectively in the PCA plots. d The GO analysis of each of the 7 clusters defined in panel a shows the most significantly enriched (p.adj<0.05, and top 10) biological process terms. The p values were obtained from the one-sided version of Fisher’s exact test in the R package Clusterprofiler, after Benjamini-Hochberg adjustment.
Fig. 6
Fig. 6. Enrichment of RBPs involved in mitochondrial and cytoplasmic translation in the fast-growing OS imparts translation-centric gene expression programs.
a, b Heatmap showing the relative RBP abundance (log2 FC) of 45 mitochondria-related proteins (a) and 61 cytoplasmic translation-related proteins (b) in comparison of sarcomata with OB in the RNA interactome (eRIC) and in the full proteome (FP). c, d GO analysis of significantly upregulated genes (log2 FC ≥ 1) in the transcriptomes and proteomes of the sarcomata in comparison to OB shows the most significantly enriched (p.adj<0.05, and top 10%) biological process (BP) terms. The p values were obtained from the one-sided version of Fisher’s exact test in the R package Clusterprofiler, after Benjamini-Hochberg adjustment. The red boxes in c and d denote BP terms related to RNA metabolism and translation, specifically enriched in the fast-growing OS and GCTB transcriptomes and proteomes respectively.
Fig. 7
Fig. 7. Fast-growing OS have high translation activity and are more vulnerable to translation inhibition.
a Measurement of global protein synthesis in absence and presence of cycloheximide treatment by metabolic labeling with 35S-methionine/cysteine. Autoradiography of 35S signal (upper left panel) and coomassie staining of the gel (lower left panel). 35S-methionine/cysteine incorporation in proteins was quantified using scintillation counting (right panel). The scintillation counts of cell lysates were determined and normalized to the total protein amount. The scintillation counts of OSRH_2011/5 were set to 1. Cells were treated with cycloheximide (CHX, 50 μg/ml) for 2 h prior the assay. Data represent mean ± standard deviation (SD) derived from three biological replicates. b Cell viability, as measured by cell titer blue assay for sarcoma cells, non-neoplastic stromal cells (I133_fibroblasts) derived from an OS tumor tissue and the HeLa cell line after treatment with the translation inhibitor CHX up to 300 μg/ml for 5.5 h. Data represent mean ± SD derived from three biological replicates. c 35S metabolic labeling of cells in absence and presence of HHT treatment. The 35S metabolic labeling was done as in a. Cells were treated with homoharringtonine (HHT, 200 nM) for 2 h prior to 35S labeling. 35S incorporation in proteins was quantified using scintillation counting (right panel). Scintillation counts from HHT-treated cells are normalized to scintillation counts from untreated cells for each cell type. Data represent mean ± standard deviation (SD) derived from three biological replicates. d Cell viability, as measured by Celltitre-Glo assay, after treatment with HHT (0–1000 nM) for 24 h, normalized to untreated cells. Data represent mean ± SD derived from three biological replicates. Source data for graphs and blots are provided as a Source Data files.
Fig. 8
Fig. 8. An IGF2BP3-Myc positive feedback loop constitutes an oncogenic signature in OS with highly active translation.
a The altered RBPs in sarcoma RNA interactomes were subjected to the “hallmark” enrichment analysis using the “hallmark” gene sets from the MSigDB. Two sets of Myc targets are significantly enriched (p.adj<0.05) in the OS with highly active translation, OSRH_2011/5 and I063_021. The p values were obtained from the one-sided version of Fisher’s exact test in the R package Clusterprofiler, after Benjamini-Hochberg adjustment. b RBPs that are Myc-targets were significantly enriched (p.adj<0.05) in the more aggressive sarcomata RNA interactomes compared to OB. The heatmap shows the enrichment level of each RBP in the RNA interactomes and the FP. The p values were obtained from the one-sided version of Fisher’s exact test in the R package Clusterprofiler, after Benjamini-Hochberg adjustment. c Representative Western blot showing IGF2BP3 and c-Myc protein abundance in OS cells, GCTB cells and in I133 fibroblasts and HeLa cells. The experiment was performed four times with similar results d Western blotting of lysates of fast-growing OS cells OSRH_2011/5 and I063_021 and slow-growing OS cells OSKG, transfected with 50 nM and 100 nM of IGF2BP3 siRNA or control siRNA using IGF2BP3, c-Myc and β-Actin antibodies. The experiment was repeated five times with similar results. e Quantitative RT-PCR of RNA, immunoprecipitated from lysates of OSRH_2011/5 and I063_021 cells with IGF2BP3 antibody and non-immune rabbit IgG, using c-Myc and β-Actin specific primers. The data represent fold change in c-Myc mRNA level in IGF2BP3 IP samples compared to IgG IP samples. The data represent mean ± SD derived from three biological replicates (left panel). * represents p ≤ 0.05 (paired, two-tailed t-test, p = 0.048), ** represents p ≤ 0.005 (paired, two-tailed t-test, p = 0.002). Quantitative RT-PCR of total RNA isolated from control siRNA or IGF2BP3 siRNA transfected cells using c-Myc and β-Actin specific primers. The data represent fold change in c-Myc mRNA level in IGF2BP3 siRNA-transfected cells compared to control siRNA-transfected cells. The data represent mean ± SD derived from three biological replicates (right panel). ** represents p ≤ 0.01 (paired, two-tailed t-test, p = 0.002, p = 0.006) f 35S metabolic labeling of I063_021 and OSKG cells transfected with 100 nM of siRNA against IGF2BP3 or control siRNA and treated with HHT (200 nM) or CHX (200 µM). The data represent mean ± SD derived from three biological replicates. * represents p ≤ 0.05, ** represents p ≤ 0.01 and *** represents p ≤ 0.001 compared to control siRNA-transfected, drug-untreated cells (paired, two-tailed t-test, p = 0.04, p = 0.0003, p = 0.0006, p = 0.005, p = 0.003, p = 0.0009); # represents p ≤ 0.05 and ## represents p ≤ 0.01 compared to control siRNA-transfected, HHT-treated cells (paired, two-tailed t-test, p = 0.04, p = 0.006). Inset is a representative blot (from four independent experiments) of siRNA-mediated knockdown of IGF2BP3 using 50 nM and 100 nM siRNA. g Western blotting of OSRH_2011/5, I063_021, OSKG and HeLa cells either untreated or treated with 1 nM, 5 nM or 10 nM volasertib using c-Myc, IGF2BP3 and β-Actin antibodies. The experiment was repeated three times with similar results. h Quantitative RT-PCR of total RNA isolated from cells either untreated or treated with 1 nM and 5 nM volasertib using IGF2BP3 and β-Actin specific primers. The data represent fold change in IGF2BP3 mRNA level in volasertib-treated cells compared to untreated cells. The data represent mean ± SD derived from three biological replicates. * represents p ≤ 0.05 and ** represents p ≤ 0.01 compared to volasertib untreated cells (paired, two-tailed t-test, p = 0.05, p = 0.01; p = 0.01, p = 0.0003; p = 0.007, p = 0.0002). i Cell viability, as measured by Celltitre-Glo assay, after treatment with volasertib (0–10 nM) for 24 h, normalized to untreated cells. Data represent mean ± SD derived from three biological replicates. j Schematic depiction of a positive feedback loop between IGF2BP3 and Myc, in which IGF2BP3 enhances the stabilization and translation of c-Myc mRNA while c-Myc enhances the transcription of IGF2BP3 mRNA, resulting in increased expression of both proteins. Source data for graphs and blots are provided as a Source Data files.

Similar articles

Cited by

References

    1. Meltzer PS, Helman LJ. New Horizons in the Treatment of Osteosarcoma. N. Engl. J. Med. 2021;385:2066–2076. doi: 10.1056/NEJMra2103423. - DOI - PubMed
    1. Gill J, Gorlick R. Advancing therapy for osteosarcoma. Nat. Rev. Clin. Oncol. 2021;18:609–624. doi: 10.1038/s41571-021-00519-8. - DOI - PubMed
    1. Moore DD, Luu HH. Osteosarcoma. Cancer Treat. Res. 2014;162:65–92. doi: 10.1007/978-3-319-07323-1_4. - DOI - PubMed
    1. Ritter J, Bielack SS. Osteosarcoma. Ann. Oncol. 2010;21:vii320–vii325. doi: 10.1093/annonc/mdq276. - DOI - PubMed
    1. Cortés-Ciriano, I. et al. Comprehensive analysis of chromothripsis in 2,658 human cancers using whole-genome sequencing. Nat. Genet. 52, 331–341 (2020) - PMC - PubMed