. 2024 Apr 1;15(1):2823.
doi: 10.1038/s41467-024-47028-7.

Native-state proteomics of Parvalbumin interneurons identifies unique molecular signatures and vulnerabilities to early Alzheimer's pathology

Affiliations

Native-state proteomics of Parvalbumin interneurons identifies unique molecular signatures and vulnerabilities to early Alzheimer's pathology

Prateek Kumar et al. Nat Commun. .

Abstract

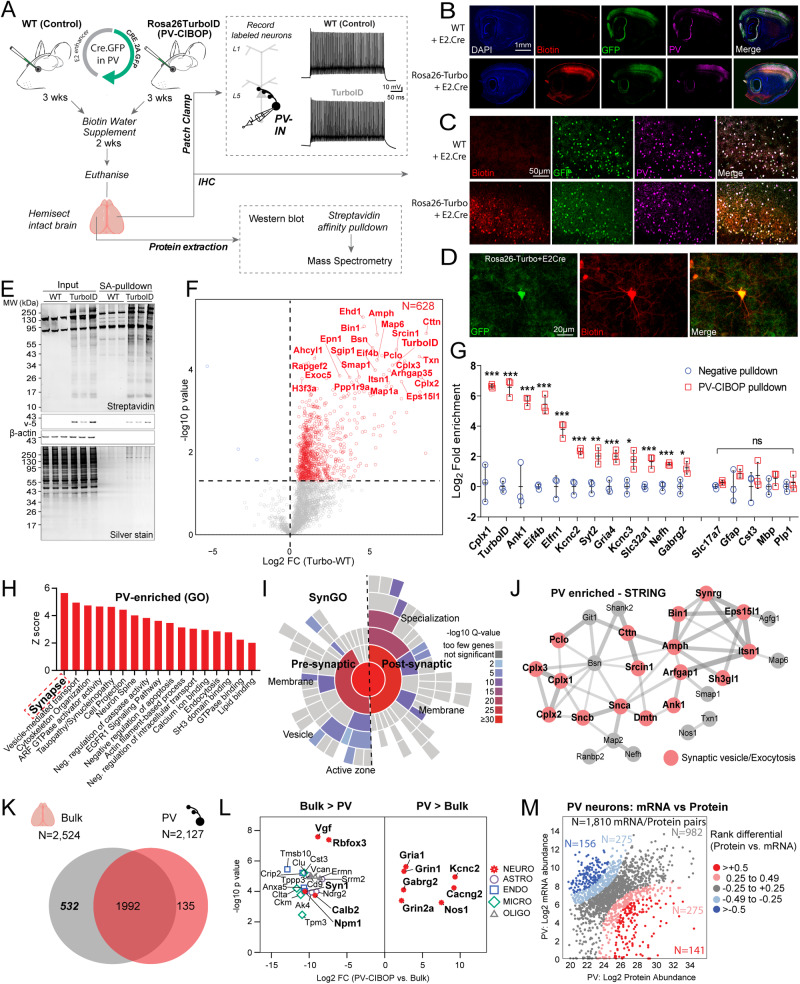
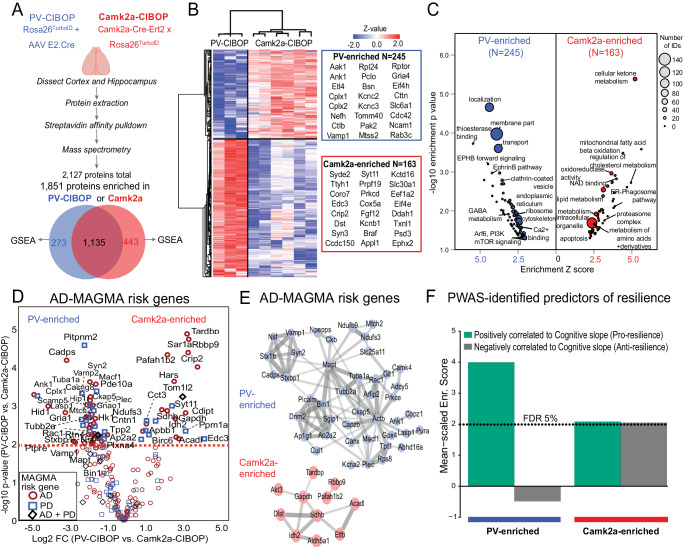
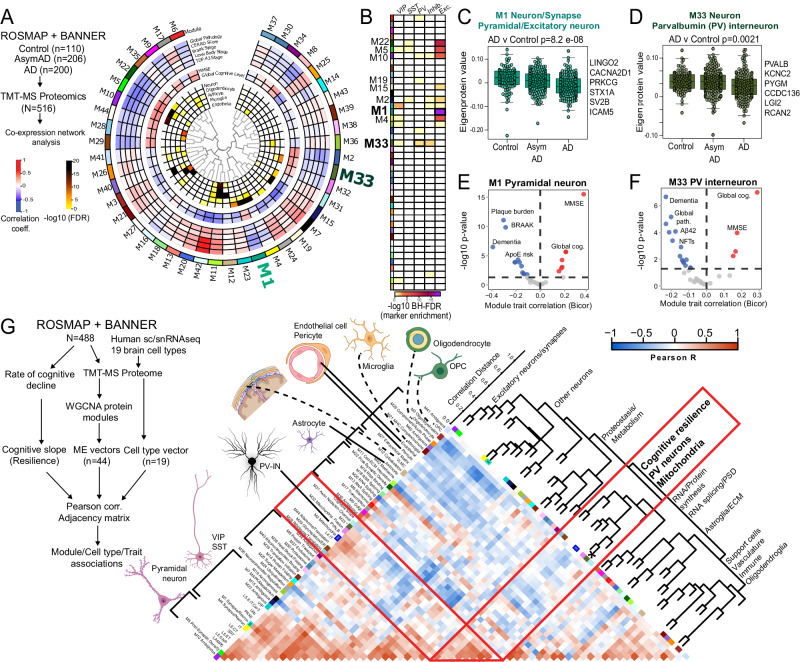
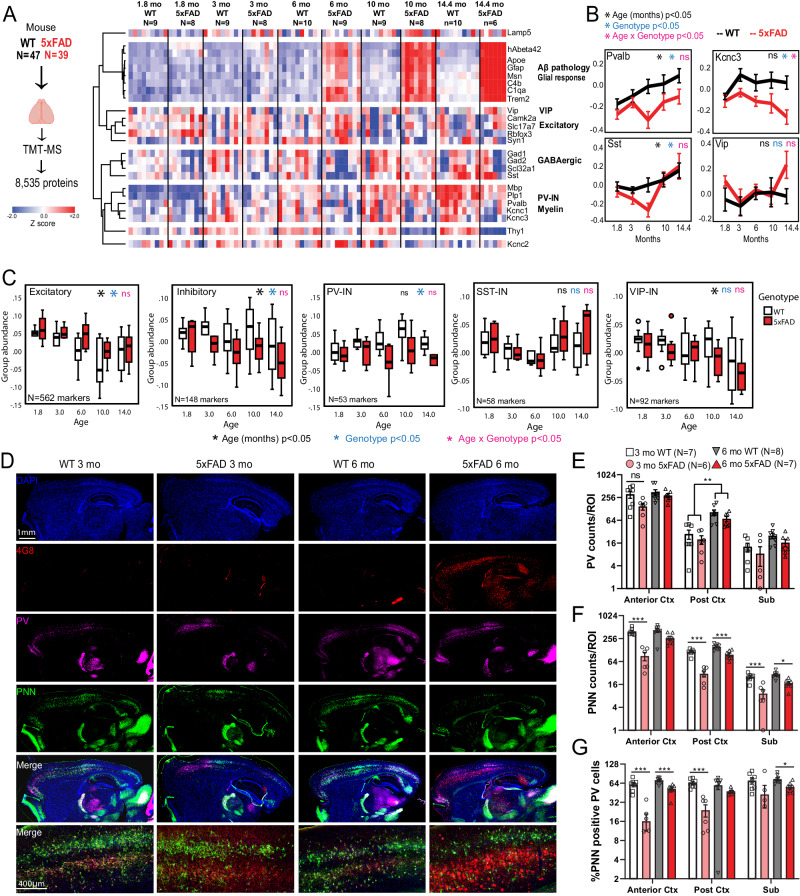
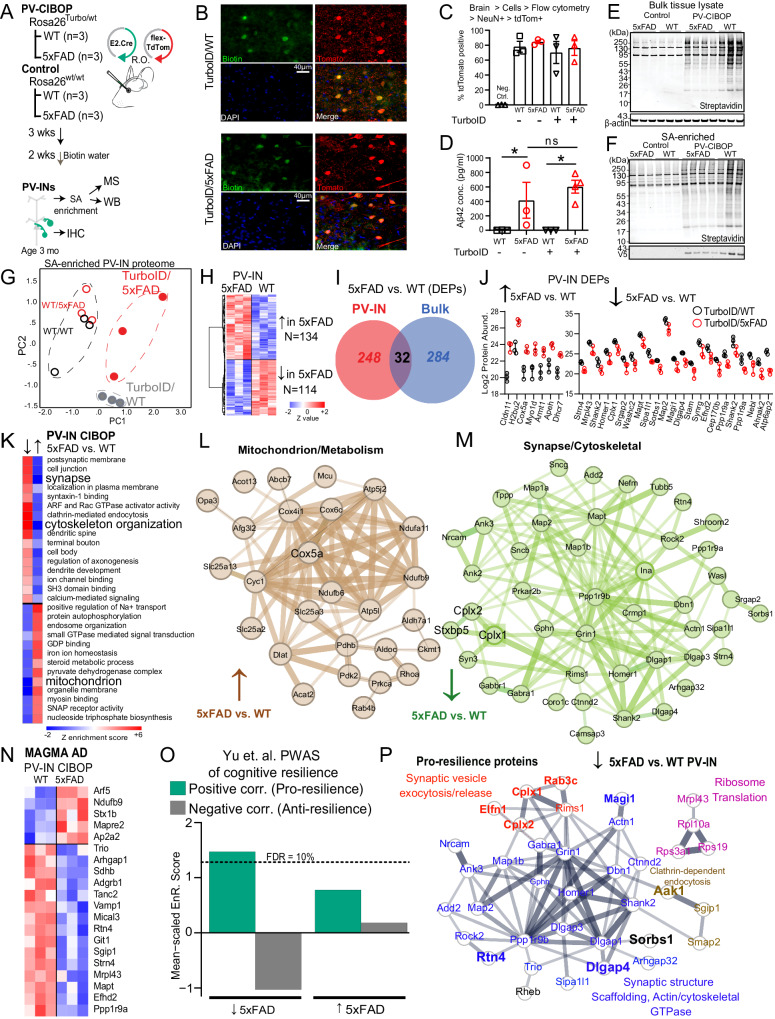
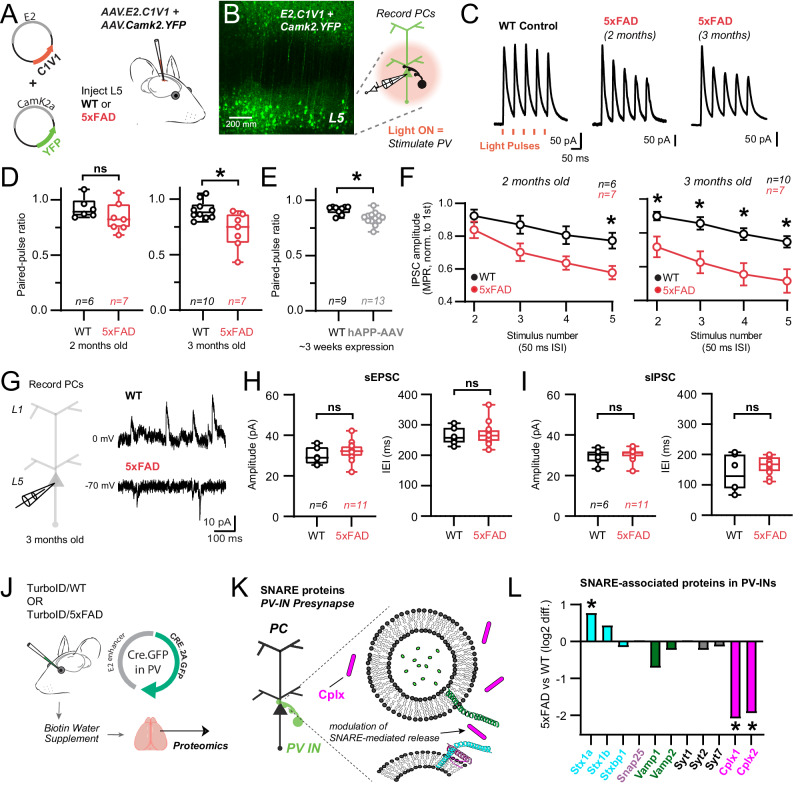
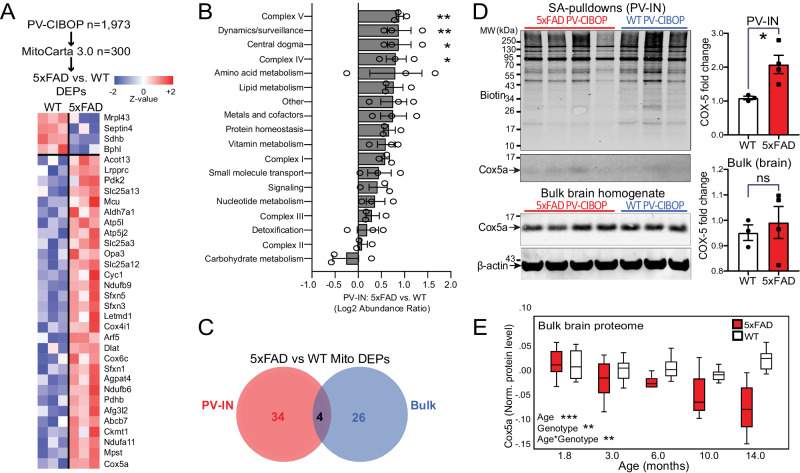
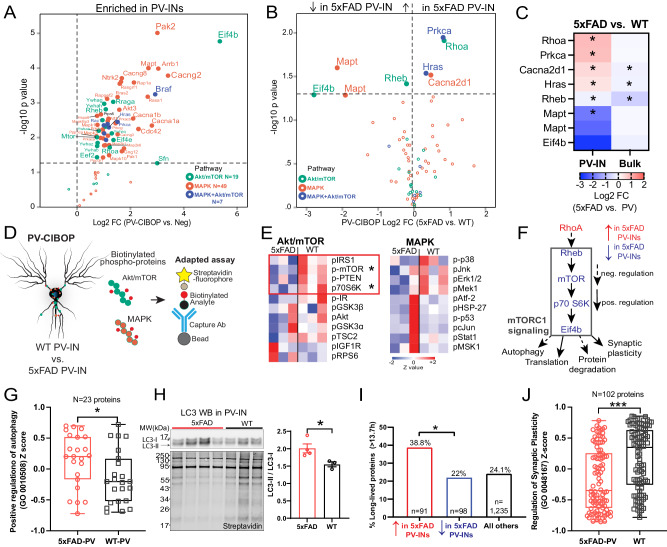
Dysfunction in fast-spiking parvalbumin interneurons (PV-INs) may represent an early pathophysiological perturbation in Alzheimer's Disease (AD). Defining early proteomic alterations in PV-INs can provide key biological and translationally-relevant insights. We used cell-type-specific in-vivo biotinylation of proteins (CIBOP) coupled with mass spectrometry to obtain native-state PV-IN proteomes. PV-IN proteomic signatures include high metabolic and translational activity, with over-representation of AD-risk and cognitive resilience-related proteins. In bulk proteomes, PV-IN proteins were associated with cognitive decline in humans, and with progressive neuropathology in humans and the 5xFAD mouse model of Aβ pathology. PV-IN CIBOP in early stages of Aβ pathology revealed signatures of increased mitochondria and metabolism, synaptic and cytoskeletal disruption and decreased mTOR signaling, not apparent in whole-brain proteomes. Furthermore, we demonstrated pre-synaptic defects in PV-to-excitatory neurotransmission, validating our proteomic findings. Overall, in this study we present native-state proteomes of PV-INs, revealing molecular insights into their unique roles in cognitive resiliency and AD pathogenesis.


Conflict of interest statement

The authors declare no competing interests.

Figures

Fig. 1
Fig. 1. Native-state proteomics of PV-INs by CIBOP.
A Experimental outline to achieve native-state proteomics of PV-INs by CIBOP. BD Immunohistochemistry of fixed brain sections confirmed biotinylation (red) of PV-INs (Pvalb: green) in PV-CIBOP but not in control mice (B: 4x and C: 20x magnification; D: Higher magnification (60x) images show biotinylation in PV-INs). E Top: Western Blot (WB) of input and streptavidin affinity pulldown samples confirms strong protein biotinylation in PV-CIBOP as compared to limited biotinylation in control animals. Bottom: Silver-stained gels of inputs and pulldown samples corresponding to WB images above. F Volcano plot representation of differential abundance of biotinylated protein, from PV-CIBOP and control mice. Red dots represent proteins biotinylated in PV-INs as compared to control mice (unpaired two-tailed T-test p ≤ 0.05). G Top PV-enriched proteins are shown on the left (including TurboID, Cnk1, Kcnc2, Kcnc3, Erbb4, Slc32a1 and GABA-ergic proteins). In contrast, non-neuronal (Mbp, Gfap, Aldh1l1, Cotl1) and excitatory neuronal (Slc17a7) proteins were not enriched (Data are presented as mean + SD, n = 3/group; unpaired two-tailed T-test *p < 0.05, **p < 0.01, ***p < 0.005). H Gene Ontology (GO) analyses of PV-enriched proteins compared to whole brain show enrichment of synaptic vesicle, GTPase binding, cytoskeletal and cell-projection related proteins. I SynGO analysis of PV-enriched proteins reveals labeling of proteins in pre- and post-synaptic compartments. J STRING analysis of PV-enriched synaptic proteins (>4-fold enriched over control) involved in synaptic vesicle and exocytosis, including complexins, ankyrins, synucleins. K Venn Diagram representing degree of overlap between proteins enriched in PV neurons, with whole brain proteomes from matched animals. L Top proteins differentially enriched in PV-INs as compared to the whole brain bulk proteome and those enriched in the bulk as compared to PV-INs, are highlighted. M Analysis of protein vs mRNA concordance in PV-INs, using PV-enriched proteins identified by PV-CIBOP and existing single nuclear transcriptomic data from mouse PV-INs. Based on differentials in rank abundances (protein vs. mRNA), discordant and concordant protein/mRNA pairs are highlighted. Also see Supplementary Figs. S1, S2, S3 and Supplementary Data 1 for related analyses and datasets. Source data are provided as a Source Data file. Image was created using BioRender.com.
Fig. 2
Fig. 2. Distinct proteomic signatures and disease vulnerabilities of PV-INs and Camk2a excitatory neurons revealed by CIBOP.
A Experimental outline for comparative analysis of CIBOP-based proteomics of PV-INs and Camk2a excitatory neurons from the mouse cortex by label-free quantitation MS analyses. 1851 proteins were quantified above negative samples in either PV-INs or Camk2a neurons. B DEA comparing PV-CIBOP (n = 3) and Camk2a-CIBOP (n = 6) cortex proteomes identified proteins >3-fold differential enrichment (signature proteins of each neuronal class), which were then hierarchically clustered. Top proteins (based on fold-change) are shown alongside the heatmap. C GSEA of PV-IN (blue) and Camk2a (red) signature proteins identified over-represented terms (GO, KEGG, Wikipathways, Reactome, Pathway commons) for PV-IN and Camk2a neurons. X-axis represents enrichment Z score for a given term, and Y-axis represents level of statistical significance of enrichment (Fisher exact test). Size of each data point indicates the number of protein IDs in that enrichment term. D Volcano plot representation of PV-IN and Camk2a neuron signature proteins which have known genetic risk associations in Alzheimer’s disease (AD) and Parkinson’s disease (PD) based on MAGMA. Some proteins have shared genetic risk associations with AD and PD (Y-axis: Camk2a-CIBOP vs. PV-IN-CIBOP unpaired two-tailed T-test *p < 0.05). E Protein-protein interaction network (STRING) of AD-associated MAGMA risk genes with differential enrichment in PV-INs and Camk2a neurons. Clusters of mitochondrial, synaptic vesicle and endocytosis related proteins were revealed in PV-IN AD MAGMA risk genes. F Enrichment of PWAS-identified proteins associated with cognitive slope in PV-enriched and Camk2a-enriched proteomic signatures. Cognitive slope was estimated in ROSMAP cases. Positive slope indicates cognitive stability or resilience while a negative slope indicates cognitive decline. Proteins positively correlated with cognitive slope are referred to as pro-resilience proteins while those negative correlated with cognitive slope are anti-resilience proteins. Enrichment of pro-resilience and anti-resilience proteins in PV-enriched and Camk2a-enriched proteins identified by CIBOP was assessed after weighting based on strength of association between proteins and cognitive slope. FDR 5% threshold is shown. Also see Supplementary Fig. 4 and Supplementary Data 2 for related analyses and datasets. Image was created using BioRender.com.
Fig. 3
Fig. 3. PV-IN molecular signatures are associated with neuropathology and cognitive resilience in humans.
A Summary of network-based analysis of human bulk brain proteomes derived from post-mortem frontal cortex samples from controls, AsymAD and AD cases, from ROSMAP and BANNER cohorts (adapted from Johnson et. al.). Protein co-expression modules (M1-42) are arranged in a circular manner. Dendrogram indicates module inter-relatedness. Module trait associations are arranged in layers: Cell type signatures with cell type-enrichment statistical significance (-log10 FDR; module-cognitive trait associations (MMSE and Global cognitive score); module-neuropathological trait associations (red: positive, blue: negative). B Modules that showed over-representation distinct neuronal markers (pan-excitatory, pan-inhibitory and IN classes, namely PV-IN, SST-IN and VIP-IN) are shown. Color indicates level of statistical significance of enrichment. C, D Comparisons of module eigenprotein abundances of M1 (C, pan-excitatory neuronal module) and M33 (D, PV-IN module) across controls, AsymAD and AD cases. Overall ANOVA p-value is shown and top neuronal class-specific proteins representative of M1 and M33 are highlighted. E, F Volcano plot representations of Module-trait correlations (X-axis: Bicor, Y-axis: -log10 p-value of correlation) for M1 (E) and M33 (F). Top correlated traits (including ApoE genetic risk based on allelic combinations of ApoE ε2, 3 and 4) are labeled. G Adjacency matrix analysis based on correlations between protein co-expression modules (ME vectors), Cell type abundance vectors (based on selected markers of 19 distinct brain cell types identified by sc/snRNAseq) and cognitive slope till time of death (Left: overall outline of the analytical plan). Right: Heatmap representation of Pearson’s correlation-based adjacency matrix. Cell type vectors and module ME vectors with representative ontologies of each ME, are shown on the left of the heatmap. Dendrogram on the right indicates relatedness among ME vectors, cell type vectors and cognitive slope, and revealed a cluster of PV-IN module M33, PV-IN vector, mitochondrial module M2 and M32, and cognitive slope (see Supplementary Data 3 for additional details). See Supplementary Data 3 and Supplementary Fig. 7 for related analyses. Image was created using BioRender.com.
Fig. 4
Fig. 4. Bulk tissue proteomics of mouse brain reveals differential effects of Aβ pathology and aging on PV-INs and their peri-neuronal nets.
A Study outline for analysis of mouse bulk brain (cortex) TMT-MS proteomics data. 8,535 proteins were quantified by TMT-MS from 47 WT and 39 5xFAD mouse brains. From these, selected proteins reflective of Aβ pathology (hAβ42 peptide), were visualized as a heatmap after hierarchical clustering based on protein IDs (N/group for panels A–C are indicated). B Trajectories of change in levels of PV-IN proteins (Pvalb, Kcnc3), SST-IN (Sst) and VIP-IN (Vip) based on age and genotype. Error bars represent SEM. Statistical tests included linear regression analyses with age, genotype and ‘age x genotype’ interaction terms as covariates. Levels of significance of each are indicated. C Trajectories of change in overall levels of pan-excitatory, pan-inhibitory, as well as PV-IN, SST-IN, and VIP-IN proteins, based on age and genotype. We used lists of transcriptomic markers of these classes of neurons (from sc/snRNAseq datasets) that were at least 4-fold enriched in the class of interest over all other neuronal types. After normalizing and z-transforming proteomic data, neuronal class-based group abundance scores were calculated and compared across ages and genotypes. Linear regression analyses were performed using age, genotype and age x genotype interaction term as covariates. Levels of significance of each, are indicated (Box plots: Median, inter-quartile range, min and max are shown). D Representative images from immunofluorescence microscopy studies of mouse brain (sagittal sections, WT and 5xFAD, ages 3 and 6 months, animals used for TMT-MS studies in A), to detect PV-INs (Pvalb protein), perineuronal nets (WFA lectin), Aβ pathology (4G8) and DAPI. 4x tiled images and 20x images from cortex are shown. EG Quantitative analysis of Pvalb protein, PNNs, and proportion of Pvalb+ INs that have PNNs in the cortex and subiculum of WT and 5xFAD mice at 3- and 6- mo of age. Y-axes are log2 transformed. Error bars represent SEM (Post-hoc Tukey HSD pairwise comparisons; *p < 0.05, **p < 0.01, ***p < 0.005). See Supplementary Fig. 5 and Supplementary Data 4. Source data are provided as a Source Data file. Image was created using BioRender.com.
Fig. 5
Fig. 5. PV-IN proteomic alterations in early stages of Aβ pathology in the 5xFAD model.
A Experimental outline for PV-CIBOP in 3-month-old 5xFAD mice. B IHC studies confirming PV-IN-specific biotinylation in WT and 5xFAD PV-CIBOP mice. C Flow cytometry analyses showing AAV-mediated targeting efficiency of PV-INs across experimental animals (n = 3/group; One-way ANOVA, p = 0.78; Data shown as mean ± SEM). D Aβ42 ELISA measurements from bulk cortex homogenates, confirming comparable Aβ42 levels across groups (n = 3 each for WT, FAD and Turbo WT, n = 4 Turbo 5xFAD, Data shown as mean ± SEM *p < 0.05, unpaired two-tailed T-test). E, F WB from bulk cortical tissue lysates and from SA-enriched samples showing robust biotinylation in PV-CIBOP compared to non-CIBOP mice. G PCA of MS data from SA-enriched proteomes: All PV-IN proteomes clustered away from control samples, and further distinction was observed between 5xFAD and WT PV-IN proteomes. H Heatmap representation of DEPs comparing WT/PV-CIBOP and 5xFAD/PV-CIBOP SA-enriched proteins. I PV-IN-specific DEPs minimally overlap with bulk tissue DEPs in 5xFAD and WT mice. J Top DEPs (showing at least 4-fold differential enrichment) comparing 5xFAD to WT PV-IN proteomes are shown (n = 3/group, mean ± SEM shown). K GSEA of DEPs comparing 5xFAD to WT PV-IN proteomes. L, M STRING protein-protein-interactions (PPI) within DEPs identified in Mitochondrial (L, increased in 5xFAD PV-IN) and Synaptic/Dendritic/Cytoskeletal (M, Decreased in 5xFAD PV-IN) ontologies. Thickness of edges indicates strength of known interactions. N Heatmap representation of DEPs comparing 5xFAD to WT PV-IN proteomes, limited to proteins encoded by genes with known genetic risk associations in AD (AD-MAGMA significance p < 0.05). O Enrichment of pro-resilience and anti-resilience proteins (from Yu et. al. PWAS study) within lists of DEPs (5xFAD vs. WT PV-IN proteomes). FDR 10% threshold is shown. P STRING PPIs of PWAS-nominated proteins positively associated with cognitive resilience (pro-resilience) that are decreased in 5xFAD PV-INs based on PV-CIBOP studies. Colors indicate shared functions and/or ontologies. Of these, proteins that are also selectively enriched in PV-INs as compared to Camk2a neurons (from CIBOP studies in Fig. 3) are highlighted (larger font, and bold). See Supplementary Fig. 6 and Supplementary Data 5 for related analyses. Source data provided as a Source Data file.
Fig. 6
Fig. 6. Progressive dysfunction of PV-pyramidal cell neurotransmission in young 5xFAD mice.
A E2.AAV-strategy for optogenetic activation of S1 PV-INs in WT and 5xFAD mice and co-labeling of Camk2a pyramidal neurons. B 2-photon image showing successful targeting of L5 following ~1 week after stereotactic surgery. Cartoon: Experimental workflow to stimulate PV-INs and record their synaptic properties in post-synaptic pyramidal cells (n = 3 mice/condition). C Averaged voltage-clamp traces from postsynaptic WT and 5xFAD pyramidal cells in layer 5 in response to short-amber light pulses. PV-IN IPSCs shown as time-locked to amber light pulses in a 20 Hz train. D Quantification of paired-pulse ratios (PPR) of C1V1-evoked IPSCs in pyramidal cell recordings for 2- and 3-month-old WT and 5xFAD mice (2 months: p = 0.21; 3 months: p = 0.008). E Quantification of PPR of AAV1.DIO.ChETA-evoked IPSCs in pyramidal cell recordings from PV-Cre mice~3 weeks following hAPP-AAV injections in L5 (*p = 0.001). F Quantification of changes in PV synapse dynamics (multiple pulse ratio/MPR) in WT and 5xFAD mice (2 months: (left to right) p = 0.63, p = 0.07, p = 0.07, *p = 0.03; 3 months: (left to right) *p = 0.04, *p = 0.005, *p = 0.003, *p = 0.004; Two-way ANOVA with Sidak’s posthoc comparisons for each stimulus in WT and 5xFAD experiments). Data are displayed as mean + /- SEM. G Voltage-clamp experiments were performed examining spontaneous synaptic activity in 3-month-old WT and 5xFAD mice. Holding voltage was interleaved between -70 and 0 mV to resolve spontaneous EPSCs and IPSCs, respectively. H Quantification of spontaneous EPSC amplitude and frequency in 3-month-old 5xFAD and WT mice. Data points indicate average from all spontaneous events from individual recordings (sEPSC Amplitude: p = 0.36); (sEPSC IEI: p = 0.69). I Quantification of spontaneous IPSC amplitude and frequency in the same recordings as in (H). Data points indicate an average value from all spontaneous events from individual recordings (sIPSC Amplitude: p = 0.67); (sIPSC IEI: p = 0.25). For box plots D-I: Median, inter-quartile range, min and max are shown. J–L Pre-synaptic PV-IN SNARE proteins identified by CIBOP, that show differential enrichment in 5xFAD vs. WT mice (Average log2FC enrichment is shown, *p < 0.05). Unpaired two-tailed t-tests used for all comparisons, except panel F. See Supplementary Fig. 7 and Source data files. Image was created using BioRender.com.
Fig. 7
Fig. 7. Distinct mitochondrial alterations in PV-INs at early stages of Aβ pathology.
A Heatmap representation of mitochondria-localized proteins that were also identified as DEPs comparing 5xFAD to WT PV-IN proteomes. B Differential abundance analysis of distinct mitochondrial functional groups, comparing 5xFAD to WT PV-IN proteomes. The 300 mitochondrial proteins identified in PV-INs were categorized based on known functional and localization-related annotations (from MitoCarta 3.0). Protein levels were normalized and them group-wise abundances were estimated and compared across WT and 5xFAD genotypes (n = 3 (WT), 4 (5xFAD) *p < 0.05, **p < 0.01 for unpaired two-tailed T-test, error bars represent SEM). C. Venn diagram of mitochondrial proteins that were identified as DEPs in either PV-IN proteomes or bulk brain cortical proteomes, comparing 5xFAD and WT mice. Minimal overlap in DEPs were observed, highlighting unique mitochondrial effects of Aβ pathology in PV-INs, not visible at the bulk tissue level. D WB verification of increased Cox5a protein levels in PV-INs in 5xFAD as compared to WT mice. SA-enriched pulldowns were independently performed from samples used for LFQ-MS studies. Cox5a protein band intensity was normalized to total biotinylation signal in the SA-enriched pulldowns, and to beta-actin in the bulk brain homogenates, and then compared across genotype (5xFAD vs. WT) (n = 3 (WT), 4 (5xFAD); Data shown as mean ± SEM; *p < 0.05, unpaired two-tailed T-test). E Cox5a protein levels, quantified by TMT-MS, from an independent set of cortical brain homogenates obtained from WT and 5xFAD mice (from Fig. 4). Using linear regression modeling, age, genotype and age x genotype interaction terms were tested for associations with Cox5a protein levels. As compared to WT brain where Cox5a levels were relatively constant with aging, Cox5a levels in 5xFAD brain showed age-dependent decrease after 6 months of age. This pattern was discordant with increased Cox5a in PV-INs in 5xFAD mice at 3 months. *p < 0.05, **p < 0.01, ***p < 0.005). Source data are provided as a Source Data file.
Fig. 8
Fig. 8. PV-IN-specific decrease in mTOR signaling in early Aβ pathology.
A. Akt/mTOR and/or MAPK signaling proteins biotinylated in PV-IN CIBOP proteomes (as compared to non-CIBOP mice). B. Akt/mTOR and MAPK proteins identified as DEPs comparing 5xFAD to WT PV-IN proteomes. C. Heatmap representation of Akt/mTOR and MAPK DEPs in PV-IN proteomes and their corresponding bulk brain proteomes (*p < 0.05, two-tailed unpaired T-test). D. Cartoon representation of adapted Luminex immunoassay to measure levels of PV-IN-derived phospho-proteins belonging to Akt/mTOR and MAPK proteins from bulk tissue. E. Heatmap visualization of Akt/mTOR and MAPK phospho-proteins in PV-INs measured by adapted Luminex assay from WT and 5xFAD mice (n = 3 mice/group, p < 0.05 unpaired two-tailed T-test). F. Summary: Decreased activity in mTOR signaling in 5xFAD PV-INs as compared to WT PV-INs, based on total protein levels estimated by PV-CIBOP MS, and phospho-protein levels by the adapted Luminex approaches. G. Comparison of proteins that positively regulate autophagy (GO:0010508), in 5xFAD and WT PV-IN proteomes (protein levels were normalized, z-transformed and then group-averaged across biological replicates before group comparisons; unpaired two-tailed T-test,*p < 0.05). H. Top: WB of PV-IN (SA-enriched) samples from 5xFAD and WT PV-CIBOP brain. LC3-II/I ratio was compared across the two groups. Bottom: Biotinylated protein from samples corresponding to WB images above. Data are displayed as mean values +/- SEM. (n = 3 (WT), 4 (5xFAD), *p < 0.05, independent two-tailed T-test). I. Analysis of DEPs (5xFAD vs. WT PV-IN proteomes) based on published protein half-lives in mouse brain. Proteins with increased levels in 5xFAD PV-INs were skewed towards proteins with longer half-lives ( > 13.7 days which represents the 75th percentile of protein half-lives in brain). This pattern is consistent with decreased translational efficiency and/or increased protein degradation, which would disproportionately impact the relative abundances of short-lived proteins. J. Comparison of proteins that regulate synaptic plasticity (GO:0048167) as a group, in 5xFAD and WT PV-IN proteomes (levels of 102 proteins were normalized, z-transformed and then averaged across biological replicates before group comparisons using unpaired two-tailed T-test (***p < 0.005). See Supplementary Data 6 for related analyses. Source data are provided as a Source Data file.

Update of

References

    1. Tasic B, et al. Shared and distinct transcriptomic cell types across neocortical areas. Nature. 2018;563:72–78. doi: 10.1038/s41586-018-0654-5. - DOI - PMC - PubMed
    1. Tosches MA, Lee HJ. Cellular atlases of the entire mouse brain. Nature. 2023;624:253–255. doi: 10.1038/d41586-023-03781-1. - DOI - PubMed
    1. Wei YN, et al. Transcript and protein expression decoupling reveals RNA binding proteins and miRNAs as potential modulators of human aging. Genome Biol. 2015;16:41. doi: 10.1186/s13059-015-0608-2. - DOI - PMC - PubMed
    1. Moritz CP, Muhlhaus T, Tenzer S, Schulenborg T, Friauf E. Poor transcript-protein correlation in the brain: negatively correlating gene products reveal neuronal polarity as a potential cause. J. Neurochem. 2019;149:582–604. doi: 10.1111/jnc.14664. - DOI - PubMed
    1. Tasaki S, et al. Inferring protein expression changes from mRNA in Alzheimer’s dementia using deep neural networks. Nat. Commun. 2022;13:655. doi: 10.1038/s41467-022-28280-1. - DOI - PMC - PubMed