. 2024 Apr 1;15(1):2825.
doi: 10.1038/s41467-024-46783-x.

A negative feedback loop between TET2 and leptin in adipocyte regulates body weight

Affiliations

A negative feedback loop between TET2 and leptin in adipocyte regulates body weight

Qin Zeng et al. Nat Commun. .

Abstract

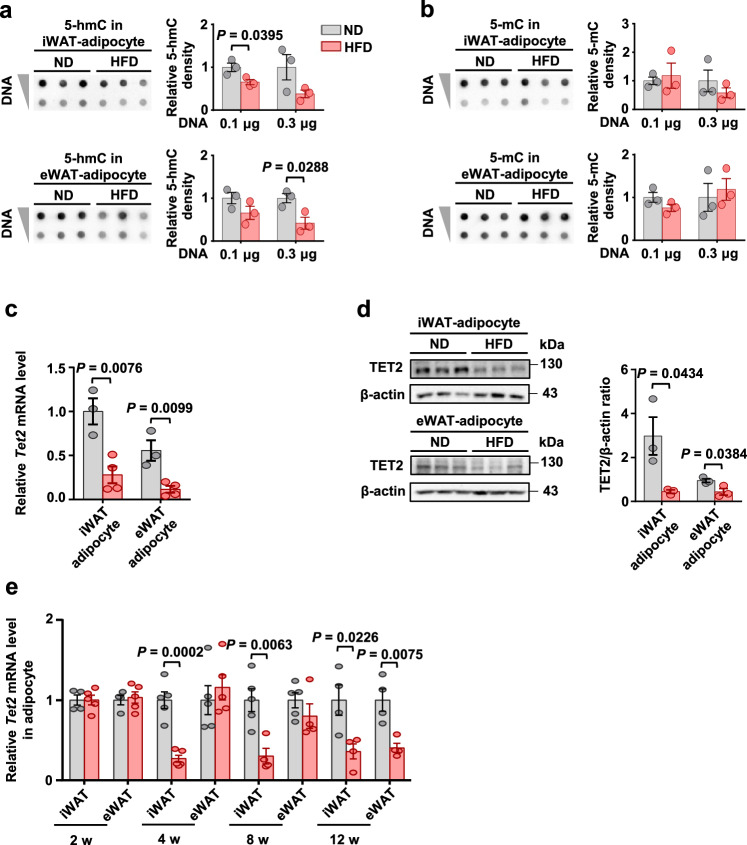
Ten-eleven translocation (TET) 2 is an enzyme that catalyzes DNA demethylation to regulate gene expression by oxidizing 5-methylcytosine to 5-hydroxymethylcytosine, functioning as an essential epigenetic regulator in various biological processes. However, the regulation and function of TET2 in adipocytes during obesity are poorly understood. In this study, we demonstrate that leptin, a key adipokine in mammalian energy homeostasis regulation, suppresses adipocyte TET2 levels via JAK2-STAT3 signaling. Adipocyte Tet2 deficiency protects against high-fat diet-induced weight gain by reducing leptin levels and further improving leptin sensitivity in obese male mice. By interacting with C/EBPα, adipocyte TET2 increases the hydroxymethylcytosine levels of the leptin gene promoter, thereby promoting leptin gene expression. A decrease in adipose TET2 is associated with obesity-related hyperleptinemia in humans. Inhibition of TET2 suppresses the production of leptin in mature human adipocytes. Our findings support the existence of a negative feedback loop between TET2 and leptin in adipocytes and reveal a compensatory mechanism for the body to counteract the metabolic dysfunction caused by obesity.


Conflict of interest statement

The authors declare no competing interests.

Figures

Fig. 1
Fig. 1. Obesity decreases DNA hydroxymethylation and TET2 levels in adipocytes.
a-b Genomic 5-hmC (a) and 5-mC (b) levels in adipocytes of iWAT and eWAT from the C57BL/6J male mice fed either ND or HFD for 12 weeks (n = 3 mice/group). c Tet2 mRNA levels relative to 36b4 in adipocytes of iWAT and eWAT from the mice shown in a (n = 3 ND, 1 ND sample was obtained by pooling samples from two mice; n = 4 HFD). d Representative immunoblot images of TET2 in adipocytes of iWAT and eWAT from the mice shown in a and densitometry analysis. β-actin was used as a loading control (n = 3 mice/group). e Tet2 mRNA levels relative to 36b4 in adipocytes of iWAT and eWAT from the C57BL/6J male mice fed either ND or HFD for 2, 4, 8, and 12 weeks (HFD 2 weeks: n = 4 ND and n = 5 HFD; HFD 4 weeks: n = 5 ND and n = 5 HFD; HFD 8 weeks: n = 5 ND and n = 4 HFD; HFD 12 weeks: n = 4 ND and n = 4 HFD; 1 ND sample was obtained by pooling samples from two mice). All data are presented as mean ± SEM. P-values are indicated on the graph. Statistical values are determined by two-sided unpaired Student’s t-test. Source data are provided as a Source Data File.
Fig. 2
Fig. 2. Leptin inhibits adipocyte Tet2 expression via JAK2-STAT3 signaling pathway in adipocytes.
a Tet2 mRNA levels relative to 36b4 in differentiated mature adipocytes that were treated with PBS, leptin (1 μg/mL), TNF-α (5 ng/mL), LPS (500 ng/mL), IFN-γ (2 ng/mL), or TGF-β1 (10 ng/mL) for 24 h (n = 3). b-c Tet2 expression in differentiated mature adipocytes treated with leptin at various time points (b) and concentrations (c). Time points and concentrations are indicated on the graphs (n = 3). d Leptin levels in conditioned medium (CM) from iWAT and eWAT of ND-fed and HFD-fed mice (n = 4).e Tet2 expression in mature adipocytes treated with control antibody (IgG) or leptin neutralizing antibody (mLeptin) for 1 h, followed by treating with CM from eWAT of ND-fed and HFD-fed mice for another 24 h (n = 3). f Tet2 mRNA levels relative to 36b4 in adipocytes of iWAT and eWAT from WT and ob/ob mice (n = 5 WT, n = 6 ob/ob). g Representative immunoblot images of TET2 in adipocytes of iWAT and eWAT from the mice shown in f and densitometry analysis. β-actin was used as a loading control (n = 3 mice/group). h Tet2 expression in differentiated 3T3-L1 adipocytes treated with DMSO (n = 4) or AZD1480 (JAK2 inhibitor, n = 3), Ctrl-siRNA (n = 3) or JAK2-siRNA (n = 3) for 24 h, followed by treating with leptin for another 24 h. i Tet2 expression in differentiated 3T3-L1 adipocytes treated with Ctrl-siRNA or STAT3-siRNA for 24 h, followed by treating with leptin for another 24 h (n = 3). All data are presented as mean ± SEM. n indicates the number of biologically independent samples examined. P-values are indicated on the graph. Statistical values are determined by two-sided unpaired Student’s t-test. Source data are provided as a Source Data File.
Fig. 3
Fig. 3. Tet2 deficiency attenuates HFD-induced obesity and insulin resistance.
a and b Body weight progression (a) and body fat (b) in Tet2+/+ and Tet2−/− mice fed HFD for 12 weeks, starting at 6 weeks of age (n = 8 Tet2+/+; n = 9 Tet2−/−). c Relative tissue weights of iWAT, eWAT, BAT, and liver mass after 12 weeks of HFD feeding (n = 8 Tet2+/+; n = 8 Tet2−/−). (d) Fasting insulin levels after 12 weeks of HFD feeding (n = 4 mice/group). e ITT and its respective area under the curve (AUC) after 12 weeks of HFD feeding (n = 7 Tet2+/+; n = 8 Tet2−/−). f Fasting glucose levels after 12 weeks of HFD feeding (n = 9 mice/group). g GTT and its respective AUC after 12 weeks of HFD feeding (n = 9 mice/group). hk Changes in oxygen consumption (h) at different time points, oxygen consumption (i) and energy expenditure (j) during light, dark hours, and full day, and daily food intake (k) after 5 weeks of HFD feeding (n = 5 mice/group). ln mRNA levels of thermogenic genes relative to β-actin in BAT (l), iWAT (m) and eWAT (n) after 5 weeks of HFD feeding (n = 4 mice/group). All data are presented as mean ± SEM. P-values are indicated on the graph. Statistical values are determined by two-sided unpaired Student’s t-test in (ag) and (kn), one-way ANCOVA test in (i) and (j). Source data are provided as a Source Data File.
Fig. 4
Fig. 4. Adipocyte-specific Tet2 deficiency protects against HFD-induced obesity and insulin resistance.
a, b Body weight progression (a) and body fat (b) in AWT and AKO mice fed HFD for 12 weeks, starting at 6 weeks of age (n = 6 mice/group). c Relative tissue weights of iWAT, eWAT, BAT, and liver mass after 12 weeks of HFD feeding (n = 6 AWT; n = 5 AKO). d Fasting insulin levels after 12 weeks of HFD feeding (n = 4 AWT; n = 5 AKO). e ITT and its respective AUC after 12 weeks of HFD feeding (n = 6 mice/group). f Fasting glucose levels after 12 weeks of HFD feeding (n = 6 mice/group). g GTT and its respective AUC after 12 weeks of HFD feeding (n = 6 mice/group). hk Changes in oxygen consumption (h) at different time points, oxygen consumption (i) and energy expenditure (j) during light, dark hours, and full day, and daily food intake (k) after 5 weeks of HFD feeding (n = 5 mice/group). ln mRNA levels of thermogenic genes relative to β-actin in BAT (l), iWAT (m) and eWAT (n) after 5 weeks of HFD feeding (n = 4 mice/group). All data are presented as mean ± SEM. P-values are indicated on the graph. Statistical values are determined by two-sided unpaired Student’s t-test in (ag) and (kn), one-way ANCOVA test in (i) and (j). Source data are provided as a Source Data File.
Fig. 5
Fig. 5. Tet2 deficiency improves HFD-induced obesity and insulin resistance by partially reducing leptin levels.
a Leptin levels in plasma of AWT and AKO mice after 11 weeks of ND feeding or 5 weeks of HFD feeding (n = 5 mice/group). b Effects of acute leptin injections on food intake in AWT and AKO mice after overnight fasting (n = 6 mice/group). c DAB staining of p-STAT3 (3 V: Third ventricle; the arrows represent p-STAT3 positive expression, scale bars, 100 μm) after saline and leptin injection in AWT and AKO mice (n = 4 mice/group). d Body weight progression in Tet2+/+ ob/ob and Tet2−/− ob/ob mice fed HFD for 14 weeks, starting at 5 weeks of age (n = 5 mice/group). e ITT from the mice shown in (d) (n = 5 mice/group). f GTT from the mice shown in (d) (n = 5 mice/group). g Leptin levels in plasma of AWT-PBS and AKO-Leptin mice supplemented with PBS or leptin for 10 weeks, starting at 5 weeks of HFD (n = 4 mice/group). hj Body weight progression (h), ITT (i) and GTT (j) in mice shown in (g) (n = 7 mice/group). km Changes in oxygen consumption (k) at different time points, oxygen consumption (l) during light, dark hours, and full day, and daily food intake (m) after 10 weeks of PBS or leptin supplementation (n = 5 mice/group). All data are presented as mean ± SEM. P-values are indicated on the graph. Statistical values are determined by two-sided unpaired Student’s t-test in (aj) and (m), one-way ANCOVA test in (l). Source data are provided as a Source Data File.
Fig. 6
Fig. 6. TET2 upregulates leptin gene expression via interacting with C/EBPα in adipocytes.
a Leptin mRNA levels relative to 36b4 in adipocytes of iWAT and eWAT from AWT and AKO mice fed either ND for 18 weeks or HFD for 12 weeks (n = 6 ND; n = 4 HFD). b Leptin mRNA levels in differentiated adipocytes from iWAT and eWAT treated with Ctrl-siRNA or TET2-siRNA for 24 h (n = 3). c TET2 ChIP-qPCR at the promoter of leptin gene in differentiated adipocytes (n = 3). d The binding domain between TET2 and leptin (TSS: Transcriptional start site). e mRNA levels of leptin relative to 36b4 in adipocytes from iWAT and eWAT treated with DMSO or Bobcat339 for 24 h (n = 3). f 5-hmC hMeDIP-qPCR at the promoter of leptin gene in mature adipocytes from Tet2+/+ and Tet2−/− mice fed ND for 8 weeks (n = 3). g 5-mC hMeDIP-qPCR at the promoter of leptin gene in mature adipocytes from Tet2+/+ and Tet2−/− mice fed ND for 8 weeks (n = 3). h TET2 ChIP-qPCR at the promoter of leptin gene in differentiated adipocytes treated with Ctrl-siRNA, C/EBPα-siRNA or SP1-siRNA (n = 4). i C/EBPα-TET2 Co-IP. Endogenous immunoprecipitation assay with C/EBPα and TET2 in adipocytes from ND-fed mice. j ChIP-reChIP assay at leptin promoter. The ChIP-reChIP assay was performed in adipocytes from ND-fed mice. Anti-TET2 was used in the first immunoprecipitation, and anti-IgG and anti-C/EBPα were used in the second immunoprecipitation (n = 3). k C/EBPα ChIP-qPCR at the promoter of leptin gene in mature adipocytes of iWAT and eWAT from ND-fed and HFD-fed mice (n = 4). All data are presented as mean ± SEM. n indicates the number of biologically independent samples examined. P-values are indicated on the graph. Statistical values are determined by two-sided unpaired Student’s t-test. Source data are provided as a Source Data File.
Fig. 7
Fig. 7. TET2 levels are negatively correlated with LEPTIN levels and BMI in humans.
a, b Genomic 5-hmC (a) and 5-mC (b) levels in SAT from the lean and obese humans (N = 3). c mRNA levels of TET2 and LEPTIN relative to ACTB in SAT (N = 8 nonobese and N = 7 obese subjects). d Correlation between TET2 and LEPTIN in SAT. e Correlation between TET2 and LEPTIN in adipocytes of SAT (Published microarray data: GSE44000). f TET2 levels in human SAT adipocytes were negatively associated with BMI (Published microarray data: GSE44000). g Leptin secretion in adipocytes from lean SAT treated with DMSO or Bobcat339 for 24 h (N = 3). h Model of the negative feedback loop between TET2 and leptin in adipocytes. All data are presented as mean ± SEM. N indicates the number of biologically independent samples examined. P-values are indicated on the graph. Statistical values are determined by two-sided unpaired Student’s t-test in (ac) and (g), two-sided Spearman’s correlation analysis in (df). Source data are provided as a Source Data File.

References

    1. Collaboration, N. C. D. R. F. Worldwide trends in body-mass index, underweight, overweight, and obesity from 1975 to 2016: a pooled analysis of 2416 population-based measurement studies in 128.9 million children, adolescents, and adults. Lancet. 2017;390:2627–2642. doi: 10.1016/S0140-6736(17)32129-3. - DOI - PMC - PubMed
    1. Bluher M. Obesity: global epidemiology and pathogenesis. Nat. Rev. Endocrinol. 2019;15:288–298. doi: 10.1038/s41574-019-0176-8. - DOI - PubMed
    1. Lingvay I, Sumithran P, Cohen RV, le Roux CW. Obesity management as a primary treatment goal for type 2 diabetes: time to reframe the conversation. Lancet. 2022;399:394–405. doi: 10.1016/S0140-6736(21)01919-X. - DOI - PubMed
    1. Ling C, Ronn T. Epigenetics in human obesity and type 2 diabetes. Cell Metab. 2019;29:1028–1044. doi: 10.1016/j.cmet.2019.03.009. - DOI - PMC - PubMed
    1. Greenberg MVC, Bourc’his D. The diverse roles of DNA methylation in mammalian development and disease. Nat. Rev. Mol. cell Biol. 2019;20:590–607. doi: 10.1038/s41580-019-0159-6. - DOI - PubMed