. 2024 Apr 1;15(1):2818.
doi: 10.1038/s41467-024-46735-5.

CD276-dependent efferocytosis by tumor-associated macrophages promotes immune evasion in bladder cancer

Affiliations

CD276-dependent efferocytosis by tumor-associated macrophages promotes immune evasion in bladder cancer

Maosheng Cheng et al. Nat Commun. .

Abstract

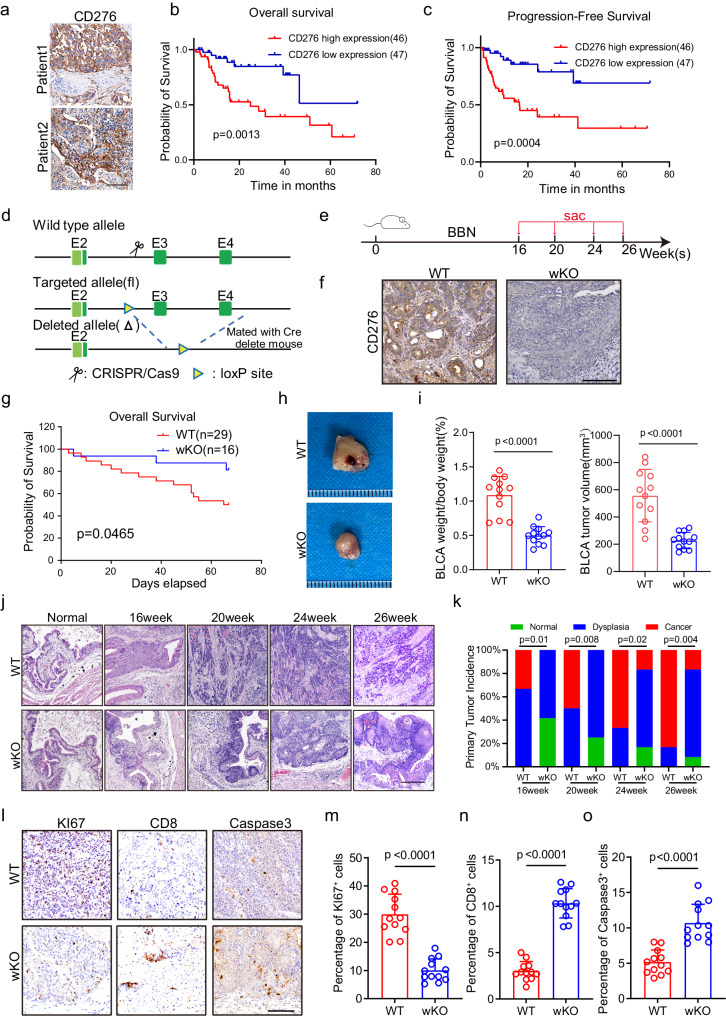
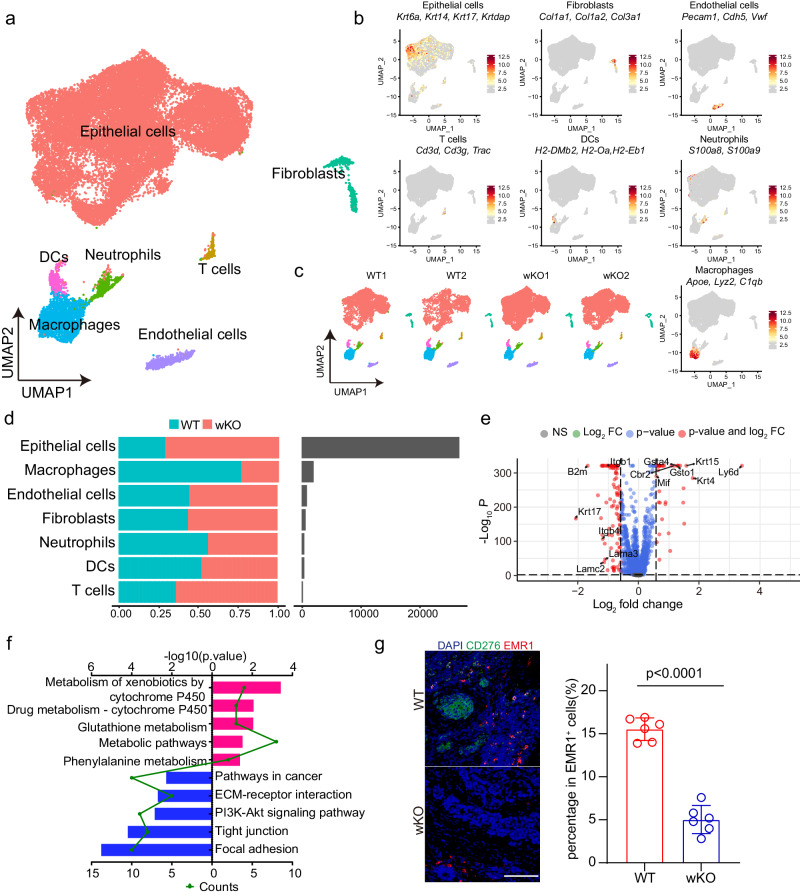
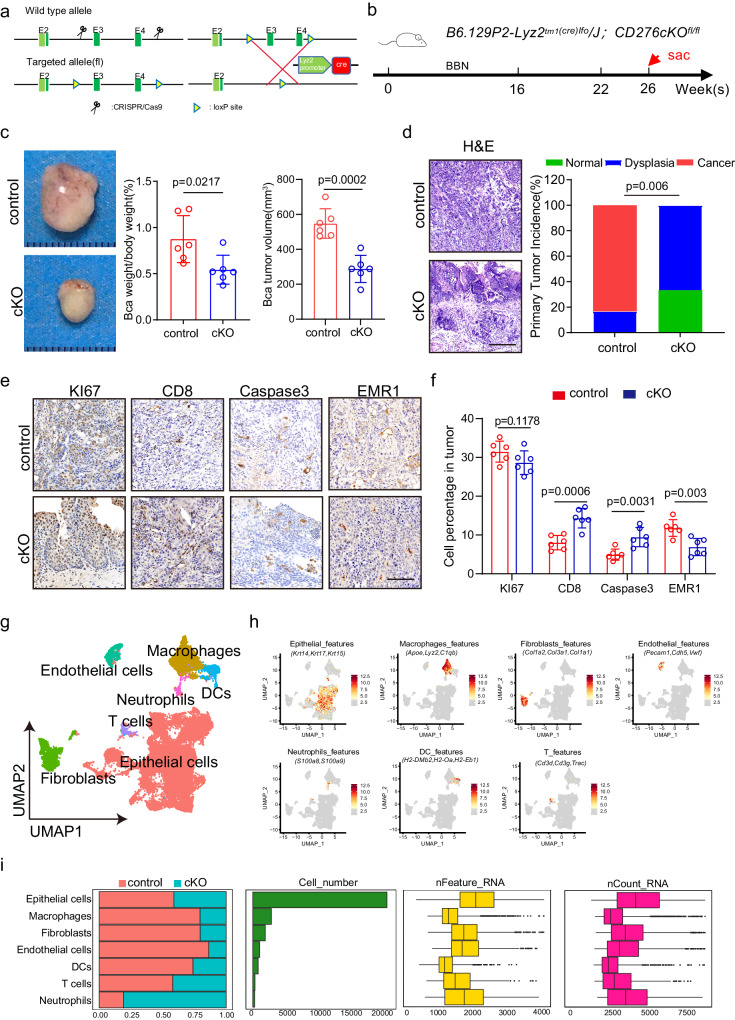
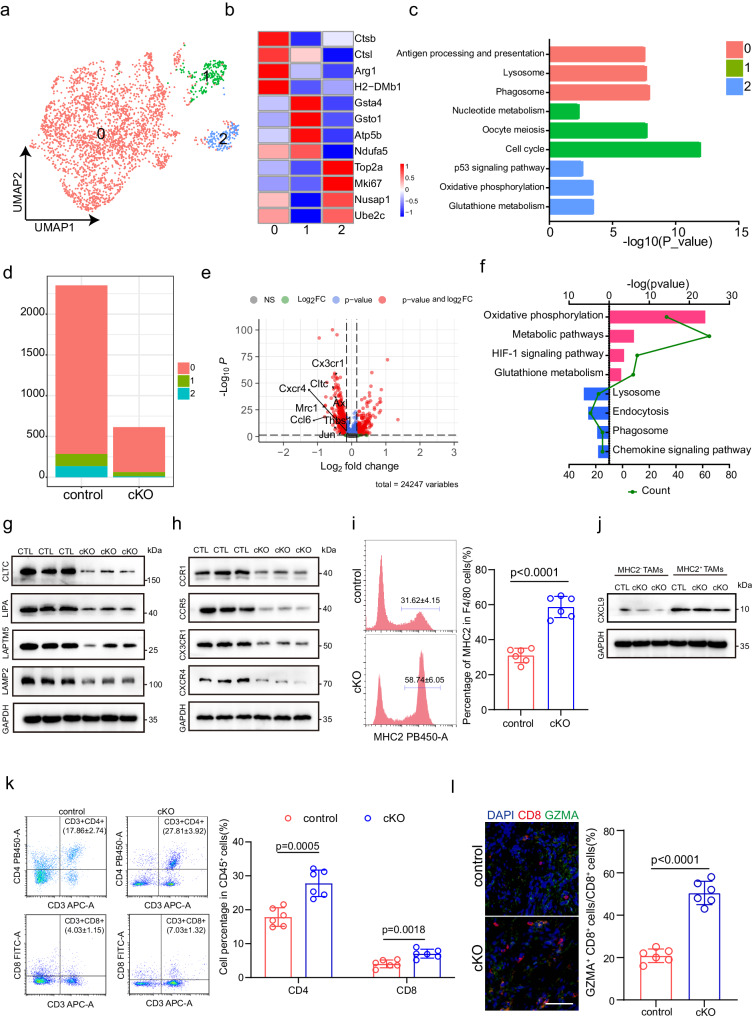
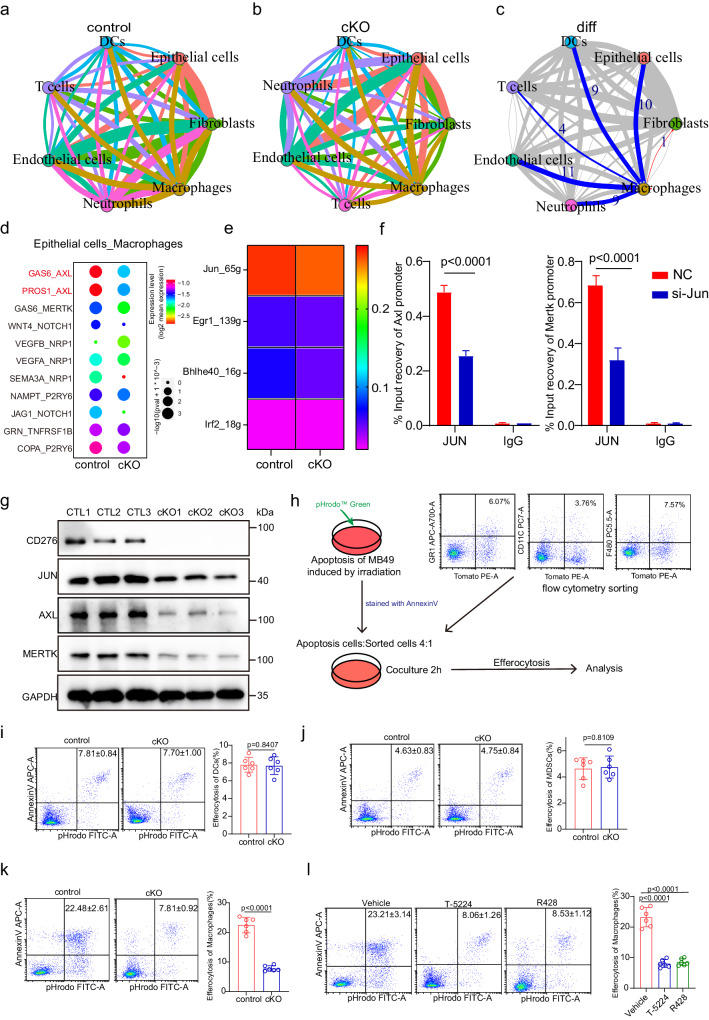
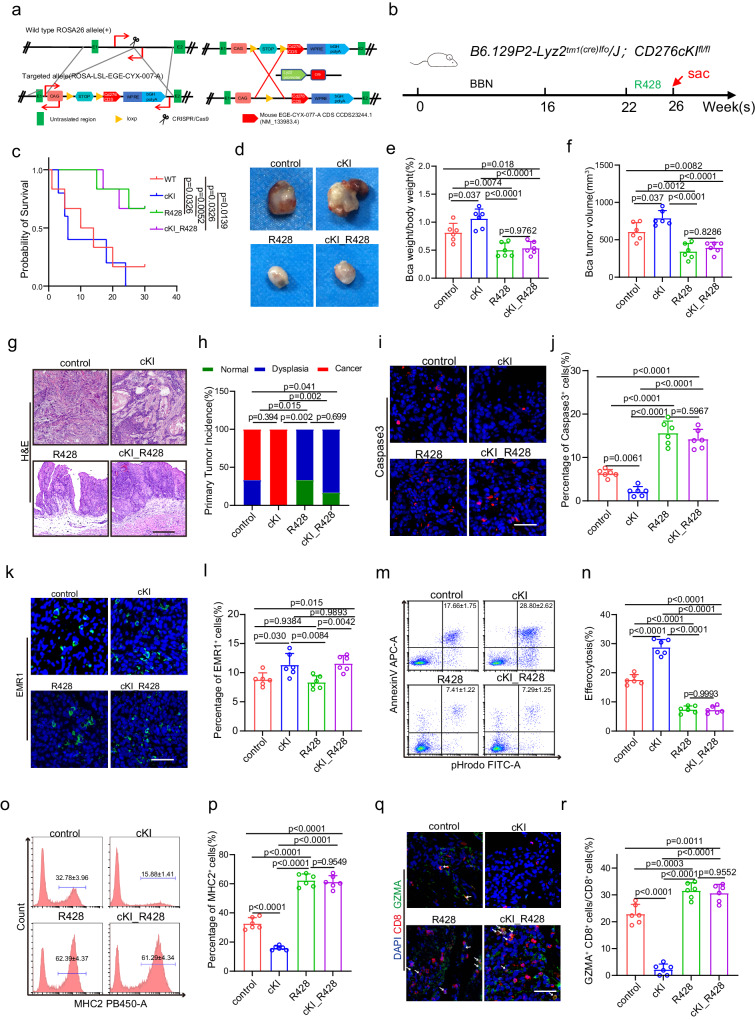
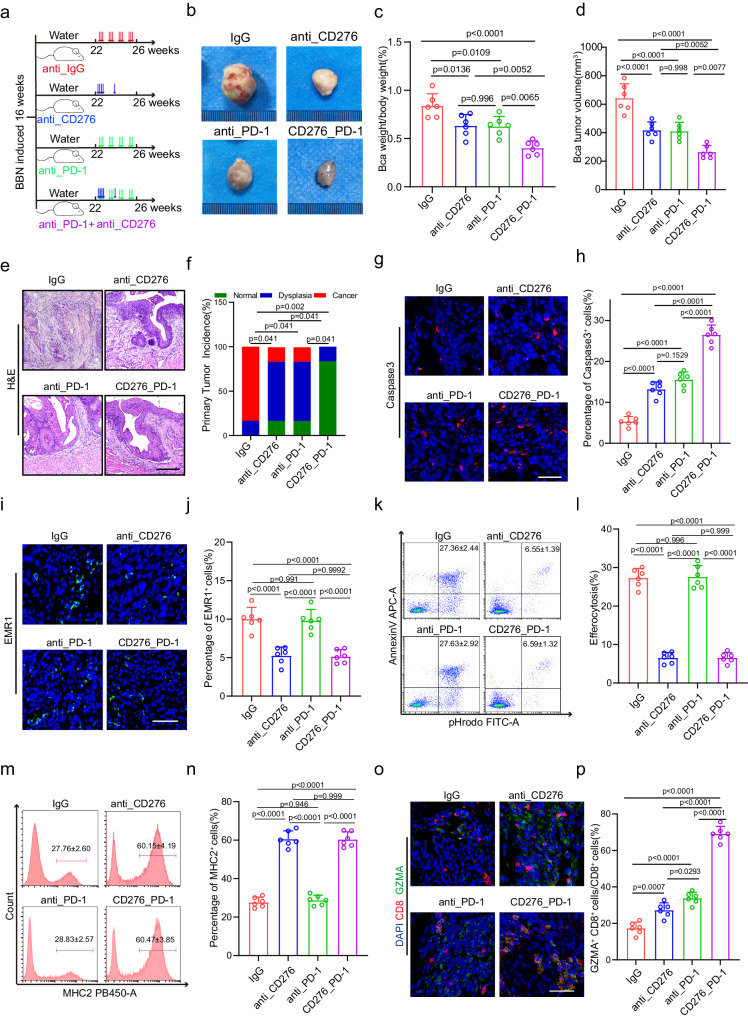
Interplay between innate and adaptive immune cells is important for the antitumor immune response. However, the tumor microenvironment may turn immune suppressive, and tumor associated macrophages are playing a role in this transition. Here, we show that CD276, expressed on tumor-associated macrophages (TAM), play a role in diminishing the immune response against tumors. Using a model of tumors induced by N-butyl-N-(4-hydroxybutyl) nitrosamine in BLCA male mice we show that genetic ablation of CD276 in TAMs blocks efferocytosis and enhances the expression of the major histocompatibility complex class II (MHCII) of TAMs. This in turn increases CD4 + and cytotoxic CD8 + T cell infiltration of the tumor. Combined single cell RNA sequencing and functional experiments reveal that CD276 activates the lysosomal signaling pathway and the transcription factor JUN to regulate the expression of AXL and MerTK, resulting in enhanced efferocytosis in TAMs. Proving the principle, we show that simultaneous blockade of CD276 and PD-1 restrain tumor growth better than any of the components as a single intervention. Taken together, our study supports a role for CD276 in efferocytosis by TAMs, which is potentially targetable for combination immune therapy.


Conflict of interest statement

The authors declare no competing interests.

Figures

Fig. 1
Fig. 1. CD276 is highly expressed in BLCA and global knockout of CD276 can inhibit the progression of BLCA.
a Representative images of CD276 staining of human BLCA tissues from the Fourth Medical Center of PLA General Hospital cohort. Scale bar, 100 μm. b, c Kaplan-Meier survival curves were established by CD276 expression. Patients with BLCA were divided in high and low expression groups based on CD276 expression. Overall survival (OS, b) and progression-free survival (PFS, c) of PLAGH cohort are shown. P values were calculated by log-rank test. d Construction of Cd276 whole-body knockout (wKO) mice. e The experimental design of the bladder cancer tumorigenesis model and the schematic diagram of sample collection in batches. f Representative images of CD276 IHC staining in WT and wKO male mice. Scale bar, 100 μm. g The Kaplan-Meier overall survival curve of WT and wKO male mice. P value was calculated by log-rank test. h Representative image of BBN-induced bladder cancer. i Quantification of BLCA weight to body weight ratio (left) and BLCA tumor volume(right) in WT and wKO male mice. Data are presented as mean ± SD (n = 12). P value was calculated by two-tailed unpaired Student’s t test. Representative images of H&E staining for BLCA at different time points (j) and quantification of primary tumor incidence (k) in WT and wKO male mice. Scale bar, 200 μm. P values were calculated by Pearson chi-square test. Representative IHC staining images (l) and percentages of KI67+ (m), CD8+ (n), and Caspase3+ (Cleaved Caspase3, o) cells in WT and wKO male mice. Scale bar, 100 μm. Data were presented as mean ± SD (n = 12). P values were calculated by two-tailed unpaired Student’s t test.
Fig. 2
Fig. 2. Cd276 deletion leads to tumor landscape remodeling and inhibits TAMs infiltration in mouse bladder cancer.
a UMAP plot displaying the results after unbiased clustering. Subpopulations of epithelial cells, macrophages, endothelial cells, fibroblasts, neutrophils, DCs and T cells were identified, with each cell type colored. b UMAP plots showing the expression of feature gene sets in all cell type. c UMAP plots showing cell types in each bladder cancer sample. d Bar plots of proportion of cell type (left) and total cell number (right) in WT or wKO group. e Volcano plot displaying the −Log10 P vs Log2 fold-change of genes differentially expressed between WT and wKO in epithelial cells. f KEGG pathway enrichment analysis using the intergroup differential gene of epithelial cells. g Opal/TSA multicolor IF staining with anti-CD276 and EMR1 antibodies (left). Nuclei are stained with DAPI (blue) and quantification of percentages of EMR1+ cells (right) in WT and wKO male mice. Scale bar, 100 μm. Data was presented as mean ± SD (n = 6). P value was calculated by two-tailed unpaired Student’s t test.
Fig. 3
Fig. 3. Depletion of Cd276 in TAMs suppresses the tumorigenesis and remodels landscape of mouse BLCA.
a Construction of Cd276-conditional knockout (cKO) mice. b The experimental design of the bladder cancer tumorigenesis model. c Representative image of BBN-induced bladder cancer. Quantification of BLCA weight to body weight ratio and BLCA tumor volumes in control and cKO male mice. Data are presented as mean ± SD (n = 6). P value was calculated by two-tailed unpaired Student’s t test. d Representative H&E staining of BLCA (left) and quantification of primary tumor incidence (right) in control and cKO male mice. Scale bar, 200 μm. P value was calculated by Pearson chi-square test. Representative images of KI67, CD8, Caspase3, EMR1 IHC staining (e) and percentages of KI67+, CD8+, Caspase3+ and EMR1+ cells (f) in control and cKO male mice. Scale bar, 100 μm. Data are presented as mean ± SD (n = 6). P values were calculated by two-tailed unpaired Student’s t test. g UMAP plot displaying the results after unbiased clustering. Subpopulations of epithelial cells, macrophages, endothelial cells, fibroblasts, neutrophils, DCs and T cells were identified, with each cell type colored. h UMAP plots showing the expression of feature gene sets in all cell type. i Data of the 7 subclusters of 29310 cells from 4 samples (from left to right): bar plots of proportion of cell type by control or cKO, and total cell number and box plots of the number of UMIs and genes.
Fig. 4
Fig. 4. Depletion of Cd276 in TAMs alters the cellular compositions and gene expression patterns.
a UMAP plot showing 3 clusters of 2967 macrophages (indicated by colors). b Heatmap of signature genes for macrophages clusters. Each cell cluster is represented by four specifically expressed genes. c KEGG pathway enrichment analysis using the characteristic genes of macrophage subpopulation. d Bar plots of number of the subclusters of macrophages in control and cKO male mice. e Volcano plot displaying the −Log10 P vs Log2 fold-change of genes differentially expressed between control and cKO in macrophages. f KEGG pathway enrichment analysis using the intergroup differential gene of macrophages. g Western blot of CLTC, LIPA, LAPTM5 and LAMP2 in macrophages from control and cKO groups using GAPDH as loading control. h Western blot of CCR1, CCR5, CX3CR1 and CXCR4 in macrophages from control and cKO groups using GAPDH as loading control. i Representative flow cytometry plots (left) and statistical analysis of MHCII+ macrophages (right) in control and cKO groups. Data are presented as mean ± SD (n = 6). P value was calculated by two-tailed unpaired Student’s t test. j Western blot of CXCL9 in MHCII+ TAMs and MHCII- TAMs using GAPDH as loading control. k Representative flow cytometry plots (left) and statistical analysis of CD3+CD4+ T cells and CD3+CD8+ cells (right) in control and cKO groups. Data are presented as mean ± SD (n = 6). P value was calculated by two-tailed unpaired Student’s t test. l Representative immunofluorescence (IF) staining images of CD8 (red) and GZMA (green, right). Statistical analysis of the ratio of CD8+ GZMA+ cells to CD8+ cells (CD8T killing capacity) in control and cKO male mice (left). Scale bar, 50 μm. Data are expressed as mean ± SD (n = 6). P values were calculated by two-tailed unpaired Student’s t test.
Fig. 5
Fig. 5. CD276 promotes efferocytosis by regulating expression of AXL/MerTK.
CellphoneDB results showing the capacity of intercellular communication in control (a) and cKO (b) BLCA tissues (the width of the line is determined by the number of interactions between cell types and the color of the line is determined by the transmitter). c Network plot showing the difference in the capacity of intercellular communication between control and cKO BLCA tissues (blue line represents downregulation of intercellular communication, red represents upregulation, and the width of the line represents the number of up- or down-regulations). d Dot plot showing the expression of receptor-ligand pairs between macrophages and epithelial cells in control and cKO BLCA tissues (colors represent mean expression of receptors and ligands). e Heatmap showing the activity of TFs in macrophages from control and cKO male mice. f ChIP-qPCR analysis of JUN binding to Axl and Mertk genes. Data are presented as mean ± SD (n = 3). P values were calculated by two-tailed unpaired Student’s t test. g Western blotting of CD276, JUN, AXL, MERTK and GAPDH in control and cKO BLCA macrophages. h Flow chart of efferocytosis. The apoptotic cells induced by irradiation were co cultured with the sorted cells for 2 h and then analyzed by flow cytometry. Representative flow cytometry plots and quantification of percentage efferocytosis in DCs (i), MDSCs (j) and macrophages (k) from control and cKO male mice. Data presented as mean ± SD (n = 6). P values were calculated by two-tailed unpaired Student’s t test. l Representative flow cytometry plots of tumor (left) and quantification of percentages of efferocytosis in macrophages of different treatment groups (right). Data was shown as mean ± SD (n = 6). P value presented by one-way ANOVA with Tukey’s multiple comparison test.
Fig. 6
Fig. 6. Treatment of R428 reversed Cd276 overexpression-mediated phenotype.
a Construction of CD276-conditional knock-in (cKI) mice. b The experimental design of the bladder cancer tumorigenesis model and strategies of treatment. c The Kaplan-Meier overall survival curve in different treatment groups. P values were calculated by log-rank test. df Representative image of BBN-induced bladder carcinoma (d). Quantification of BLCA weight/body weight ratio (e) and BLCA tumor volume (f) in different treatment groups. Data are presented as mean ± SD (n = 6). P values were presented by one-way ANOVA with Tukey’s multiple comparison test. Representative H&E staining of BLCA (g) and quantification of primary tumor incidence (h) in different treatment groups. Scale bar, 200 μm. P values were calculated by Pearson chi-square test. il Representative immunofluorescence (IF) staining images of Caspase3 (i) and EMR1 (k). Quantification of the percentage of Caspase3+ (j) and EMR1+ (l) cells in different treatment groups. Scale bar, 50 μm. Data are presented as mean ± SD (n = 6). P values were presented by one-way ANOVA with Tukey’s multiple comparison test. Representative flow cytometry plots (m, o) and statistical analysis of percentages of efferocytosis (n) and MHCII+ cells (macrophage antigen presenting capacity, p) in macrophages from different treatment groups. Data are presented as mean ± SD, n = 6. P values were presented by one-way ANOVA with Tukey’s multiple comparison test. Representative immunofluorescence (IF) staining images of CD8 and GZMA (q) and statistical analysis of the ratio of CD8+ GZMA+ cells to CD8+ cells in different treatment groups (r). Scale bar, 100 μm. Data was shown as mean ± SD, n = 6. P values were presented by one-way ANOVA with Tukey’s multiple comparison test.
Fig. 7
Fig. 7. CD276 enhances anti-PD-1-induced tumor regression.
a The experimental design of the bladder cancer tumorigenesis model and different strategies of treatment. The male mice were treated with either anti-CD276 antibody (10 mg/kg body weight, 3 times a week) with or without PD-1 antibody (200 µg/mouse, day1, 3, 5, 7, 14) as indicated starting from week 22. bd Representative image of BBN-induced bladder carcinoma in male mice (b). Quantification of the ratio of BLCA weight to body weight (c) and BLCA tumor volume (d) in the different treatment groups. Data are presented as mean ± SD (n = 6). P values were presented by one-way ANOVA with Tukey’s multiple comparison test. Representative H&E staining of BLCA (e) and quantification of primary tumor incidence (f) in different treatment groups. Scale bar, 200 μm. P values were calculated by Pearson chi-square test. gj Representative Immunofluorescence (IF) staining images of Caspase3 (g) and EMR1 (i). Quantification of percentages of Caspase3+ (h) and EMR1+ (j) cells in different treatment groups. Scale bar, 50 μm. Data was shown as mean ± SD (n = 6). P values were presented by one-way ANOVA with Tukey’s multiple comparison test. Representative flow cytometry plots (k, m) and quantification of the percentages of efferocytosis (l) and percentages of MHCII+ cells (antigen presenting ability of macrophages, n) in macrophages of different treatment groups. Data was shown as mean ± SD (n = 6). P values were presented by one-way ANOVA with Tukey’s multiple comparison test. o, p Representative Immunofluorescence (IF) staining images of CD8 (red) and GZMA (green, o). Statistical analysis of the radios of CD8+ GZMA+ cells to CD8+ cells (p) in different treatment groups. Scale bar, 50 μm. Data are shown as mean ± SD (n = 6). P values were presented by one-way ANOVA with Tukey’s multiple comparison test.

Similar articles

Cited by

References

    1. Kalbasi A, Ribas A. Tumour-intrinsic resistance to immune checkpoint blockade. Nat. Rev. Immunol. 2020;20:25–39. doi: 10.1038/s41577-019-0218-4. - DOI - PMC - PubMed
    1. von der Maase H, et al. Long-term survival results of a randomized trial comparing gemcitabine plus cisplatin, with methotrexate, vinblastine, doxorubicin, plus cisplatin in patients with bladder cancer. J. Clin. Oncol. 2005;23:4602–4608. doi: 10.1200/JCO.2005.07.757. - DOI - PubMed
    1. Patel VG, Oh WK, Galsky MD. Treatment of muscle-invasive and advanced bladder cancer in 2020. CA: Cancer J. Clin. 2020;70:404–423. - PubMed
    1. Liu S, et al. The role of CD276 in cancers. Front. Oncol. 2021;11:654684. doi: 10.3389/fonc.2021.654684. - DOI - PMC - PubMed
    1. Feng R, Chen Y, Liu Y, Zhou Q, Zhang W. The role of B7-H3 in tumors and its potential in clinical application. Int. Immunopharmacol. 2021;101:108153. doi: 10.1016/j.intimp.2021.108153. - DOI - PubMed