. 2024 Apr 1;15(4):241.
doi: 10.1038/s41419-024-06629-2.

Targeting RCC1 to block the human soft-tissue sarcoma by disrupting nucleo-cytoplasmic trafficking of Skp2

Affiliations

Targeting RCC1 to block the human soft-tissue sarcoma by disrupting nucleo-cytoplasmic trafficking of Skp2

Mingzhi Zhuang et al. Cell Death Dis. .

Abstract

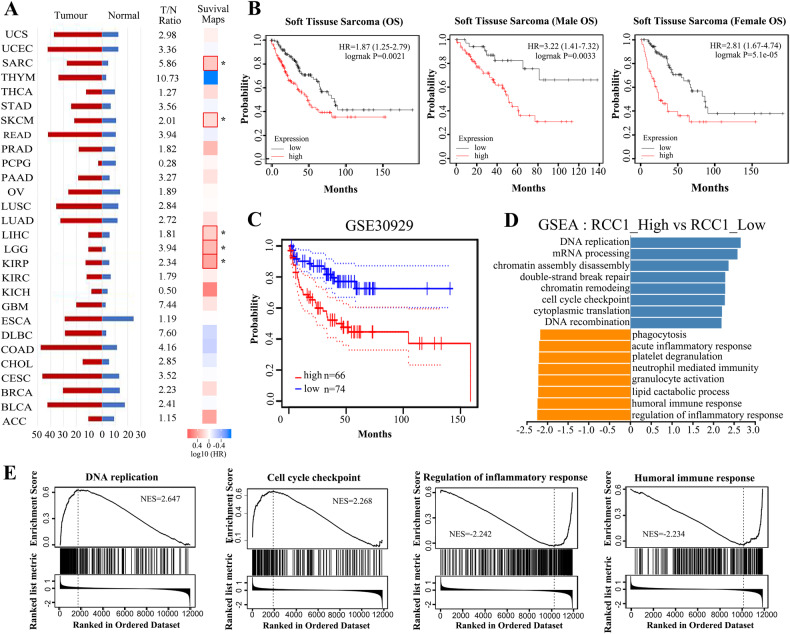
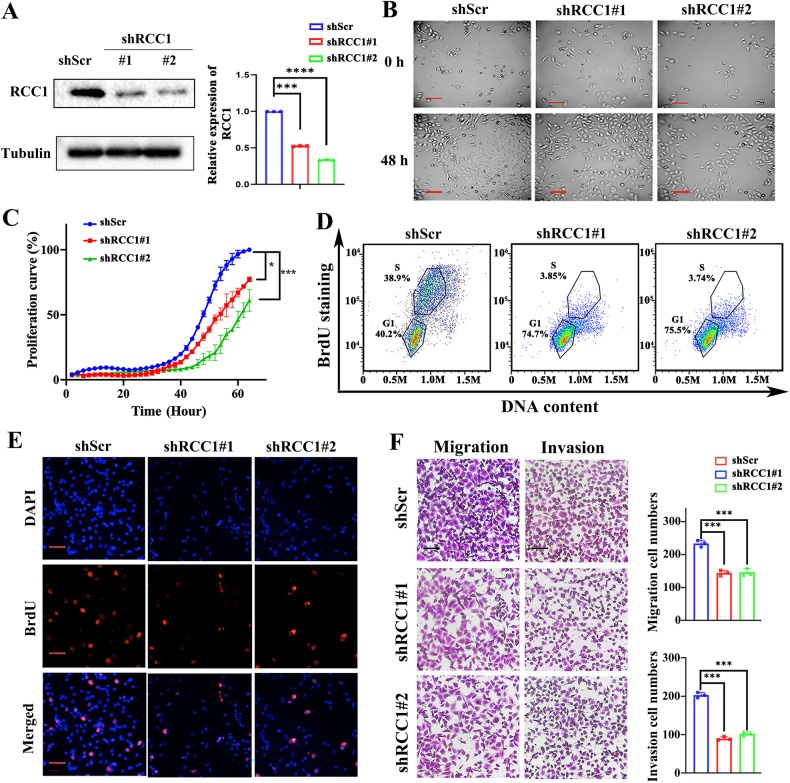
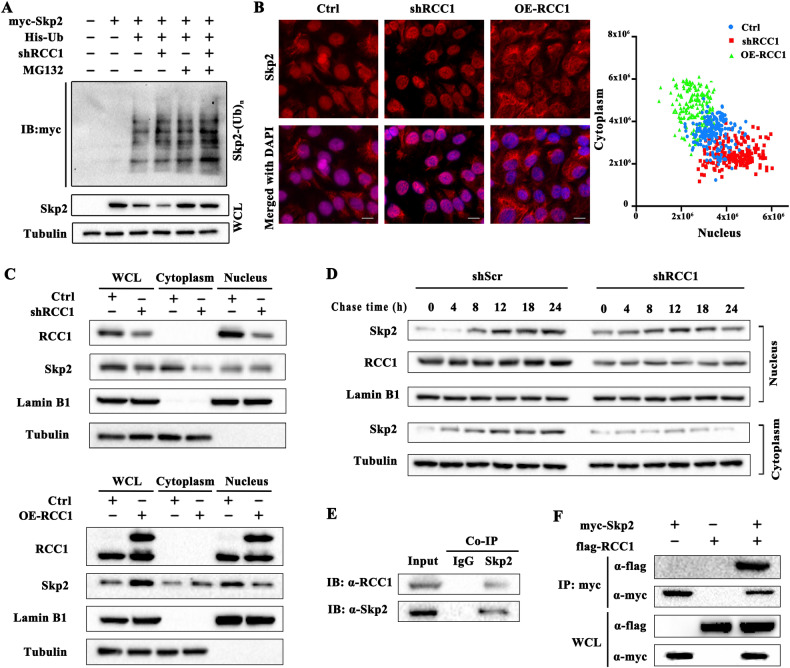
Soft-tissue sarcomas (STS) emerges as formidable challenges in clinics due to the complex genetic heterogeneity, high rates of local recurrence and metastasis. Exploring specific targets and biomarkers would benefit the prognosis and treatment of STS. Here, we identified RCC1, a guanine-nucleotide exchange factor for Ran, as an oncogene and a potential intervention target in STS. Bioinformatics analysis indicated that RCC1 is highly expressed and correlated with poor prognosis in STS. Functional studies showed that RCC1 knockdown significantly inhibited the cell cycle transition, proliferation and migration of STS cells in vitro, and the growth of STS xenografts in mice. Mechanistically, we identified Skp2 as a downstream target of RCC1 in STS. Loss of RCC1 substantially diminished Skp2 abundance by compromising its protein stability, resulting in the upregulation of p27Kip1 and G1/S transition arrest. Specifically, RCC1 might facilitate the nucleo-cytoplasmic trafficking of Skp2 via direct interaction. As a result, the cytoplasmic retention of Skp2 would further protect it from ubiquitination and degradation. Notably, recovery of Skp2 expression largely reversed the phenotypes induced by RCC1 knockdown in STS cells. Collectively, this study unveils a novel RCC1-Skp2-p27Kip1 axis in STS oncogenesis, which holds promise for improving prognosis and treatment of this formidable malignancy.


Conflict of interest statement

The authors declare no competing interests.

Figures

Fig. 1
Fig. 1. The upregulation of RCC1 is correlated with poor prognosis of STS patients.
A The expression level of RCC1 across various cancer types in TCGA database,, along with the Tumor-to-Normal expression ratio. Survival map of hazard ratio (HR) shows the prognostic impacts of RCC1 on multiple cancer type. The red and blue blocks represent higher and lower risks, respectively. The bounding boxes depicted the significant (p < 0.05) unfavorable and favorable results, respectively. B The prognostic analysis between high and low expression of RCC1 in TCGA database. C Kaplan-Meier analysis for RCC1 expression in GSE 30929 patient cohort. D, E Gene set enrichment analysis (GSEA) showed that the samples with high RCC1 expression enriched in DNA replication (NES = 2.647), cell cycle checkpoint (NES = 2.268). The most downregulated gene sets with high RCC1 expression was clustered in regulation of inflammatory response (NES = −2.242), humoral immune response (NES = −2.234).
Fig. 2
Fig. 2. Knockdown of RCC1 represses the cell growth and motility of STS cells.
A Western blot analysis of RCC1 stable knockdown soft tissue sarcoma cell line SW872 by lentivirus mediated stable transduction (shScr: sh-scramble). B Endpoint bright field images of RCC1 knockdown SW872 cell lines by using live cell imaging system ZenCell owl. C Real-time cellular analysis (RTCA) of RCC1 knockdown SW872 cell lines. D FACS analyses using BrdU and PI staining for shScr and RCC1-KD SW872 cells. The cells belong to different cell cycle sub-phase was determined within the circle, with the percentage shown close to it. E Immunofluorescence images of indicated cells stained by pulse-incorporation of BrdU and immunostaining using anti-BrdU antibody (red). DAPI was used to counterstain the cells nuclei (blue). F Knockdown of RCC1 decreased migration and invasion of SW872 cells. The cells in five randomly selected fields were counted and statistically analyzed. The number of migration/invasion cells per field was fewer in shRCC1 cells compared with shScr cells. Data is expressed as mean ± SD (n = 3). Significance (*p < 0.05, ***p < 0.001). Scale bars: 100 μm.
Fig. 3
Fig. 3. Knockdown of RCC1 reduces the protein stability of Skp2 in STS cells, leading to the accumulation of p27Kip1.
A qRT-PCR for mRNA expression analysis of proliferation marker genes (Skp2, cyclin D, cyclin R, MCM3, MCM6, MCM7, E2F1, p57, p27Kip1, p16Inkand PCNA) in RCC1 knockdown (shRCC1#1, shRCC1#2) SW872 cells. B Immunoblotting analysis of RCC1, Skp2, p27Kip1, E2F1, cyclin A2 and MCM3 in shScr and RCC1 knockdown (shRCC1#1, shRCC1#2) SW872 cells by lentivirus mediated transduction. Tubulin was used as the loading control. C Cycloheximide (CHX) assays showed that RCC1 knockdown accelerating the degradation rate of Skp2 in SW872 cells. Indicated cells were treated with cycloheximide (CHX, 35 μM) to inhibit protein synthesis, and harvested at indicated time-points for immunoblotting analysis. Tubulin was used as the loading control. Quantification of Skp2 and p27Kip1 abundance normalized to tubulin is shown alongside. D Proteasome degradation assay of protein Skp2 in RCC1 knockdown SW872 cells. Cells were treated with or without the proteasome inhibitor MG132 (20 μM) for 6 hours before harvest and western blot analysis. Tubulin was used as loading control. E FACS analyses of shScr or shRCC1 SW872 cells transduced with Skp2 overexpression plasmid for 48 hours. The cells belong to different cell cycle sub-phase was determined, with the percentage shown alongside using barchart. F The cell proliferation rate of Skp2 overexpression (OE-Skp2) in shScr or shRCC1 SW872 cells was analyzed by CCK8. Data is expressed as mean ± SD (n = 3). Significance (*p < 0.05, **p < 0.01, ***p < 0.001).
Fig. 4
Fig. 4. Knockdown of RCC1 elevates the poly-ubiquitination of Skp2 by promoting its nucleus retention.
A In vivo exogenous ubiquitination assay to detect ubiquitination of Skp2 influenced by RCC1 knockdown on SW872 cell. Each cell group was co-transduced with Myc-Skp2, His-Ubiquitin (His-Ub) and shScr/shRCC1 plasmids as indicated. B Immunofluorescence analysis was performed to determine the subcellular localization of Skp2 (red) in SW872 cells with shRCC1 and RCC1 overexpression (OE-RCC1). DAPI was used to counterstain the cells nuclei (blue). The X-Y scatter plot of 200 cells from control (blue dots), shRCC1 (red dots) and OE-RCC1 (green dots) groups based on the quantification of nucleus and cytoplasm fluorescence intensity of Skp2 is shown alongside. Scale bars: 10 μm. Data is expressed as mean ± SD (n = 3). Significance (**p < 0.01, ***p < 0.001). C Immunoblotting analysis of subcellular localization of Skp2 in shRCC1 or OE-RCC1 SW872 cells. Cells were starved for 48 hours and subsequently released into full culture medium for 12 hours. Lamin B1 was used as nuclear control and tubulin was used as cytoplasmic control. D Immunoblotting analysis was conducted to investigate the subcellular localization regulation of Skp2 in RCC1 knockdown SW872 cells throughout the cell cycle process. SW872 cells were transduced with the control plasmid (shScr) or RCC1 knockdown plasmid (shRCC1) were starving for 48 hours and subsequently released into full culture medium for several time period (0, 4, 8, 12, 18, and 24 hours). Cytoplasmic and nuclear extracts were analyzed by immuno-blotting. Lamin B1 was used as nuclear control and tubulin was used as cytoplasmic control. In vivo protein co-immunoprecipitation of endogenous Skp2 and RCC1 in SW872 cells (E) and exogenous binding in HEK 293 T cells (F).
Fig. 5
Fig. 5. Knockdown of RCC1 inhibits the growth of STS xenograft in mice.
A Photograph of xenograft tumors from shScr, shRCC1, Skp2AA or shRCC1+Skp2AA groups harvested at the endpoint. B Growth curves of inoculated xenograft tumors and average tumor weight at the endpoint from shScr, shRCC1, Skp2AA or shRCC1+Skp2AA groups. Data are expressed as mean ± SD (n = 5, **p < 0.01, ***p < 0.001). C Representative H&E images and immunohistochemistry (IHC) of Ki67, Skp2 and p27Kip1 of xenograft tumor sections from shScr, shRCC1, Skp2AA or shRCC1+Skp2AA groups. Percentage of IHC positive cells are quantified alongside. Scale bars: 50 μm. D, E Relative mRNA and protein abundance of Skp2 and marker genes (MCM3, E2F1, PCNA, Skp2, p27Kip1, CCNE2) of related pathway in harvested xenograft tumor samples (shScr, shRCC1, Skp2AA or shRCC1+Skp2AA). Data are expressed as mean ± SD (n = 3, *p < 0.05, **p < 0.01, ***p < 0.001).
Fig. 6
Fig. 6. Proposed model for knockdown of RCC1 induced Skp2 nuclear retention and degradation, subsequently influences its oncogenic function.
In this model, the present of RCC1 maintained the nuclear-cytoplasmic process of Skp2 in soft-tissue sarcoma. Decreased RCC1 sequesters Skp2 within nuclear, which results in the subsequent ubiquitination and degradation of Skp2. Lack of cytoplasmic Skp2 restored the expression of p27Kip1, and then retarded the proliferation, migration of soft-tissue sarcoma.

Similar articles

Cited by

References

    1. Cancer Genome Atlas Research Network. Electronic address edsc, Cancer Genome Atlas Research N. Comprehensive and Integrated Genomic Characterization of Adult Soft Tissue Sarcomas. Cell. 2017;171:950–65.e28. doi: 10.1016/j.cell.2017.10.014. - DOI - PMC - PubMed
    1. Huang HY, Huang WW, Wu JM, Huang CK, Wang JW, Eng HL, et al. Flow cytometric analysis of DNA ploidy and S-phase fraction in primary localized myxofibrosarcoma: correlations with clinicopathological factors, Skp2 expression, and patient survival. Ann Surg Oncol. 2008;15:2239–49. doi: 10.1245/s10434-008-9968-0. - DOI - PubMed
    1. Li GZ, Okada T, Kim YM, Agaram NP, Sanchez-Vega F, Shen Y, et al. Rb and p53-deficient myxofibrosarcoma and undifferentiated pleomorphic sarcoma require Skp2 for survival. Cancer Res. 2020;80:2461–71. doi: 10.1158/0008-5472.CAN-19-1269. - DOI - PMC - PubMed
    1. Oliveira AM, Okuno SH, Nascimento AG, Lloyd RV. Skp2 protein expression in soft tissue sarcomas. J Clin Oncol. 2003;21:722–7. doi: 10.1200/JCO.2003.05.112. - DOI - PubMed
    1. Wei W, Ayad NG, Wan Y, Zhang G-J, Kirschner MW, Kaelin WG., Jr Degradation of the SCF component Skp2 in cell-cycle phase G1 by the anaphase-promoting complex. Nature. 2004;428:194–8. doi: 10.1038/nature02381. - DOI - PubMed

Publication types

MeSH terms

Substances