. 2024 May;8(5):611-627.
doi: 10.1038/s41551-024-01190-x. Epub 2024 Apr 1.

A serine-conjugated butyrate prodrug with high oral bioavailability suppresses autoimmune arthritis and neuroinflammation in mice

Affiliations

A serine-conjugated butyrate prodrug with high oral bioavailability suppresses autoimmune arthritis and neuroinflammation in mice

Shijie Cao et al. Nat Biomed Eng. 2024 May.

Abstract

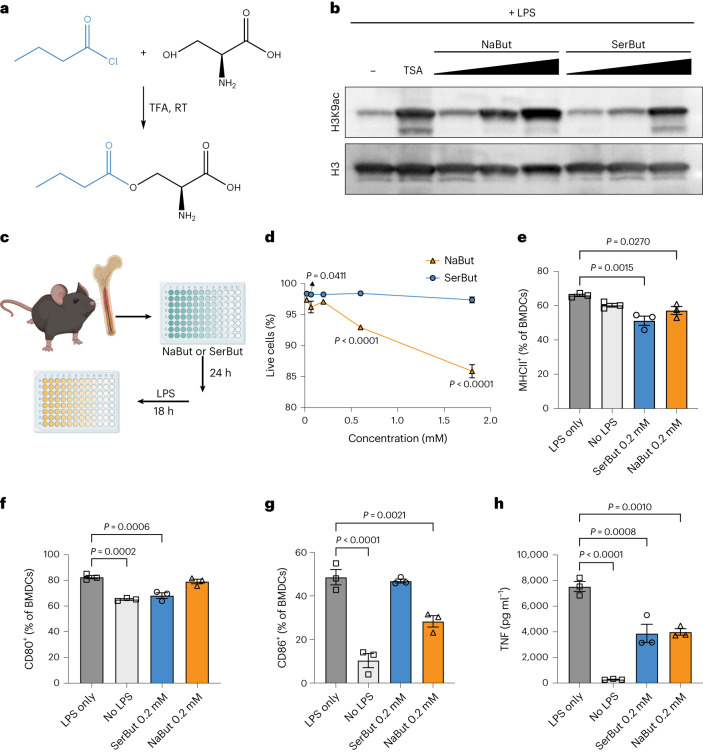
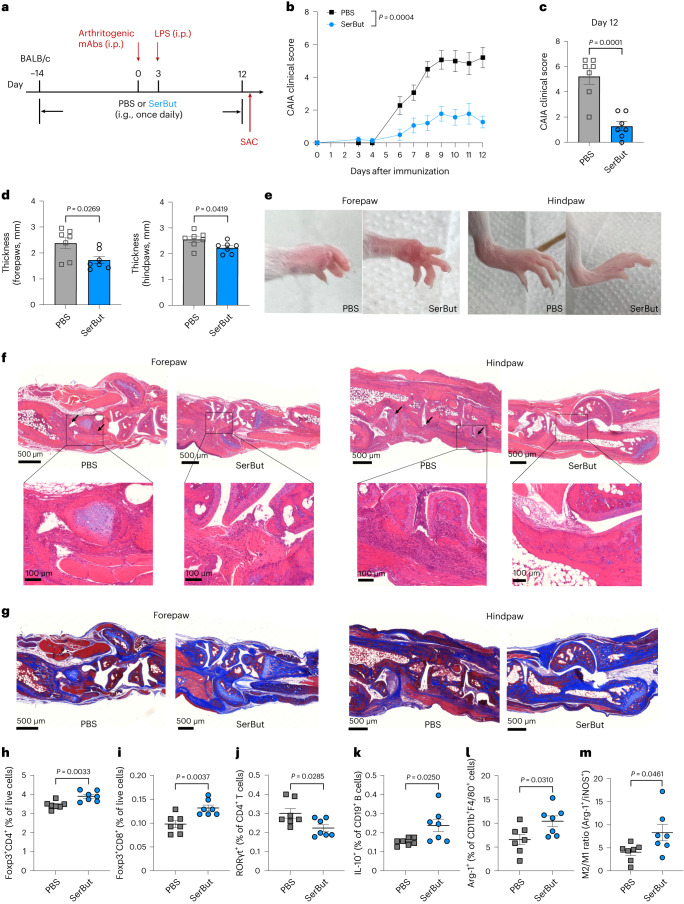
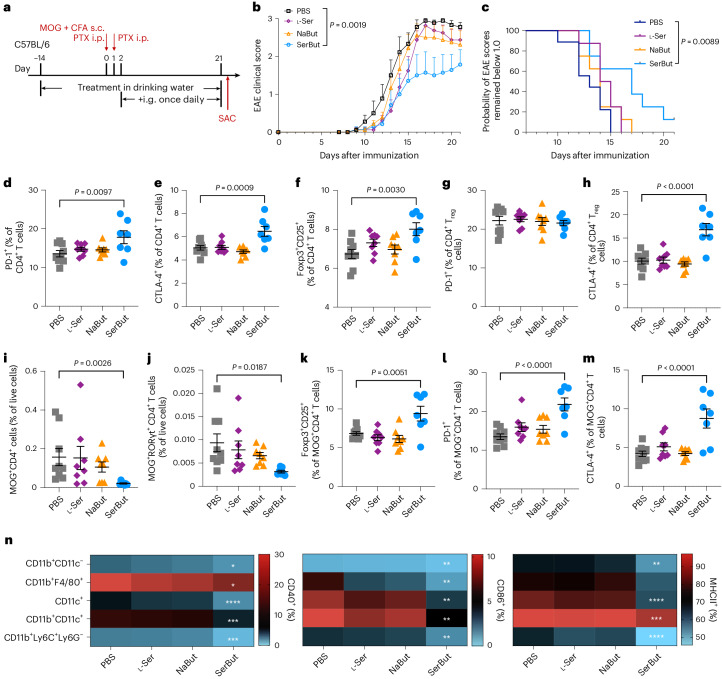
Butyrate-a metabolite produced by commensal bacteria-has been extensively studied for its immunomodulatory effects on immune cells, including regulatory T cells, macrophages and dendritic cells. However, the development of butyrate as a drug has been hindered by butyrate's poor oral bioavailability, owing to its rapid metabolism in the gut, its low potency (hence, necessitating high dosing), and its foul smell and taste. Here we report that the oral bioavailability of butyrate can be increased by esterifying it to serine, an amino acid transporter that aids the escape of the resulting odourless and tasteless prodrug (O-butyryl-L-serine, which we named SerBut) from the gut, enhancing its systemic uptake. In mice with collagen-antibody-induced arthritis (a model of rheumatoid arthritis) and with experimental autoimmune encephalomyelitis (a model of multiple sclerosis), we show that SerBut substantially ameliorated disease severity, modulated key immune cell populations systemically and in disease-associated tissues, and reduced inflammatory responses without compromising the global immune response to vaccination. SerBut may become a promising therapeutic for autoimmune and inflammatory diseases.


Conflict of interest statement

S.C., E.B., M.M.R., E.A.W. and J.A.H. are inventors on a patent application (WO2022226482A1) filed by the University of Chicago on uses of SerBut. The other authors declare no competing interests.

Figures

Fig. 1
Fig. 1. Conjugation of l-Ser to butyrate maintained its biological activity.
a, Chemical synthesis of serine conjugate with butyrate (SerBut). TFA, trifluoroacetic acid. RT, room temperature. b, Whole cell lysates of Raw 264.7 macrophages stimulated with the indicated concentrations of NaBut, SerBut or trichostatin A (TSA) as well as 100 ng ml−1 LPS for 18 h were probed for histone acetylation activity via western blot. c, Experimental schema on BMDCs incubated with NaBut or SerBut at a series of concentrations for 24 h, followed by LPS stimulation for 18 h. d, Percentage of live BMDCs after treatment. eg, Percentage of MHC class II+ (e), CD80+ (f) or CD86+ (g) BMDCs analysed by flow cytometry. h, TNF concentration in the cell culture supernatant of BMDCs. n = 3; data are representative of two independent experiments. Data represent mean ± s.e.m. Statistical analyses were performed using one-way ANOVA with Dunnett’s test. P values less than 0.05 are shown. Panel c created with BioRender.com. Source data
Fig. 2
Fig. 2. Butyrate biodistribution after SerBut or NaBut oral administration to C57BL/6 mice.
a, Blood was collected by cheek bleeding at 3 h post oral gavage. Mice were killed and perfused at 3 h post oral gavage, and organs were collected for butyrate quantification. bh, The amount of butyrate was detected and quantified in the plasma (b), liver (c), mLNs (d), spleen (e), lung (f), spinal cord (g) and brain (h). Butyrate was derivatized with 3-nitrophenylhydrazine and quantified by LC-MS/MS. n = 5 mice per group. Experiments were repeated twice; data are representative of two independent experiments. Data represent mean ± s.e.m. Statistical analyses were performed using one-way ANOVA with Dunnett’s test. P values less than 0.05 are shown. Panel a created with BioRender.com. Source data
Fig. 3
Fig. 3. SerBut suppresses arthritis development.
a, Experimental schema of the CAIA model. Mice were orally gavaged with PBS or SerBut (25 mg) once daily starting on day −14. CAIA was induced by passive immunization with anti-collagen antibody cocktails on day 0, followed by i.p. injection of LPS. i.g., intragastric administration; SAC, mice sacrificed. b, Arthritis scores in mice measured daily from day 3 after immunization. c, Arthritis scores from PBS- or SerBut-treated mice on day 12. d, The thickness of forepaws or hindpaws measured on day 12 from mice treated with PBS or SerBut. e, Representative photos of paws after treatment. f, Representative images of mouse joints from paws stained with haematoxylin and eosin on day 12 in each treatment group. The arrows indicate immune cell infiltration. g, Representative images of mouse joints from paws stained with Masson’s trichrome on day 12. The blue colour represents collagen staining. h,i, Percentage of Foxp3+ regulatory CD4+ T cells (h) or Foxp3+ regulatory CD8+ T cells (i) of live cells in the spleen measured by flow cytometry. jm, Percentage of RORγt+ of CD4+ T cells (j) and IL-10+ of CD19+ B cells (k), as well as Arg-1+ of CD11b+F4/80+ macrophages (l) and M2/M1 macrophage ratio (m) in the hock-draining LNs. n = 7 mice per group. Experiments were repeated twice, and data are representative of two independent experiments. Data represent mean ± s.e.m. Statistical analyses were performed using Student’s t-test. Source data
Fig. 4
Fig. 4. SerBut, but not NaBut, suppresses arthritis development.
a, Experimental schema of the CAIA model. CAIA was induced by passive immunization with anti-collagen antibody cocktails on day 0, followed by i.p. injection of LPS on day 3. Starting on day 4, mice were orally gavaged with PBS (n = 6), NaBut (15 mg, molar equivalent to SerBut, n = 6) or SerBut (25 mg, n = 5) twice daily starting on day 4 until the end of the experiment. b, Arthritis scores in mice measured daily after immunization. c, Arthritis scores from PBS- or SerBut-treated mice on day 13. d,e, Percentage of Foxp3+CD25+ regulatory CD4+ T cells (d) or Foxp3+ regulatory CD8+ T cells (e) of live cells in the hock-draining LNs. f,g, Percentage of Foxp3+CD25+ regulatory CD4+ T cells (f) or Foxp3+ regulatory CD8+ T cells (g) of live cells in the spleen. The experiments comparing PBS and SerBut were repeated three times, and the results were consistent. NaBut was tested once as added in this experiment. Data represent mean ± s.e.m. Statistical analyses were performed using one-way ANOVA with Tukey’s post hoc test. P values less than 0.05 are shown. Source data
Fig. 5
Fig. 5. SerBut ameliorates EAE development more effectively than free butyrate or serine.
a, Experimental schema. EAE was induced in C57BL/6 mice using MOG35–55/CFA with pertussis toxin (140 ng). Mice were given drinking water containing 100 mM NaBut, l-Ser or SerBut from day −14 until the end of the study. On day 2 after EAE induction, PBS (n = 9), NaBut (15 mg, molar equivalent to SerBut, n = 8), l-Ser (12 mg, molar equivalent to SerBut, n = 8) or SerBut (24 mg, n = 7) was administered once daily. b, Disease progression as indicated by the clinical score. The areas under the curve were compared, and statistical analyses were performed using one-way ANOVA with Dunnett’s test. c, The probability of EAE clinical scores remaining below 1.0 for the four groups. Statistical analysis was performed using the log-rank (Mantel–Cox) test comparing every two groups. dm, Phenotypes of CD4+ T cells from the SC-dLNs (that is, the iliac and cervical LNs), including the percentage of PD-1+ (d), CTLA-4+ (e) or Foxp3+CD25+ (f) of total CD4+ T cells; PD-1+ (g) or CTLA-4+ (h) of Foxp3+CD25+CD4+ Treg cells; the percentage of MOG tetramer-positive CD4+ (i) or CD4+RORγt+ (j) T cells of total live cells; and Foxp3+CD25+ (k), PD-1+ (l) or CTLA-4+ (m) of MOG tetramer-positive CD4+ T cells. n, Heatmap of the percentage of co-stimulatory molecule (CD40+ or CD86+) or MHCII+ cells of myeloid cells in the SC-dLNs, indicated by the colour as shown in the corresponding scale bar. Data represent mean ± s.e.m. Experiments were repeated with similar, though not identical, dosing regimens, and the results were consistent. Statistical analyses were compared between PBS and each treatment group using one-way ANOVA with Dunnett’s test or Kruskal–Wallis test (if not normally distributed). In bm, P values less than 0.05 are shown. In n, *P < 0.05, **P < 0.01, ***P < 0.001 and ****P < 0.0001. For raw figure and the P value for n, refer to Supplementary Fig. 10. Source data
Fig. 6
Fig. 6. Twice-daily gavage of SerBut post-EAE induction suppressed disease progression.
a, Experimental schema. EAE was induced in C57BL/6 mice using MOG35–55/CFA with pertussis toxin (140 ng). On day 2 after EAE induction, PBS (n = 9) or SerBut (n = 8) at 24 mg per dose was administered twice daily by gavage. b, Disease progression as indicated by the clinical score. The areas under the curve were compared, and statistical analyses were performed using Student’s t-test. c, The probability of EAE clinical scores remaining below 1.0 in the two groups. Statistical analysis was performed using the log-rank (Mantel–Cox) test. d, Body weight changes. e, Representative immunofluorescence images of spinal cord sections from mice treated with PBS or SerBut. Red, anti-CD45 staining; green, anti-MBP staining. f, The concentration of IFNγ normalized by the total protein in the spinal cord homogenized supernatant. gl, The percentage of CD45+ (g), CD45+CD3+ (h), RORγt+CD4+ (i), CD11chi (j), CD11b+CD11c (k) and F4/80+CD11b+ (l) of live cells in the spinal cord. mo, The percentage of MHCII+ of CD11chi (m), CD11b+CD11c (n) or F4/80+CD11b+ (o) cells in the spinal cord. Data represent mean ± s.e.m. Experiments were repeated with similar, though not identical, dosing regimens, and the results were consistent. Statistical analyses were performed using Student’s t-test. Source data
Fig. 7
Fig. 7. SerBut does not impact immune responses to vaccination compared with FTY720.
a, Experimental schema. Mice were orally gavaged with PBS, SerBut (twice daily, 25 mg per dose) or FTY720 (once daily, 0.02 mg per dose) starting on day −3 until the end of the experiment. On day 0, mice were immunized subcutaneously in the front hocks with 10 μg endotoxin-free OVA, 50 μg alum and 5 μg MPLA. b,c, Mice were bled on day 9 (b) and day 13 (c), and plasma was analysed for anti-OVA IgG antibodies. di, Representative flow cytometry dot plots of CD19+B220+ (d,e), CD4+ (f,g), and Foxp3+CD4+ T cells (h,i) in the spleen, along with their respective percentages of the parental cell population (d,f,h), or of the total live cells (e,g,i). n = 5 mice per group. Data represent mean ± s.e.m. Statistical analyses were performed using one-way ANOVA with Dunnett’s post hoc test. P values less than 0.05 are shown. Source data
Extended Data Fig. 1
Extended Data Fig. 1. The immunological effects in peripheral tissues from SerBut treatment in the EAE model from the experiment in Fig. 6.
a,b, The percentage of MHC class II+% and geometric mean fluorescent intensity (gMFI) of CD11chi dendritic cells (a) or F4/80+CD11b+ macrophages (b) isolated from mesenteric LN. c, The percentage of Foxp3+ of CD4+ T cells in the spleen, spinal cord-draining LNs (SC-dLNs), or mesenteric LNs (mLNs). Data represent mean ± s.e.m. Statistical analyses were performed using Student’s t-test. Source data
Extended Data Fig. 2
Extended Data Fig. 2. SerBut did not exhibit significant therapeutic efficacy in relapsing-remitting EAE.
a. Experimental schema. EAE was induced in SJL/J mice using PLP139-151/CFA with 100 ng pertussis toxin. Starting on day 19, mice were regrouped into two treatment groups with equivalent average clinical score, and received twice daily oral gavage of either PBS (n = 6) or SerBut (n = 8) at 24 mg/dose. b. Disease progression as indicated by the clinical score. c. The percentage of CD11b+CD45low microglia cells of live cells in the spinal cord. d-h. The percentage of CD11b+CD11c+(d), RORγ+CD4+Foxp3(e), CD4+Foxp3+(f), CD4+PD-1+(g), PD-1+CD4+Foxp3+(h) of CD45+ cells in the spinal cord. Data represent mean ± s.e.m. Statistical analyses were performed using Student’s t-test. Source data
Extended Data Fig. 3
Extended Data Fig. 3. SerBut’s impact on immune responses to vaccination in comparison to FTY720.
Production of cytokines TNFa (a), IFNγ (b), IL-6 (c), IL-5 (d), IL-13 (e), and IL-10 (f), measured in the supernatant of isolated splenocytes upon restimulation with OVA protein for 3 days. n = 5 mice per group. Data represent mean ± s.e.m. Statistical analyses were performed using two-way ANOVA with Dunnett’s post hoc test. P values less than 0.05 were shown. Source data
Extended Data Fig. 4
Extended Data Fig. 4. Immunological effects of SerBut treatment in healthy C57BL/6 mice on the T cells in the spleen, LNs, or lamina propria.
a. Experimental schema. C57BL/6 mice at 10 wks old were oral administered with PBS (n = 5), NaBut (15 mg, molar equivalent to SerBut, n = 6) or SerBut (25 mg, n = 6), twice daily for 10 days, and sacrificed for cellular analysis. b. CD4+Foxp3+ Tregs percentage of live cells in spleen, mesenteric LNs (mLNs), hock-draining LNs (hock-dLNs), and spinal cord-draining LNs (SC-dLNs). c. Tbet+, GATA3+, RORγ+ Foxp3, RORγ+ Foxp3+, PD-1+, CTLA-4+ of CD4+ T cells in the spleen. Data represent mean ± s.e.m. Statistical analyses were performed using one-way ANOVA with Tukey’s post hoc test. P values less than 0.05 were shown. Source data

References

    1. Skelly AN, Sato Y, Kearney S, Honda K. Mining the microbiota for microbial and metabolite-based immunotherapies. Nat. Rev. Immunol. 2019;19:305–323. doi: 10.1038/s41577-019-0144-5. - DOI - PubMed
    1. Agus A, Clément K, Sokol H. Gut microbiota-derived metabolites as central regulators in metabolic disorders. Gut. 2021;70:1174–1182. doi: 10.1136/gutjnl-2020-323071. - DOI - PMC - PubMed
    1. Miyauchi E, Shimokawa C, Steimle A, Desai MS, Ohno H. The impact of the gut microbiome on extra-intestinal autoimmune diseases. Nat. Rev. Immunol. 2023;23:9–23. doi: 10.1038/s41577-022-00727-y. - DOI - PubMed
    1. Honda K, Littman DR. The microbiota in adaptive immune homeostasis and disease. Nature. 2016;535:75–84. doi: 10.1038/nature18848. - DOI - PubMed
    1. Donohoe DR, et al. The microbiome and butyrate regulate energy metabolism and autophagy in the mammalian colon. Cell Metab. 2011;13:517–526. doi: 10.1016/j.cmet.2011.02.018. - DOI - PMC - PubMed

MeSH terms