. 2024 May;25(5):834-846.
doi: 10.1038/s41590-024-01802-3. Epub 2024 Apr 1.

Unconventional human CD61 pairing with CD103 promotes TCR signaling and antigen-specific T cell cytotoxicity

Affiliations

Unconventional human CD61 pairing with CD103 promotes TCR signaling and antigen-specific T cell cytotoxicity

Megat H B A Hamid et al. Nat Immunol. 2024 May.

Abstract

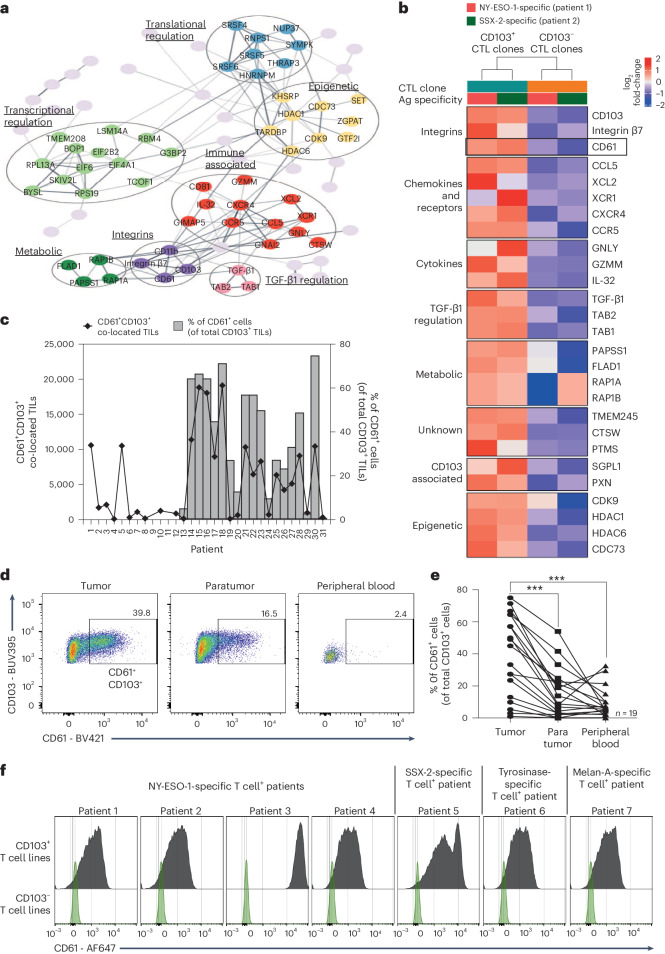
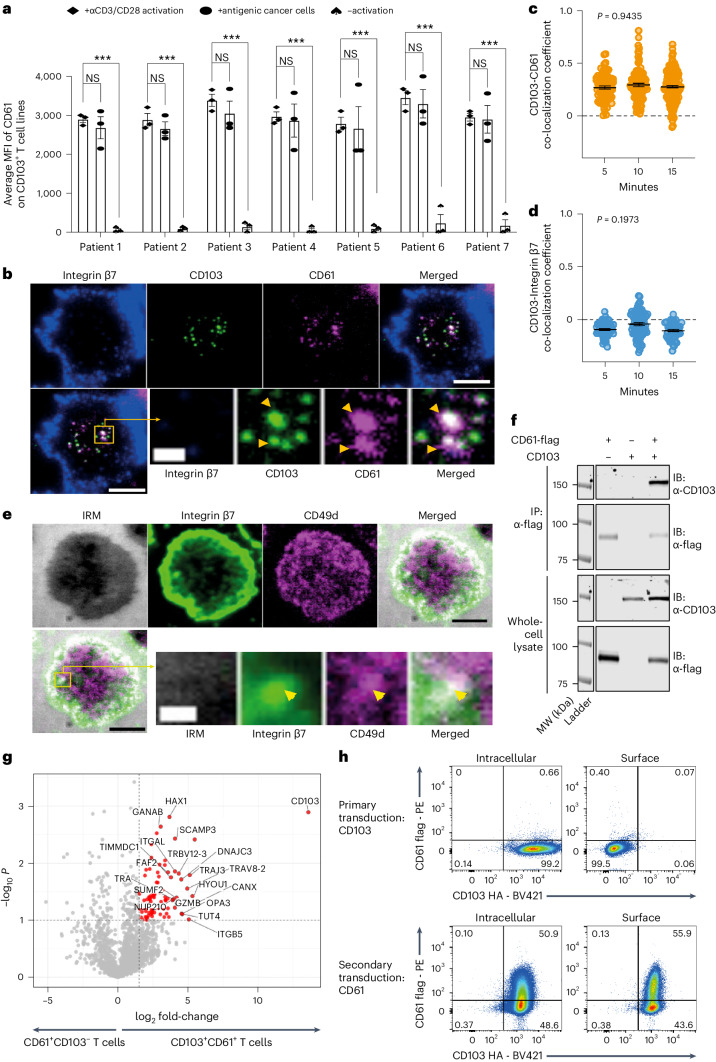
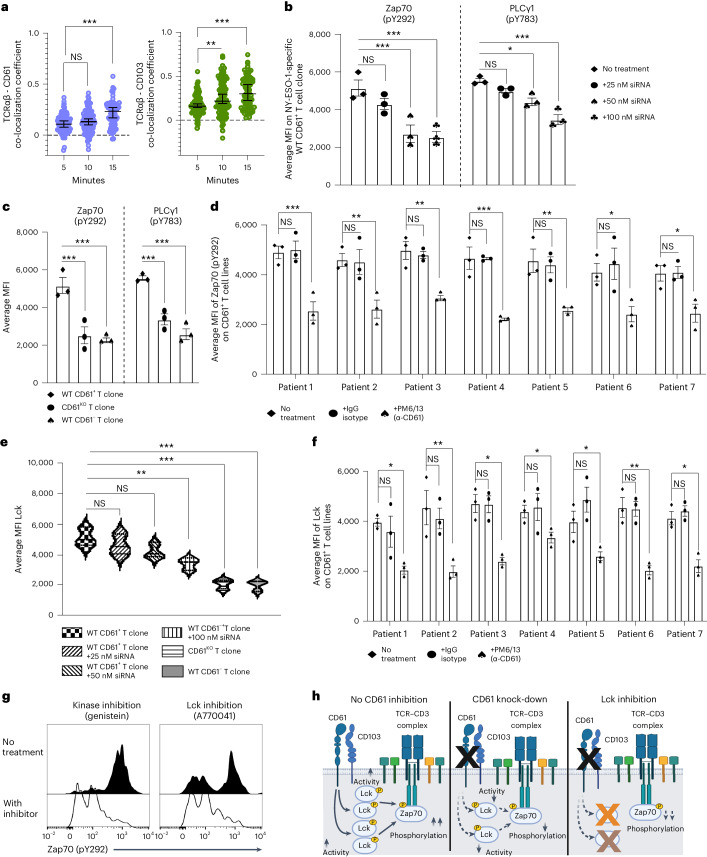
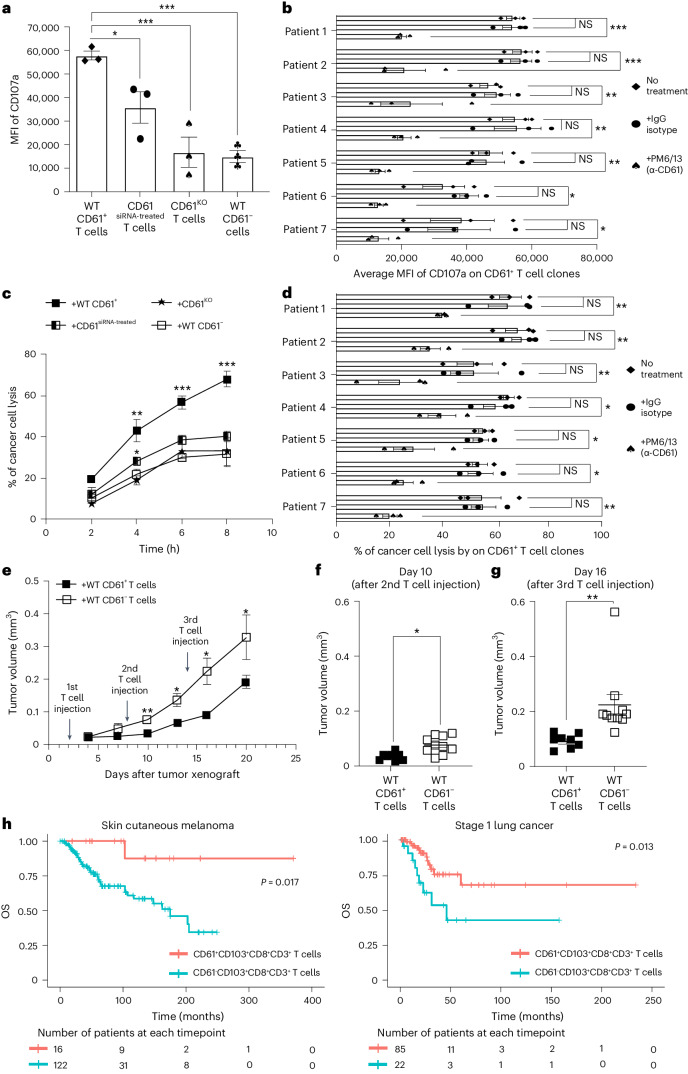
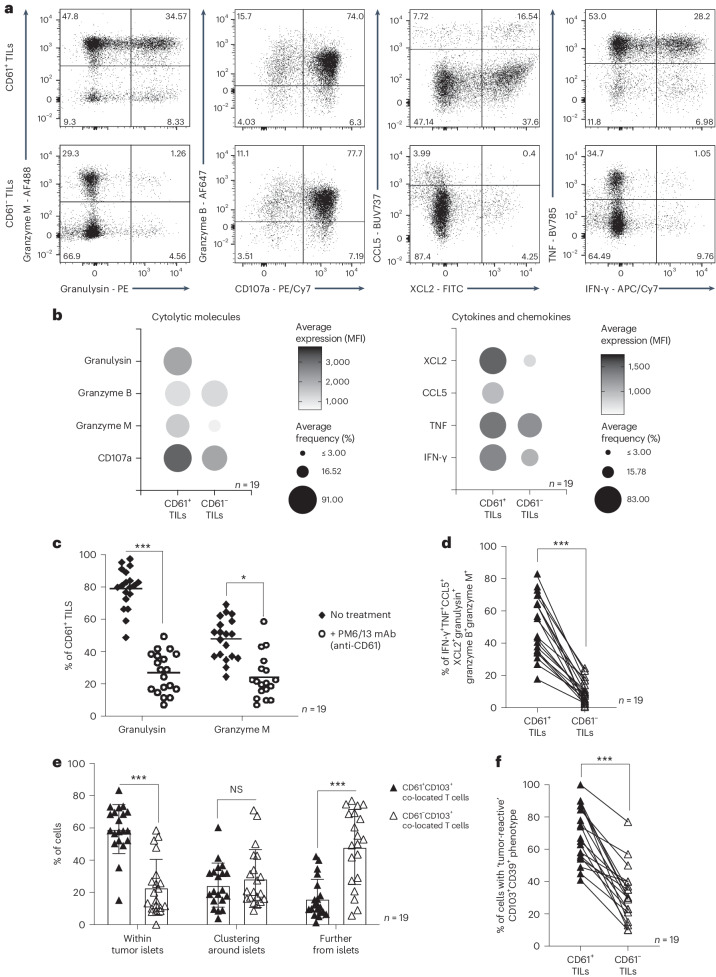
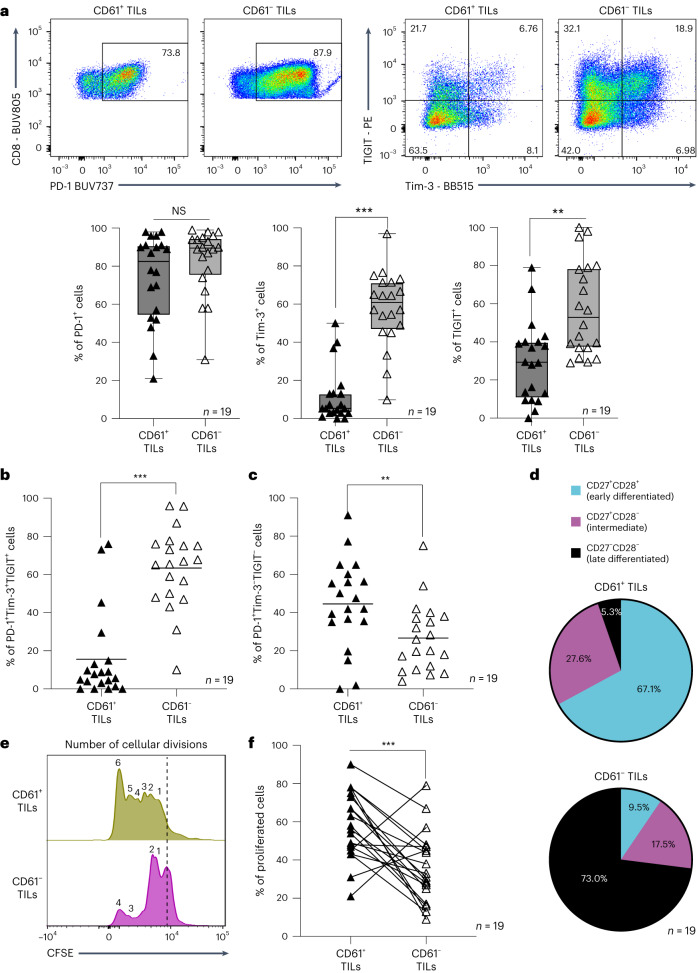
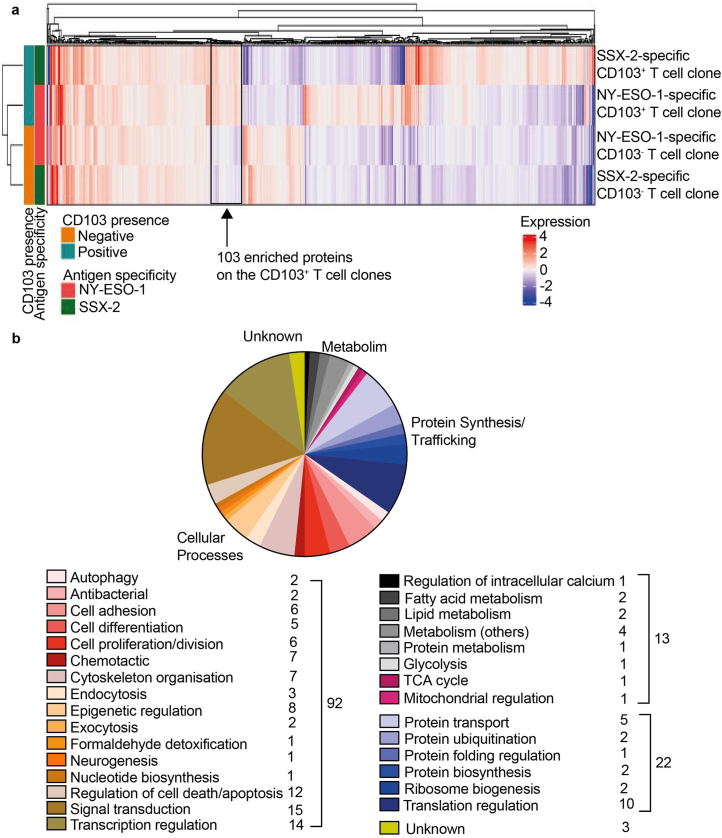
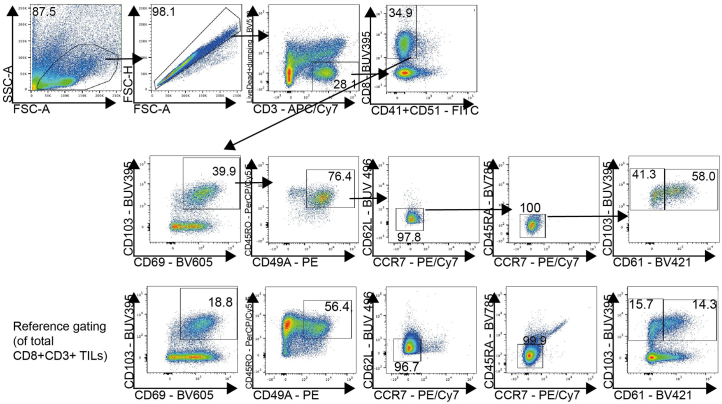
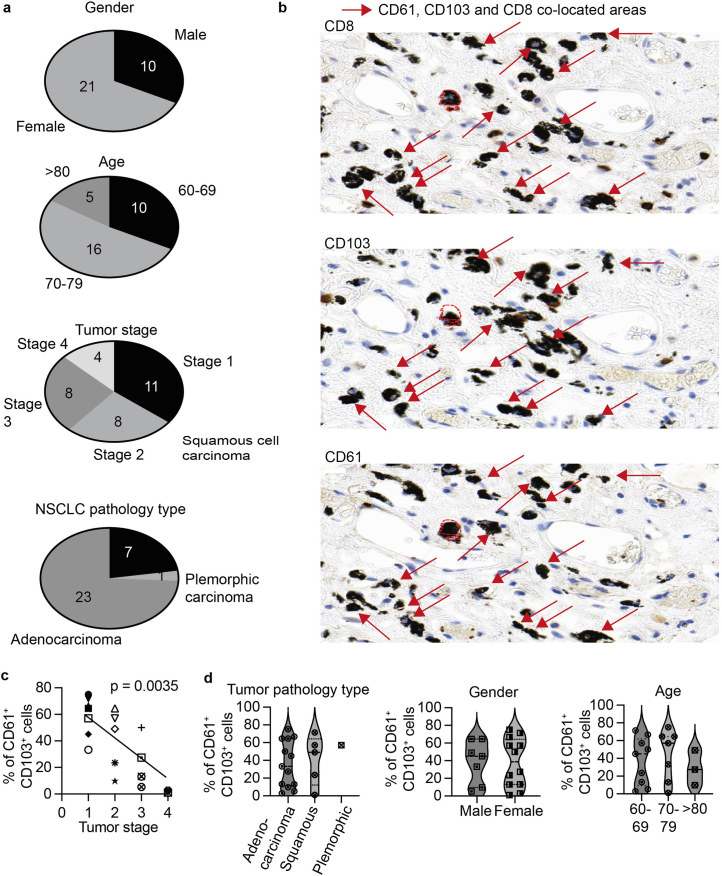
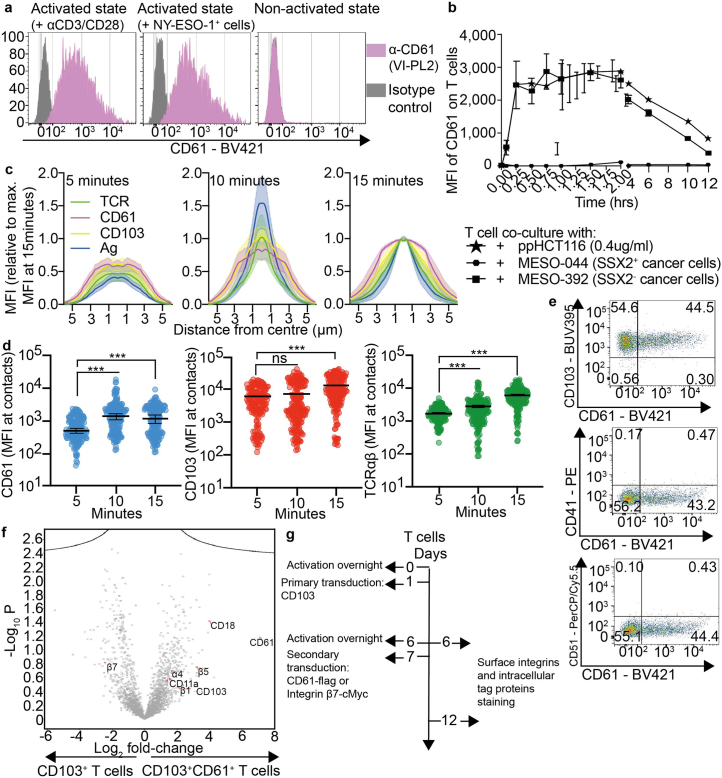
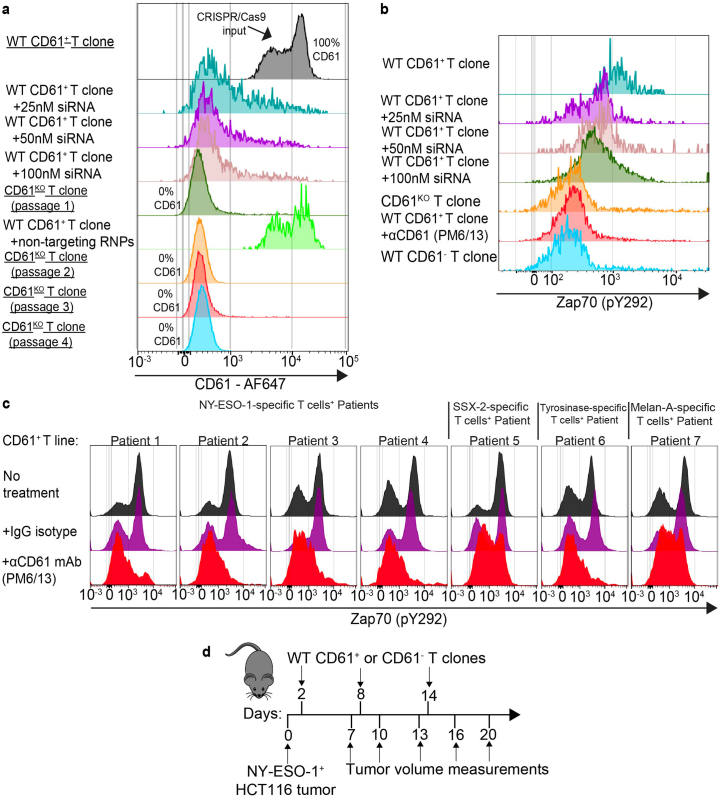
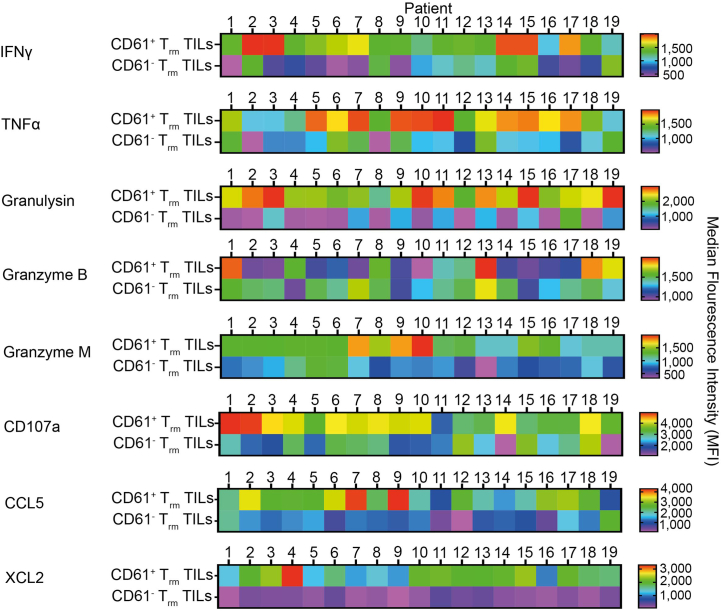
Cancer remains one of the leading causes of mortality worldwide, leading to increased interest in utilizing immunotherapy strategies for better cancer treatments. In the past decade, CD103+ T cells have been associated with better clinical prognosis in patients with cancer. However, the specific immune mechanisms contributing toward CD103-mediated protective immunity remain unclear. Here, we show an unexpected and transient CD61 expression, which is paired with CD103 at the synaptic microclusters of T cells. CD61 colocalization with the T cell antigen receptor further modulates downstream T cell antigen receptor signaling, improving antitumor cytotoxicity and promoting physiological control of tumor growth. Clinically, the presence of CD61+ tumor-infiltrating T lymphocytes is associated with improved clinical outcomes, mediated through enhanced effector functions and phenotype with limited evidence of cellular exhaustion. In conclusion, this study identified an unconventional and transient CD61 expression and pairing with CD103 on human immune cells, which potentiates a new target for immune-based cellular therapies.


Conflict of interest statement

The authors declare no competing interests.

Figures

Fig. 1
Fig. 1. CD61 is expressed on CD103+ CD8+ T cells.
a, Network plot showing clustering of enriched proteins in cancer-specific CD103+ T cell clones (n = 2 patients’ paired T cell clones). Highlighted circles indicative of proteins likely associated with immunity. b, Heat map showing selected proteins enriched in both CD103+ NY-ESO-1-specific and SSX-2-specific T cell clones but downregulated in both CD103 T cell clones. Cytotoxic T cell (CTL) CD103+ T cell clone is shown in teal and CD103 T cell clone is shown in orange. Antigen (Ag) specificity: NY-ESO-1-specific T cell clones (pink), SSX-2-specific T cell clones (green). Expression level by log2 fold-change (FC) values, with a gradient of red to blue. c, Graph showing the frequency of CD61+ cells (of total CD103+ TILs) by flow cytometry (right y axis), and the CD61+CD103+ co-located TILs by IHC (left y axis), of each patient with NSCLC. n1 IHC = 31 patients; n2 flow cytometry = 19 patients. Diamonds represent the area of CD61+CD103+ co-located TILs by IHC. d,e, Percentage of CD61+CD103+ and CD61CD103+ T cells of paired peripheral blood, paratumor tissue and tumor tissue by flow cytometry plots and a line plot. n = 19 patients. ***P < 0.001, one-way analysis of variance (ANOVA) with Tukey’s multiple-comparison test. P value (tumor versus paratumor): 0.0009, P value (tumor versus peripheral blood): 0.0003. f, Histograms showing CD61 expression on paired CD103+ and CD103 cancer-specific T cell lines (n = 7 patients). Gray represents CD103+ T cell lines, and light red represents CD103 T cell lines. n = 3 independent experiments with consistent results. Source data
Fig. 2
Fig. 2. CD61 transiently colocalizes with CD103.
a, Horizontal bar graph showing the average CD61 median fluorescence intensity (MFI) on CD103+ T cell lines following either activation by αCD3/CD28, or co-culture with antigenic cancer cells, or no activation by flow cytometry. ***P < 0.001, one-way ANOVA with Tukey’s multiple-comparison test. n = 7 patients, examined over three independent experiments. ***P values: (patient 1: 0.00098, patient 2: 0.00089, patient 3: 0.00001, patient 4: 0.000003, patient 5: 0.000, patient 6: 0.00002, patient 7: 0.00001). b, Representative synapse images of integrin β7, CD103, CD61 and merged, of a cancer-specific CD103+ TCR-T cell at 10 min after synaptic formation. Enlarged green box shows zoomed-in synaptic microcluster images of CD103 and CD61 colocalization, but not integrin β7. c,d, Representative dot plot showing CD103 and CD61 colocalization by PCC (P = 0.9435), or CD103 and integrin β7 negative PCC colocalization (P = 0.1973) at 5, 10 and 15 min after synaptic formation; each dot represents the average PCC per synapse. e, Representative synapse images showing internal reflection microscopy (IRM; denoting the area of synapse), integrin β7, CD49d and merged, of a cancer-specific CD103+ TCR-T cell at 5 min after synaptic formation. Enlarged green box shows zoomed-in images of colocalized integrin β7 and CD49d. f, Representative Co-IP immunoblot images of CD103 and CD61-flag on anti-flag IP pulldown lysate and whole-cell lysate, of CD103CD61-flag+, CD103+CD61-flag and CD103+CD61flag+ T cell lines. Molecular weight (MW) of CD103: ~150 kDa, of CD61-flag: ~100 kDa. n = 3 lines examined over three independent experiments, with consistent results. g, Volcano plot showing enriched proteins on lysates of CD103+CD61+ T cells in comparison to CD103+CD61 T cells. n = 2 lines examined over one experiment. Dot represents one protein. One-way ANOVA with Tukey’s multiple-comparison test, converted to −log10 P values for each data point. Raw fold-change values were normalized using log2. h, Representative flow cytometry plots of intracellular and surface staining of CD61-flag with CD103-HA following initial transduction of primary T cells with CD103 (left), followed by secondary transduction with CD61 (right). n = 3 independent experiments, with consistent results. a,c,d. Data are presented as the median ± s.e.m., c,d. Two-way ANOVA with Tukey’s multiple-comparison test. b,e. n = 150 cells examined over three independent experiments with consistent observations per c and d; each dot represents the average PCC per synapse. c, time of 5 min: 72 synapses, time of 10 min: 102 synapses, time of 15 min: 141 synapses. d, time of 5 min: 53 synapses, time of 10 min: 81 synapses, time of 15 min: 40 synapses. b,e, Microscopy images: big scale bar, 5 μm; small scale bar, 1 μm. Ag, antigen. NS, not significant. Source data
Fig. 3
Fig. 3. CD61 enhances TCR signaling.
a, Representative dot plot showing PCC of TCRαβ and CD61 colocalization (left) and TCRαβ and CD103 colocalization (right) at 5, 10 and 15 min after synaptic formation. P value (TCRαβ-CD61, 5 versus 15 min): 0.0009, P value (TCRαβ-CD103, 5 versus 10 min): 0.0075, P value (TCRαβ-CD103, 5 versus 15 min): 0.000782. Each dot represents the average PCC per synapse. n = 150 cells examined over three independent experiments; each dot represents the average PCC per synapse. Time of 5 min: 91 synapses; time of 10 min: 101 synapses; time of 15 min: 71 synapses. b,c, Average MFI of either Zap70 (pY292) or PLCγ1 (pY783) on (b) WT CD61+ T cell clone (from patient 1) following treatment with either 25, 50 or 100 nM CD61 siRNA, or no treatment (b), as well as on WT CD61+, CD61KO or WT CD61+T cell clones (from patient 1), by flow cytometry (c). d, Bar graph showing the average MFI of Zap70 (pY292) on CD61+ T cell lines, following treatment with αCD61 (neutralizing treatment), IgG isotype control treatment or no treatment, by flow cytometry. P values: (patient 1: 0.00076, patient 2: 0.0083, patient 3: 0.0096, patient 4: 0.00031, patient 5: 0.0087, patient 6: 0.037, patient 7: 0.036). e, Average MFI of Lck on WT CD61+, CD61KO or WT CD61+ T cell clones (from patient 1), including on WT CD61+ T cell clone treated with 25 nM, 50 nM or 100 nM CD61 siRNA, or no treatment, by flow cytometry. f, Bar graph showing the average MFI of Lck on CD61+ T cell lines, following treatment with αCD61 neutralizing treatment, IgG isotype control treatment or no treatment, by flow cytometry. P values: (patient 1: 0.047, patient 2: 0.0059, patient 3: 0.011, patient 4: 0.049, patient 5: 0.048, patient 6: 0.0053, patient 7: 0.038). g, Representative histogram of phosphorylated Zap70 (pY292) on WT CD61+ T cell clone (from patient 1) following activation with or without Lck inhibition when using A770041 (right), or with genistein as positive control of tyrosine kinases inhibition (left), h, Schematic of CD61 modulation of Zap70 phosphorylation via Lck activity under no inhibition (left), after CD61 knock-down (middle) and Lck inhibition (right). Created with BioRender.com. d,f, n = 7 patients examined, three independent experiments. b,c,e,g, n = 3 independent experiments. af, Data are presented as the median ± s.e.m., ***P < 0.001, **P < 0.01, *P < 0.05, one-way ANOVA with Tukey’s multiple-comparison test. Source data
Fig. 4
Fig. 4. CD61 improves cytotoxicity and tumor control.
a, Bar plot of CD107a MFI between NY-ESO-1-specific WT CD61+, CD61siRNA-treated, CD61KO and WT CD61 T cell clones (from patient 1) following activation with antigenic cancer cells, by flow cytometry. ♦, WT CD61+ T cell clone; •, WT CD61siRNA-treated T cell clone, ♠, WT CD61KO T cell clone; ♣, WT CD61T cell clone. b, Horizontal bar graph showing CD107a MFI on CD61+ T cell lines following αCD61 neutralizing antibody treatment, IgG isotype control treatment or no treatment (n = 7 patients), by flow cytometry. P values: (patient 1: 0.00078, patient 2: 0.00089, patient 3: 0.0099, patient 4: 0.0053, patient 5: 0.0057, patient 6: 0.033, patient 7: 0.021). c, Line plot showing the percentage of cancer cell death, following co-culture with NY-ESO-1-specific WT CD61+, CD61siRNA-treated, CD61KO or WT CD61 T cell clones (from patient 1). d, Horizontal bar graph showing the percentage of cancer cell death, following co-culture with CD61+ T cell lines after αCD61 neutralizing antibody treatment, IgG isotype control treatment or no treatment (n = 7 patients). P values: (patient 1: 0.0078, patient 2: 0.0043, patient 3: 0.0097, patient 4: 0.047, patient 5: 0.049, patient 6: 0.04, patient 7: 0.007). e, Kinetic analysis of mouse tumor volume after adoptive transfer of either WT CD61+ or WT CD61 T cell clones (patient 1). The arrows show the timepoints of T cell injections. f,g, Dot plots of mouse tumor volume after the 2nd (day 10, P value: 0.048) or 3rd (day 16, P value: 0.0089) T cell injection of either WT CD61+ (black box) or WT CD61 (white box) T cell clones (from patient 1). h, Kaplan–Meier survival curves of patients with SCM and patients with stage 1 LC using TCGA dataset. Patient groups: (i) patients with CD61+CD103+CD8+CD3+ samples (G1, light red), or (ii) patients with CD61CD103+CD8+CD3+ samples (G2, light blue). The starting number of patients with SCM analyzed: nG1 = 16 patients, nG2 = 122 patients. The starting number of patients with LC analyzed: nG1 = 85 patients, nG2 = 22 patients. One-way ANOVA, with Tukey’s multiple-comparison test. a,c. n = 3 independent experiments. b,d. n = 7 patients examined over three independent experiments. eg, n+WT CD61+ T cells = 8 mice, n+WT CD61 T cells = 10 mice. ag, Data are presented as the median ± s.e.m., denoted as ***P < 0.001, **P < 0.01, *P < 0.05, with either one-way ANOVA with Tukey’s multiple-comparison tests (ae) or two-tailed t-test with Wilcoxon adjustment (f and g). Source data
Fig. 5
Fig. 5. CD61+ TILs have enhanced antitumor effector phenotypes in NSCLC.
a, Expression of cytolytic molecules (granulysin, granzyme M, granzyme B), degranulation marker CD107a, chemokines (CCL5, XCL2) and cytokines (TNF, IFN-γ) between CD61+ and CD61 TILs, by representative flow cytometry plots of 1 patient (patient 7). b, Dot plots of the average MFI and frequency of cytolytic molecules, cytokines and chemokines, by flow cytometry. c, Dot plot showing the percentage of CD61+ TILs expressing granulysin and granzyme M following ex vivo αCD61 neutralizing antibody treatment or no treatment ex vivo. P value granulysin: 0.00021, P value granzyme M: 0.045. d, Line plot on the frequency of combinatorial effector signatures positive (IFN-γ+TNF+CCL5+XCL2+granzyme M+granzyme B+granulysin+) cells between CD61+ and CD61 TILs. P value: 0.00087. e, The frequency of CD61+CD103+CD8+ co-located cells or CD61CD103+CD8+ co-located cells present within the tumor body, clustering around the tumor body, or further from the tumor body, by IHC. Data are presented as the median ± s.e.m. P value (within tumor islets): 0.0009, P value (further from islets): 0.00078. f, Line plot on the frequency of cells with tumor-reactive combinatorial markers expression (CD39+CD103+) between CD61+ and CD61 TILs. P value: 0.00074. cf, ***P < 0.001, *P < 0.05; one-way ANOVA with Tukey’s multiple-comparison test (c and e) or two-tailed t-test with Wilcoxon adjustment (d and f). bf, n = 19 patients. mAb, monoclonal antibody. Source data
Fig. 6
Fig. 6. CD61+ TILs do not exhibit hallmarks of exhaustion.
a, The expression of PD-1, TIGIT and Tim-3 by representative flow cytometry plot of patient 6 (top) and the frequency of PD-1+, Tim-3+ and TIGIT+ cells by box-and-whisker plots (bottom) between CD61+ TILs and CD61 TILs. Data are presented as the median ± s.e.m., with center percentile. P values (Tim-3: 0.00045, TIGIT: 0.0034). b,c, Dot plots on the frequency of triple coexpressed PD-1+Tim-3+TIGIT+ cells and PD-1+Tim-3-TIGITcells between CD61+ TILs and CD61 TILs. b, P value: 0.00083. c, P value: 0.0089. d, Pie charts showing percentages of cells in the early-differentiated stage (CD27+CD28+), intermediate differentiated stage (CD27+CD28) and late differentiated stage (CD27CD28) between CD61+ TILs and CD61 TILs. e, Representative histogram plot (from patient 7) of cells undergoing cellular divisions (denoted by the number of CFSE peaks) between CD61+ TILs and CD61 TILs. Peaks at the dashed line represent cells that are not proliferating. f, Line plot of proliferated cells between CD61+ TILs and CD61 TILs. P value: 0.00097. ***P < 0.001, **P < 0.01, two-tailed t-test with Wilcoxon adjustment (ac and f). ad and f, n = 19 patients. Source data
Extended Data Fig. 1
Extended Data Fig. 1. Enriched proteins of cancer-specific CD103+ CD8+ T cells.
a, Heatmap of 890 proteins by log2 fold-change values, on CD103+ and CD103 cancer-specific T cell clones from 2 different cancer patients. Arrow denotes the 103 proteins enriched on the CD103+ T cell clones. n = 2 patients’ paired T cell clones. b, Pie chart on proteins classification by Gene Ontology NCBI annotation, on four major groups of cellular processes, metabolism, protein synthesis and trafficking and unknown. Proteins were also subdivided into specific biological roles. Numbers on the side of each legend represent the number of proteins annotated to that subgroup. The number represents the number of proteins annotated to the major group.
Extended Data Fig. 2
Extended Data Fig. 2. Gating strategy to identify CD61+ TILs ex vivo.
Gating strategy illustrating identification of CD61+CD103+ and CD61CD103+ TILs based on initial gating of: lymphocytes (FSC-A vs SSC-A), single cells (FSC-H vs FSC-A), Live CD3+ cells (Live/Dead + dumping (CD56, CD11c) vs CD3), CD41 and CD51 negative CD8+ T cells (CD8 vs CD41 and CD51), Trm cells (CD103 vs CD69, CD45RO vs CD49a, CD62L vs CCR7, CD45RA vs CCR7). Gatings were performed based on the reference cell population of total CD8+CD3+ TILs. Subsequent analysis was then performed to analyse selected immunophenotype.
Extended Data Fig. 3
Extended Data Fig. 3. Summary of clinical parameters and CD61 expression on TILs ex vivo.
a, Pie charts on the summary clinical parameters of NSCLC patients, according to gender, age, tumour stage and NSCLC pathology type, used in this study. b, Representative IHC images of CD8, CD103 and CD61 on three serial tumour resections, from one NSCLC patient. The red arrow represents areas of co-localisation between CD8, CD103 and CD61. Red dotted lines indicate the alignment of the serial tumour resections performed by Visiopharm. Scale white bar: 5μm. Representative image from Patient 7. Similar APP algorithm applied to all 19 patients IHC analysis, with consistent observations. c, Plot showing frequency of CD61+ cells (out of the total CD103+ TILs) and the tumour stage of each patient. Each variety of dots represents an individual cancer patient. p-value = 0.0035. Correlation analyses were performed using non-parametric Spearman rank correlation. d, Violin plots showing the frequency of CD61+ cells (out of total CD103+ TILs), according to tumour pathology type, gender and age. a,c-d. n = 19 patients. Source data
Extended Data Fig. 4
Extended Data Fig. 4. CD61 co-localises with CD103.
a, Representative histogram showing CD61 expression on CD103+ cancer-specific T cell clone (from patient 1), following activation either by αCD3/CD28 or by NY-ESO-1+ cancer cells activation, or no activation. Grey represents isotype control, pink represents CD61 staining. b, Representative kinetic plot of CD61 expression by median fluorescence intensity (MFI) on cancer-specific CD103+ T cell clone (from patient 1), following activation for either 0, 15 minutes, 30 minutes, 45 minutes, 1 hour, 1.25 hours, 1.5 hours, 1.75 hours, 2 hours and 6-, 8-, 10- and 12-hours. n = 3 independent experiments. c, Histograms showing the radially averaged MFI of antigen (denoted by HLA-A2NY-ESO-1, in blue), CD103 (yellow), CD61 (magenta) and TCR (green) plotted as relative to maximum MFI at 15 minutes, according to distance from the synapse centre at 5, 10, 15 minutes post synaptic formation. n = 3 independent experiments. d, Dot-plots showing MFI of CD61, CD103 and TCRαβ at the point of synapse contacts, at 5-, 10-, and 15-minutes post synaptic formation. Each dot represents one synaptic contact per cell. n = 150 cells examined over 3 independent experiments. *** p < 0.001, ns = not significant, one-way ANOVA with Tukey’s multiple-comparison test. e, Flow cytometry plots showing CD61 expression against CD41, CD51 or CD103 on CD103+ cancer-specific T cell clone (from patient 5). f, Volcano plot showing enrichment of CD61 and CD103 but downregulation of integrin β7 on the primary CD103+CD61+ T cell line lysate compared to primary CD103+ T cell line lysate, n = 3 independent experiments. Statistical test used involve one-way ANOVA, with Tukey multiple comparison test, converted to -log10 p values for each datapoint. Raw fold-change values was normalised using log2. g, Schematic showing integrins cell surface rescue workflow. Primary T cells were activated overnight (Day 0) before primary transduction with CD103. Cells were stained for CD103-HA and CD61flag or integrin β7-cMyc surface and intracellular expression on Day 6. Cells were re-activated overnight before secondary transduction with CD61flag or integrin β7-cMyc. Staining was repeated on Day 12. n = 3 independent experiments. b-d. Error bar and highlight presented as median± SEM.
Extended Data Fig. 5
Extended Data Fig. 5. Manipulation of CD61 affects T cell functions.
a, Overlaid flow cytometry histograms showing downregulation of CD61 expression following serial CD61 siRNA treatment (+25 nM, or 50 nM, or 100 nM treatment) on WT CD61+ T cell (of patient 1). The fifth histogram shows the abrogation of CD61 expression on CD61KO T cell (dark red) following CRISPR-Cas9 editing of the CD61 gene on WT CD61+ T cell clone (grey). Note the CD61KO T cell derived from a starting population of 100% CD61 positive cells. The sixth histogram shows WT CD61+ T cell transfected with non-targeting RNPs as control, showing no changes in the CD61 expression. CRISPR-Cas9-mediated CD61KO T cell demonstrated consistent CD61 abrogation across 4 passages of T cell expansion. b, Overlaid flow cytometry histograms showing phosphorylation level of Zap70 (pY292) on WT CD61+ T cell clone, WT CD61+ T clone treated with 25 nM, 50 nM or 100 nM siRNA, CD61KO T cell clone, WT CD61+ T cell clone treated with anti-CD61 blocking antibody (PM6/13) and WT CD61 T cell clone (of patient 1). c, Histogram plots showing Zap70 (pY292) phosphorylation level on CD61+ T cell lines, from 7 different cancer patients following either αCD61 neutralising antibody treatment, IgG isotype control treatment, or no treatment (four patients with NY-ESO-1-specific, and one patient each with SSX-2-specific, Tyrosinase-specific and Melan-A-specific). d. Schematic diagram of in vitro tumour growth assay, with NOD.SCID mice xenografted with NY-ESO-1+ HCT116 tumour at day 0 before adoptive transferred with WT CD61+ or CD61- T clones (derived from patient 1) at day 2, day 8 and day 14. Tumor volume measurements were taken at intervals, at Day 7, 10, 13, 16 and 20 post xenografts.
Extended Data Fig. 6
Extended Data Fig. 6. Effector immunophenotypes of NSCLC patients.
A set of heatmaps illustrating the MFI of IFNγ, TNFγ, granulysin, granzyme B, granzyme M, CD107a, CCL5 and XCL2, on CD61+CD103+ and CD61-CD103+ TILs, of each patient. n = 19 patients. Values represent MFI, with a colour gradient from red to blue. n = 19 patients. Source data
Extended Data Fig. 7
Extended Data Fig. 7. Width lining of ‘clustering’ areas of E-Cadherinover-expressed tumors.
Brown areas showing positive E-Cadherinover-expressing cells, with blue staining denoting nuclear staining. Blue dashed lining denoting area margin of 1.5 cm from the E-Cadherinover-expressing cells, determined using Visiopharm IHC APP algorithm (further detailed in Methods section). Scale white bar: 10 μm. Representative image from Patient 7. Similar APP algorithm applied to all 19 patients IHC analysis, with consistent observations.

References

    1. Hynes RO, Ruoslahti E, Springer TA. Reflections on integrins-past, present, and future: The Albert Lasker Basic Medical Research Award. JAMA. 2022;328:1291–1292. doi: 10.1001/jama.2022.17005. - DOI - PubMed
    1. Niiya K, et al. Increased surface expression of the membrane glycoprotein IIb/IIIa complex induced by platelet activation. Relationship to the binding of fibrinogen and platelet aggregation. Blood. 1987;70:475–483. doi: 10.1182/blood.V70.2.475.475. - DOI - PubMed
    1. Cepek KL, et al. Adhesion between epithelial cells and T lymphocytes mediated by E-cadherin and the alpha E beta 7 integrin. Nature. 1994;372:190–193. doi: 10.1038/372190a0. - DOI - PubMed
    1. Hynes RO. Integrins: bidirectional, allosteric signaling machines. Cell. 2002;110:673–687. doi: 10.1016/S0092-8674(02)00971-6. - DOI - PubMed
    1. Mackay LK, et al. The developmental pathway for CD103+CD8+ tissue-resident memory T cells of skin. Nat. Immunol. 2013;14:1294–1301. doi: 10.1038/ni.2744. - DOI - PubMed

Publication types