

Integrated transcriptomic and WGCNA analyses reveal candidate genes regulating mainly flavonoid biosynthesis in Litsea coreana var. sinensis
- PMID: 38561656
- PMCID: PMC10985888
- DOI: 10.1186/s12870-024-04949-1
Integrated transcriptomic and WGCNA analyses reveal candidate genes regulating mainly flavonoid biosynthesis in Litsea coreana var. sinensis
Erratum in
-
Correction: Integrated transcriptomic and WGCNA analyses reveal candidate genes regulating mainly flavonoid biosynthesis in Litsea coreana var. Sinensis.BMC Plant Biol. 2024 Apr 25;24(1):328. doi: 10.1186/s12870-024-05013-8. BMC Plant Biol. 2024. PMID: 38664607 Free PMC article. No abstract available.
Abstract
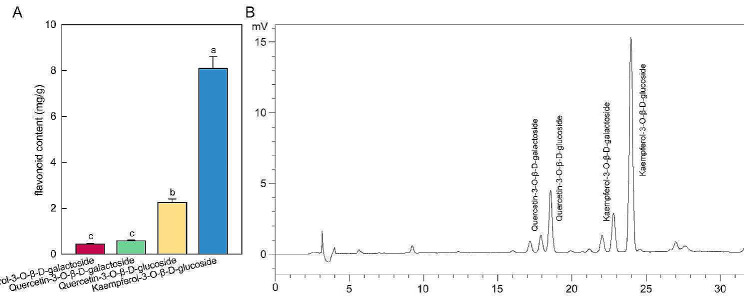
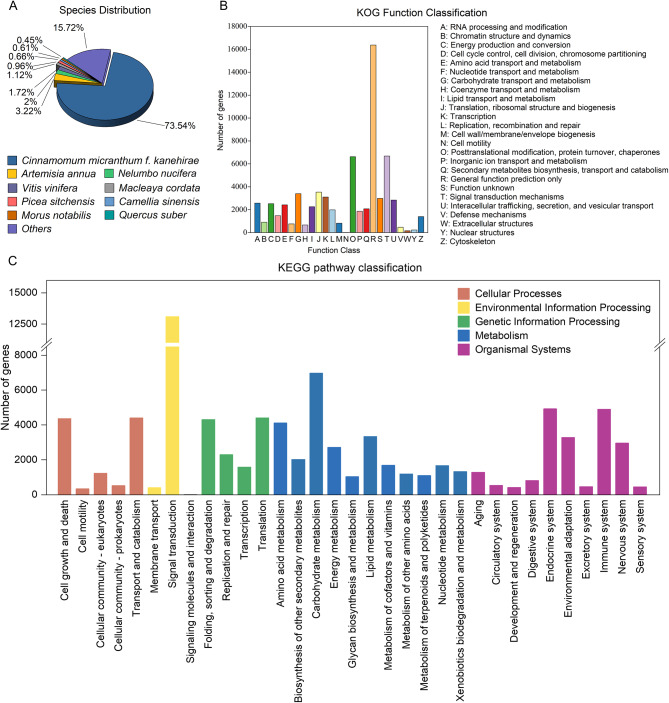
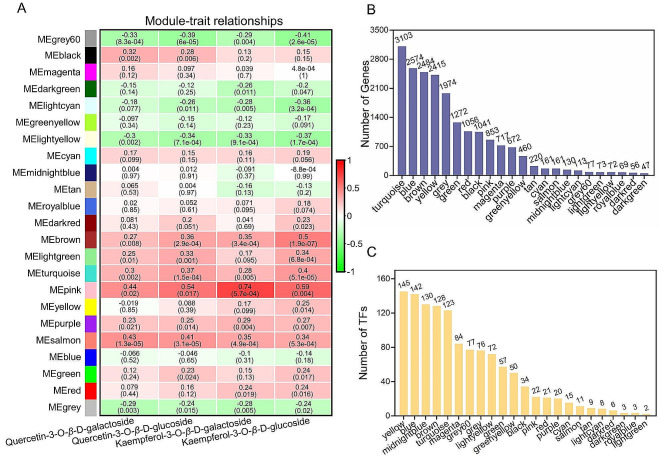
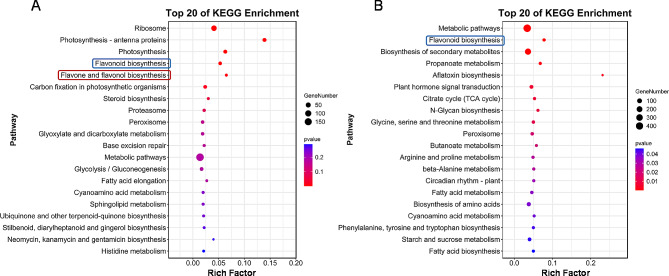
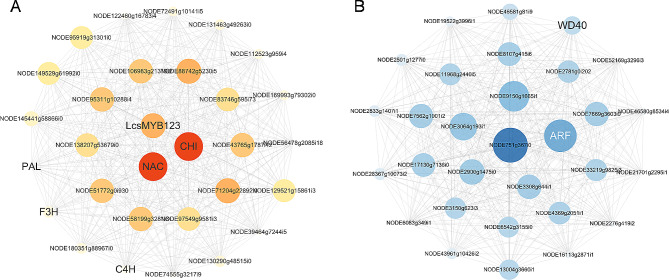
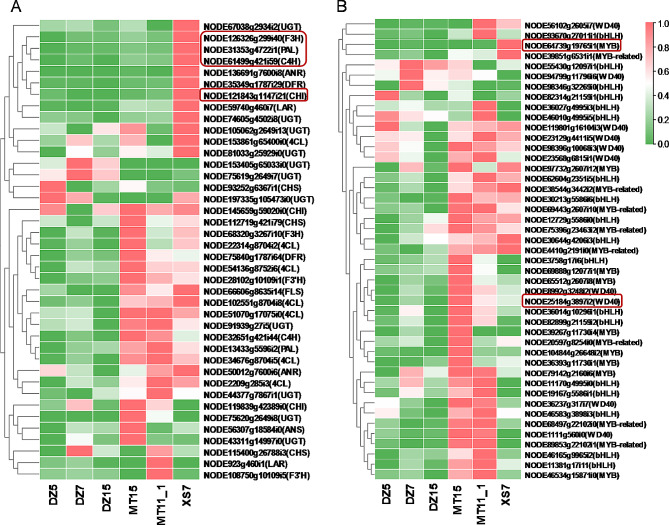
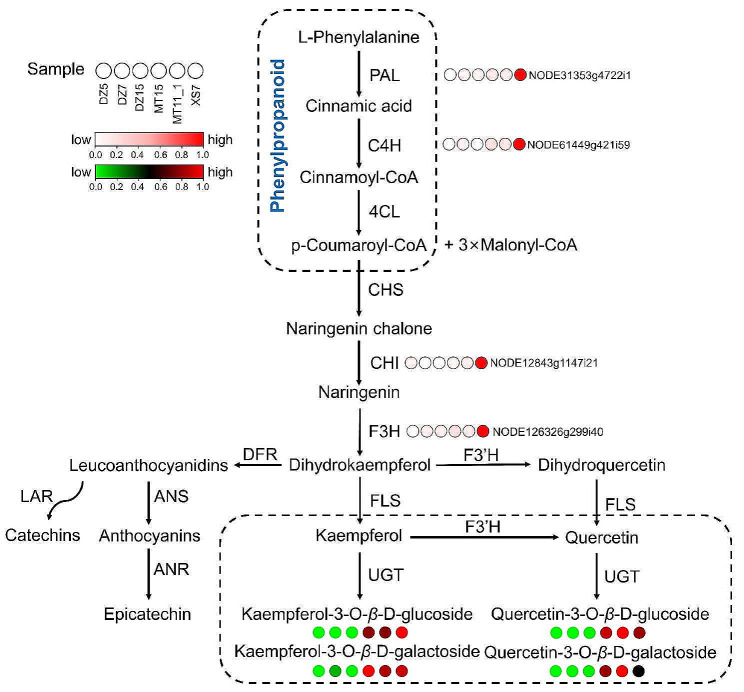
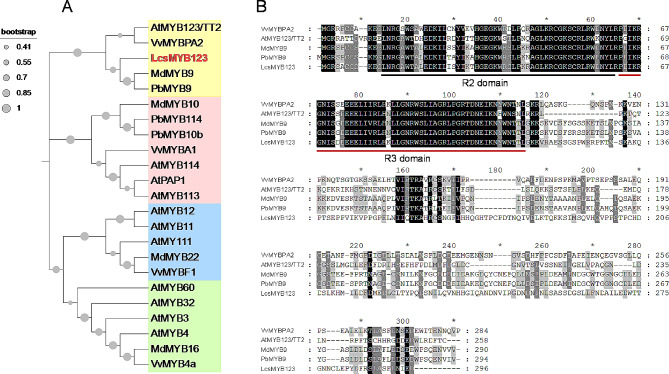
Litsea coreana Levl. var. sinensis (Allen) Yang et P. H. Huang is a popular ethnic herb and beverage plant known for its high flavonoid content, which has been linked to a variety of pharmacological benefits and crucial health-promoting impacts in humans. The progress in understanding the molecular mechanisms of flavonoid accumulation in this plant has been hindered due to the deficiency of genomic and transcriptomic resources. We utilized a combination of Illumina and Oxford Nanopore Technology (ONT) sequencing to generate a de novo hybrid transcriptome assembly. In total, 126,977 unigenes were characterized, out of which 107,977 were successfully annotated in seven public databases. Within the annotated unigenes, 3,781 were categorized into 58 transcription factor families. Furthermore, we investigated the presence of four valuable flavonoids-quercetin-3-O-β-D-galactoside, quercetin-3-O-β-D-glucoside, kaempferol-3-O-β-D-galactoside, and kaempferol-3-O-β-D-glucoside in 98 samples, using high-performance liquid chromatography. A weighted gene co-expression network analysis identified two co-expression modules, MEpink and MEturquoise, that showed strong positive correlation with flavonoid content. Within these modules, four transcription factor genes (R2R3-MYB, NAC, WD40, and ARF) and four key enzyme-encoding genes (CHI, F3H, PAL, and C4H) emerged as potential hub genes. Among them, the R2R3-MYB (LcsMYB123) as a homologous gene to AtMYB123/TT2, was speculated to play a significant role in flavonol biosynthesis based on phylogenetic analysis. Our findings provided a theoretical foundation for further research into the molecular mechanisms of flavonoid biosynthesis. Additionally, The hybrid transcriptome sequences will serve as a valuable molecular resource for the transcriptional annotation of L. coreana var. sinensis, which will contribute to the improvement of high-flavonoid materials.
Keywords: De novo transcriptome sequencing; Litsea coreana var. sinensis; Candidate genes; Flavonoids; WGCNA.
© 2024. The Author(s).
Conflict of interest statement
The authors declare no competing interests.
Figures
Similar articles
-
Transcriptome-Wide Association Analysis of Flavonoid Biosynthesis Genes and Their Correlation With Leaf Phenotypes in Hawk Tea (Litsea coreana var. sinensis).Ecol Evol. 2024 Nov 17;14(11):e70563. doi: 10.1002/ece3.70563. eCollection 2024 Nov. Ecol Evol. 2024. PMID: 39554885 Free PMC article.
-
Full-length transcriptome sequencing provides insights into flavonoid biosynthesis in Camellia nitidissima Petals.Gene. 2023 Jan 20;850:146924. doi: 10.1016/j.gene.2022.146924. Epub 2022 Oct 1. Gene. 2023. PMID: 36191826
-
Comparative transcriptome among Euscaphis konishii Hayata tissues and analysis of genes involved in flavonoid biosynthesis and accumulation.BMC Genomics. 2019 Jan 9;20(1):24. doi: 10.1186/s12864-018-5354-x. BMC Genomics. 2019. PMID: 30626333 Free PMC article.
-
High-quality chromosome-level genome assembly of Litsea coreana L. provides insights into Magnoliids evolution and flavonoid biosynthesis.Genomics. 2022 Jul;114(4):110394. doi: 10.1016/j.ygeno.2022.110394. Epub 2022 Jun 2. Genomics. 2022. PMID: 35659563 Review.
-
Comparative physiological, biochemical, metabolomic, and transcriptomic analyses reveal the formation mechanism of heartwood for Acacia melanoxylon.BMC Plant Biol. 2024 Apr 22;24(1):308. doi: 10.1186/s12870-024-04884-1. BMC Plant Biol. 2024. PMID: 38644502 Free PMC article. Review.
Cited by
-
Comparative transcriptome analysis and heterologous overexpression indicate that the ZjZOG gene may positively regulate the size of jujube fruit.BMC Plant Biol. 2024 Dec 28;24(1):1267. doi: 10.1186/s12870-024-05997-3. BMC Plant Biol. 2024. PMID: 39731028 Free PMC article.
-
Correction: Integrated transcriptomic and WGCNA analyses reveal candidate genes regulating mainly flavonoid biosynthesis in Litsea coreana var. Sinensis.BMC Plant Biol. 2024 Apr 25;24(1):328. doi: 10.1186/s12870-024-05013-8. BMC Plant Biol. 2024. PMID: 38664607 Free PMC article. No abstract available.
-
Comprehensive analysis of the NAC transcription factor gene family in Sophora tonkinensis Gagnep.BMC Plant Biol. 2025 Apr 25;25(1):530. doi: 10.1186/s12870-025-06564-0. BMC Plant Biol. 2025. PMID: 40281421 Free PMC article.
-
Mapping of dynamic quantitative trait loci for plant height in a RIL population of foxtail millet (Setaria italica L.).Front Plant Sci. 2024 Jul 24;15:1418328. doi: 10.3389/fpls.2024.1418328. eCollection 2024. Front Plant Sci. 2024. PMID: 39114469 Free PMC article.
-
Phylogenetic and functional analysis of MYB genes unraveling its role involved in anthocyanin biosynthesis in H macrophylla.Sci Rep. 2025 Aug 9;15(1):29125. doi: 10.1038/s41598-025-14216-4. Sci Rep. 2025. PMID: 40781127 Free PMC article.
References
-
- Yuan GY, Guo QQ, Xie N, Zhang YQ, Luo SQ, Gui Q, et al. Population dynamics and protection strategies of Litsea coreana levl. var. sinensis with Guizhou Province in China as an example. J Mt Sci. 2023;20:1090–101.
-
- Ji HF, Zhang LW, Du AL, Yang MD, Wang Q. Effects of ultrahigh pressure extraction conditions on yields and antioxidant activities of flavonoid from laoying tea. Int J Food Eng. 2011;7.
-
- Fang ZT, Song CJ, Xu HR, Ye JH. Dynamic changes in flavonol glycosides during production of green, yellow, white, oolong and black teas from Camellia sinensis L. (Cv. Fudingdabaicha). Int J Food Sci Technol. 2019;54:490–8.
MeSH terms
Substances
Grants and funding
LinkOut - more resources
Full Text Sources
