

Overcoming denominator problems in refugee settings with fragmented electronic records for health and immigration data: a prediction-based approach
- PMID: 38561661
- PMCID: PMC10983725
- DOI: 10.1186/s12874-024-02204-7
Overcoming denominator problems in refugee settings with fragmented electronic records for health and immigration data: a prediction-based approach
Abstract
Background: Epidemiological studies in refugee settings are often challenged by the denominator problem, i.e. lack of population at risk data. We develop an empirical approach to address this problem by assessing relationships between occupancy data in refugee centres, number of refugee patients in walk-in clinics, and diseases of the digestive system.
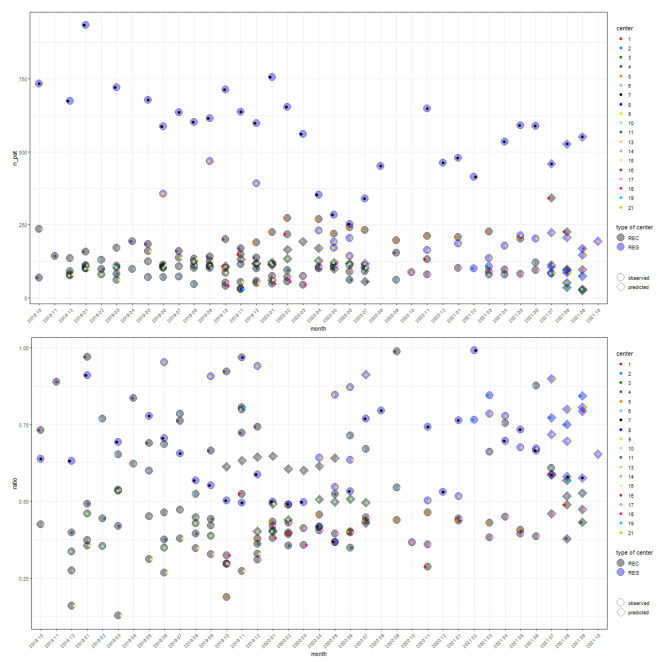
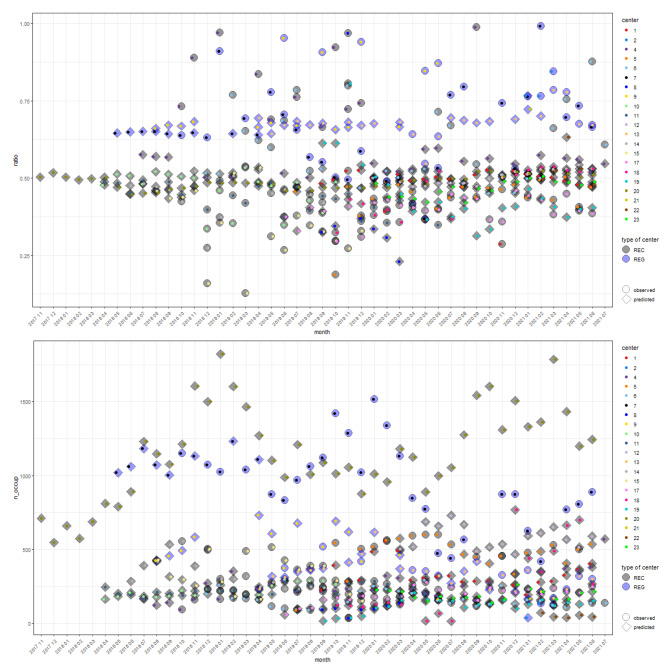
Methods: Individual-level patient data from a primary care surveillance system (PriCarenet) was matched with occupancy data retrieved from immigration authorities. The three relationships were analysed using regression models, considering age, sex, and type of centre. Then predictions for the respective data category not available in each of the relationships were made. Twenty-one German on-site health care facilities in state-level registration and reception centres participated in the study, covering the time period from November 2017 to July 2021.
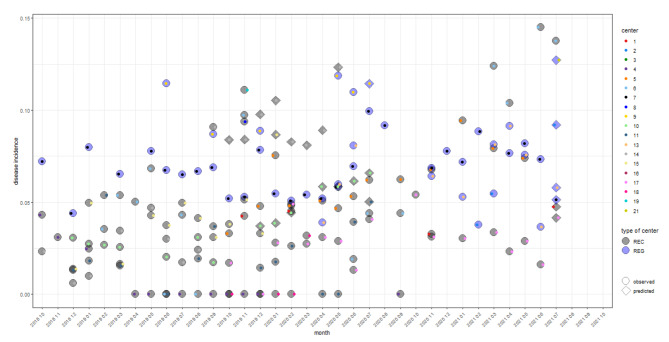
Results: 445 observations ("centre-months") for patient data from electronic health records (EHR, 230 mean walk-in clinics visiting refugee patients per month and centre; standard deviation sd: 202) of a total of 47.617 refugee patients were available, 215 for occupancy data (OCC, mean occupancy of 348 residents, sd: 287), 147 for both (matched), leaving 270 observations without occupancy (EHR-unmatched) and 40 without patient data (OCC-unmatched). The incidence of diseases of the digestive system, using patients as denominators in the different sub-data sets were 9.2% (sd: 5.9) in EHR, 8.8% (sd: 5.1) when matched, 9.6% (sd: 6.4) in EHR- and 12% (sd 2.9) in OCC-unmatched. Using the available or predicted occupancy as denominator yielded average incidence estimates (per centre and month) of 4.7% (sd: 3.2) in matched data, 4.8% (sd: 3.3) in EHR- and 7.4% (sd: 2.7) in OCC-unmatched.
Conclusions: By modelling the ratio between patient and occupancy numbers in refugee centres depending on sex and age, as well as on the total number of patients or occupancy, the denominator problem in health monitoring systems could be mitigated. The approach helped to estimate the missing component of the denominator, and to compare disease frequency across time and refugee centres more accurately using an empirically grounded prediction of disease frequency based on demographic and centre typology. This avoided over-estimation of disease frequency as opposed to the use of patients as denominators.
Keywords: Asylum seekers; Disease prevalence; Generalized linear models; Patient-registries; Prediction; Refugees.
© 2024. The Author(s).
Conflict of interest statement
The authors declare no competing interests.
Figures
Similar articles
-
Systematic review of electronic health records to manage chronic conditions among displaced populations.BMJ Open. 2022 Sep 6;12(9):e056987. doi: 10.1136/bmjopen-2021-056987. BMJ Open. 2022. PMID: 36285578 Free PMC article.
-
Effects of introducing a walk-in clinic on ambulatory care sensitive hospitalisations among asylum seekers in Germany: a single-centre pre-post intervention study using medical records.BMJ Open. 2019 Dec 4;9(12):e027945. doi: 10.1136/bmjopen-2018-027945. BMJ Open. 2019. PMID: 31806604 Free PMC article.
-
Exploring electronic health records to estimate the extent of catch-up immunisation and factors associated with under-immunisation among refugees and asylum seekers in south east Queensland.Vaccine. 2021 Oct 8;39(42):6238-6244. doi: 10.1016/j.vaccine.2021.09.026. Epub 2021 Sep 21. Vaccine. 2021. PMID: 34556368
-
[Health and primary care surveillance among asylum seekers in reception centres in Germany: concept, development, and implementation].Bundesgesundheitsblatt Gesundheitsforschung Gesundheitsschutz. 2019 Jul;62(7):881-892. doi: 10.1007/s00103-019-02971-5. Bundesgesundheitsblatt Gesundheitsforschung Gesundheitsschutz. 2019. PMID: 31201445 Review. German.
-
Disease burden in a large cohort of asylum seekers and refugees in Germany.J Glob Health. 2021 Jan 30;11:04002. doi: 10.7189/jogh.11.04002. J Glob Health. 2021. PMID: 33643633 Free PMC article.
References
-
- Brenner H. 4 The Denominator Problem-A Literature Review. Comparison and Harmonisation of Denominator Data for Primary Health Care Research in Countries of the European Community: The European Denominator Project. 351999. p. 13.
-
- Schlaud M, Brenner MH, Hoopmann M, Schwartz F. Approaches to the denominator in practice-based epidemiology: a critical overview. J Epidemiol Commun Health (1979-). 1998:S13–9. - PubMed
-
- Cherkin DC, Berg AO, Phillips WR. In search of a solution to the primary care denominator problem. J Fam Pract. 1982;14(2):301–9. - PubMed
MeSH terms
LinkOut - more resources
Full Text Sources
