. 2024 Apr 1;22(1):200.
doi: 10.1186/s12964-024-01569-y.

Integrating transcriptomics, glycomics and glycoproteomics to characterize hepatitis B virus-associated hepatocellular carcinoma

Affiliations

Integrating transcriptomics, glycomics and glycoproteomics to characterize hepatitis B virus-associated hepatocellular carcinoma

Zhuo Li et al. Cell Commun Signal. .

Abstract

Background: Hepatocellular carcinoma (HCC) ranks as the third most common cause of cancer related death globally, representing a substantial challenge to global healthcare systems. In China, the primary risk factor for HCC is the hepatitis B virus (HBV). Aberrant serum glycoconjugate levels have long been linked to the progression of HBV-associated HCC (HBV-HCC). Nevertheless, few study systematically explored the dysregulation of glycoconjugates in the progression of HBV-associated HCC and their potency as the diagnostic and prognostic biomarker.

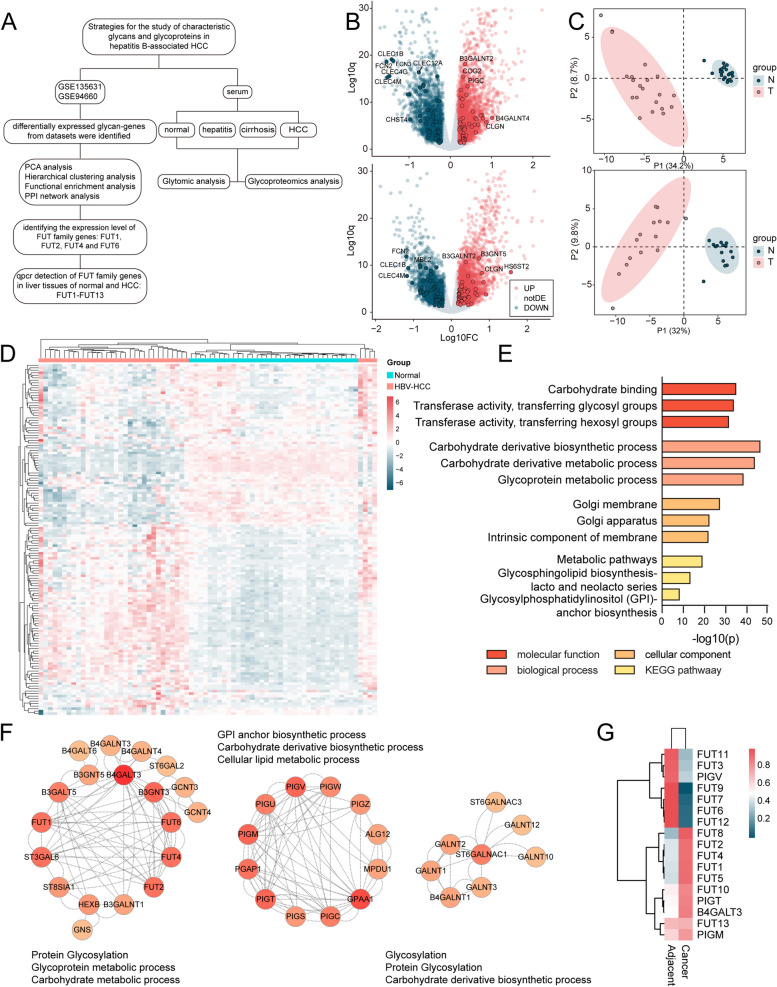
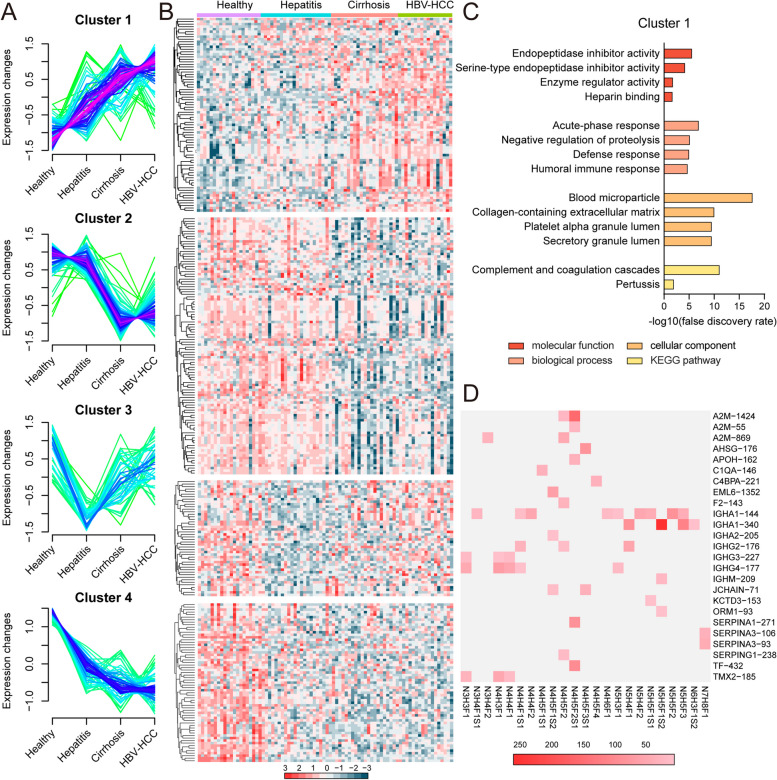
Methods: An integrated strategy that combined transcriptomics, glycomics, and glycoproteomics was employed to comprehensively investigate the dynamic alterations in glyco-genes, N-glycans, and glycoproteins in the progression of HBV- HCC.

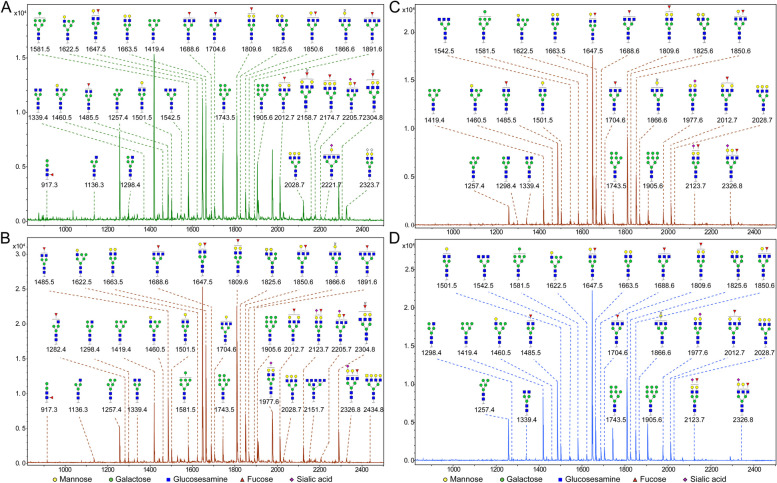
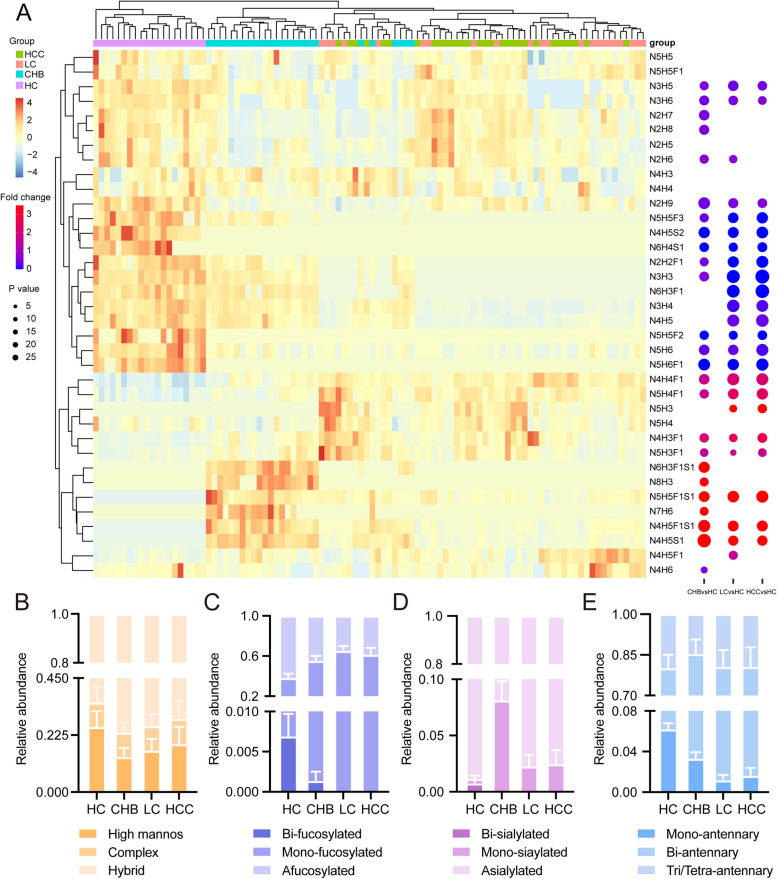
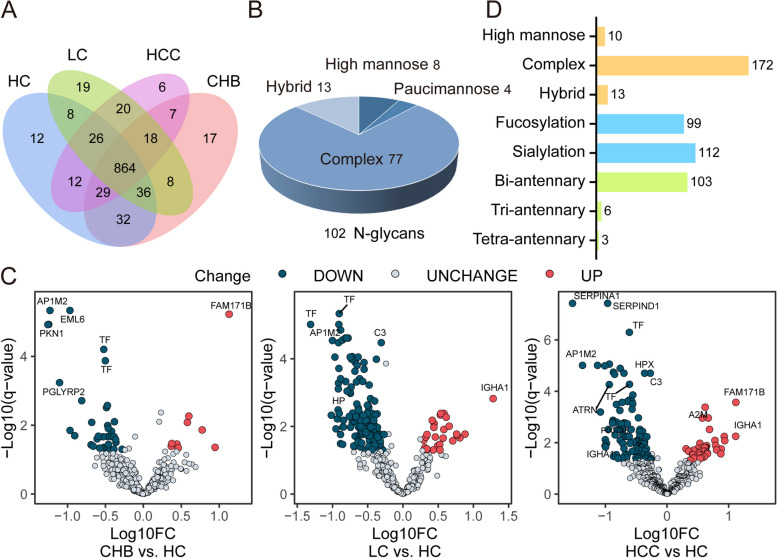
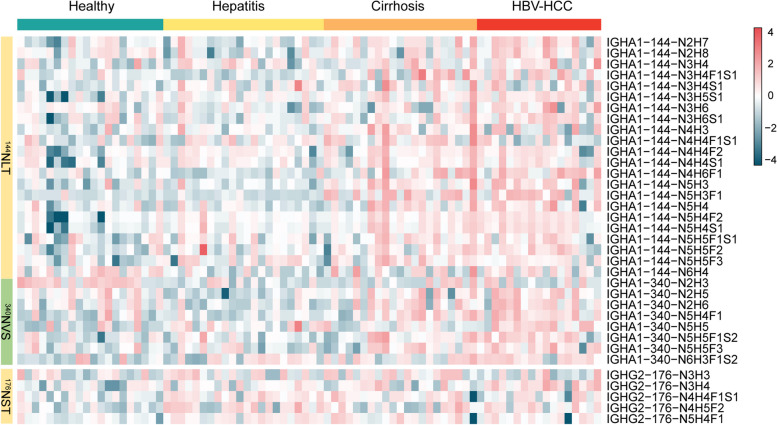
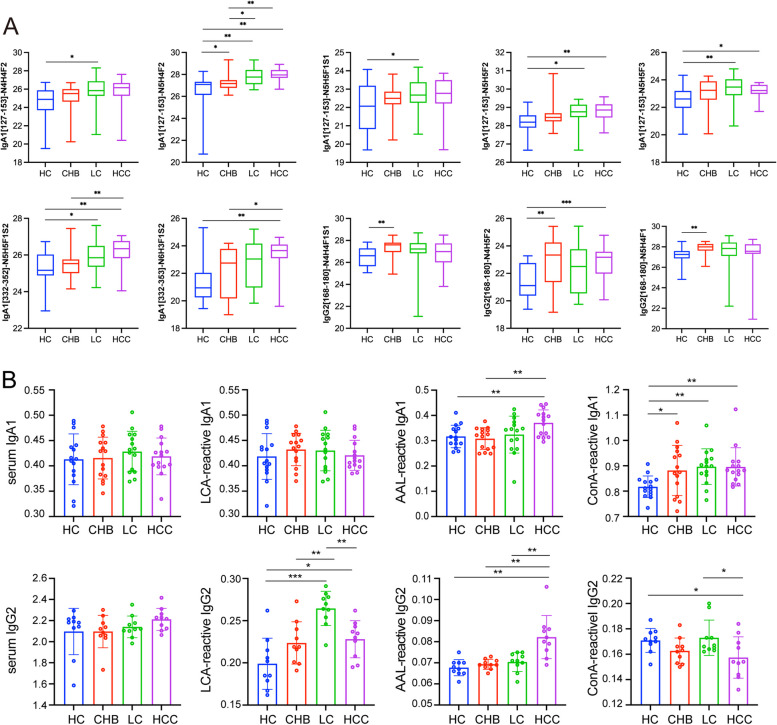
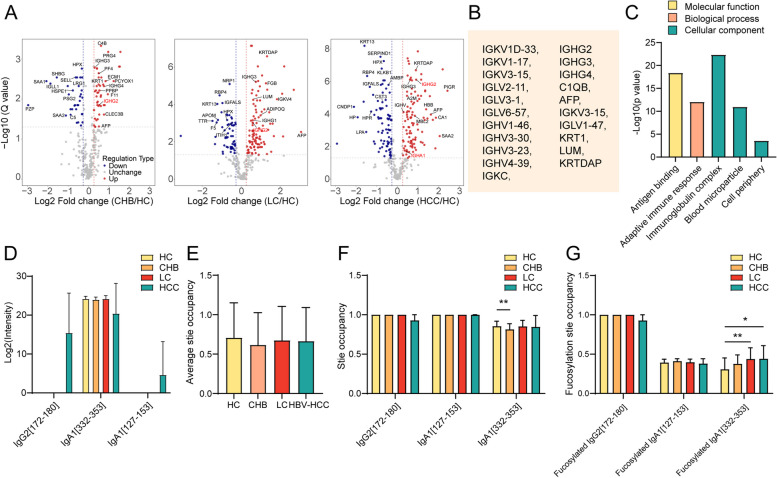
Results: Bioinformatic analysis of Gene Expression Omnibus (GEO) datasets uncovered dysregulation of fucosyltransferases (FUTs) in liver tissues from HCC patients compared to adjacent tissues. Glycomic analysis indicated an elevated level of fucosylated N-glycans, especially a progressive increase in fucosylation levels on IgA1 and IgG2 determined by glycoproteomic analysis.

Conclusions: The findings indicate that the abnormal fucosylation plays a pivotal role in the progression of HBV-HCC. Systematic and integrative multi-omic analysis is anticipated to facilitate the discovery of aberrant glycoconjugates in tumor progression.

Keywords: Fucosylation; Glycomics; Glycoproteomics; HBV-associated HCC; Transcriptomics.


Conflict of interest statement

The authors declare no competing interests.

Figures

Fig. 1
Fig. 1
Differentially expressed glycan-related genes in HBV-related HCC of GSE135631 and GSE94660. A Workflow of the present study. B Volcano plot of expression patterns of identified genes in GSE135631 and GSE94660. Red dots: up-regulated genes. Green dots: down-regulated genes. Highlighted dots: DEGGs. The q value (log10) is plotted against the log10 (FC: HBV-HCC tissues vs. adjacent tissues) using the cut-offs of fold change > 1.5 or < 0.67 and p value < 0.05. C PLS-DA plot of DEGGs in GSE135631 and GSE94660. D Heatmap showing the expression pattern of DEGGs in HBV-HCC and adjacent tissues of GSE135631 and GSE94660. E Functional enrichment analysis of DEGGs. F The PPI network of DEGGs performed by the STRING database and cytoscape tools. The red colour intensity was proportional to the degree of connectivity. G The mRNA expression of 13 FUTs, PIGV, PIGT, PIGM and B4GALT3 genes in 3 pairs of HBV-HCC and adjacent tissues determined by RT-qPCR
Fig. 2
Fig. 2
MALDI-TOF/TOF–MS spectra of N-glycans in HC, CHB, LC and HBV-HCC serum samples. Peaks of MALDI-TOF/TOF–MS spectra (signal-to-noise ratio > 5) were selected for relative intensity analysis in HC (A), CHB (B), LC (C) and HBV-HCC (D) samples. Detailed structures were annotated with GlycoWorkbench software. Proposed structures are indicated by m/z value
Fig. 3
Fig. 3
N-glycan levels in HC, CHB, LC and HBV-HCC serum samples. A Expression pattern and dysregulation of N-glycans identified in HC, CHB, LC and HBV-HCC. B Relative abundances of high mannose, complex and hybrid N-glycans. The relative abundance is calculated by adding the relative abundances of a given type of N-glycan. C Relative abundances of bi-, mono- and afucosylated N-glycans. D Relative abundances of bi-, mono- and asialylated N-glycans. E Relative abundances of N-glycans with mono-, bi- and tri/tetra-antennary structures
Fig. 4
Fig. 4
Quantitative glycoprotemic analysis of HC, CHB, LC and HBV-HCC serum samples. A Venn diagram of intact glycopeptides identified from HC, CHB, LC and HBV-HCC samples. B Distribution of glycan subtypes from intact glycopeptides identified from HC, CHB, LC and HBV-HCC samples. C Volcano plots of expression patterns of identified glycopeptides. Red dots: up-regulated glycopeptides. Green dots: down-regulated glycopeptides. The value q (-log10) is plotted against the log10 (FC: disease group vs. normal group). D Classification of differentially expressed intact glycopeptides based on their attached glycan structures. The numbers indicate the unique glycopeptides modified by the corresponding glycans
Fig. 5
Fig. 5
Hierarchical clustering analysis of differentially expressed glycopeptides identified in HC, CHB, LC and HBV-HCC. A Mfuzz clustering of differentially expressed glycopeptides. B Expression pattern of glycopeptides from cluster I, II, III and IV. C Functional enrichment analysis of differentially expressed glycopeptides from cluster I. D Heatmap of fucosylated N-glycans on intact glycopeptides from cluster I. PSMs of the intact glycopeptides, comprising of different glycans (bottom) and their glycosite locations in different glycoproteins (right) are exhibited in the heat map
Fig. 6
Fig. 6
Site-specific glycan profiling of IGHA1 and IGHG2 identified in HC, CHB, LC and HBV-HCC. Heatmap showing all the identified glycans at the glycosite Asn-144, Asn-340 of IGHA1, and Asn-176 of IGHG2
Fig. 7
Fig. 7
Differentially expressed intact glycopeptides of IGHA1 and IGHG2. A Box plots of 10 site-specific fucosylated glycopeptides from IgA1 and IgG2 showed a directionally concerted up-regulation in the HC-CHB-LC-HCC progression. B Relative expression of IgA1/ IgG2 and ConA-/ LCA-/ AAL-reactive IgA1/ IgG2 in the HC, CHB, LC and HBV-HCC serum determined by ELISA
Fig. 8
Fig. 8
Glycosylation site occupancy. A Volcano plots of expression patterns of identified proteins. Red dots: up-regulated proteins. Green dots: down-regulated proteins. The value q (-log10) is plotted against the log2 (FC: disease group vs. normal group). B Lists of concertedly up-regulated proteins in patients with liver disease (CHB, LC, or HBV-HCC) compared to HC. C GO enrichment analysis of the concertedly up-regulated proteins in HBV-HCC. D Levels of peptides from IgA1 and IgG2, including IgA1[127–153], IgA1[332–353] and IgG2[168–180] in HC, CHB, LC and HBV-HCC. E Average glycosylation site occupancy in HC, CHB, LC and HBV-HCC. Glycosylation site occupancy was calculated by dividing the abundance of a given type of glycoform by the total corresponding peptide (glycopeptide and non-glycopeptide) abundance. F Glycosylation site occupancy of IgA1[127–153], IgA1[332–353] and IgG2[168–180]. G Fucosylation site occupancy of IgA1[127–153], IgA1[332–353] and IgG2[168–180]

References

    1. Vogel A, Meyer T, Sapisochin G, Salem R, Saborowski A. Hepatocellular carcinoma. Lancet. 2022;400:1345–1362. doi: 10.1016/S0140-6736(22)01200-4. - DOI - PubMed
    1. Zhang CH, Cheng Y, Zhang S, Fan J, Gao Q. Changing epidemiology of hepatocellular carcinoma in Asia. Liver Int. 2022;42:2029–2041. doi: 10.1111/liv.15251. - DOI - PubMed
    1. Li TY, Yang Y, Zhou G, Tu ZK. Immune suppression in chronic hepatitis B infection associated liver disease: a review. World J Gastroenterol. 2019;25:3527–3537. doi: 10.3748/wjg.v25.i27.3527. - DOI - PMC - PubMed
    1. Yue T, Zhang Q, Cai T, Xu M, Zhu H, Pourkarim MR, et al. Trends in the disease burden of HBV and HCV infection in China from 1990–2019. Int J Infect Dis. 2022;122:476–485. doi: 10.1016/j.ijid.2022.06.017. - DOI - PubMed
    1. Wang H, Men P, Xiao Y, Gao P, Lv M, Yuan Q, et al. Hepatitis B infection in the general population of China: a systematic review and meta-analysis. BMC Infect Dis. 2019;19:811. doi: 10.1186/s12879-019-4428-y. - DOI - PMC - PubMed

Publication types