. 2024 Apr 1;16(1):50.
doi: 10.1186/s13148-024-01656-4.

Nucleosome reorganisation in breast cancer tissues

Affiliations

Nucleosome reorganisation in breast cancer tissues

Divya R Jacob et al. Clin Epigenetics. .

Abstract

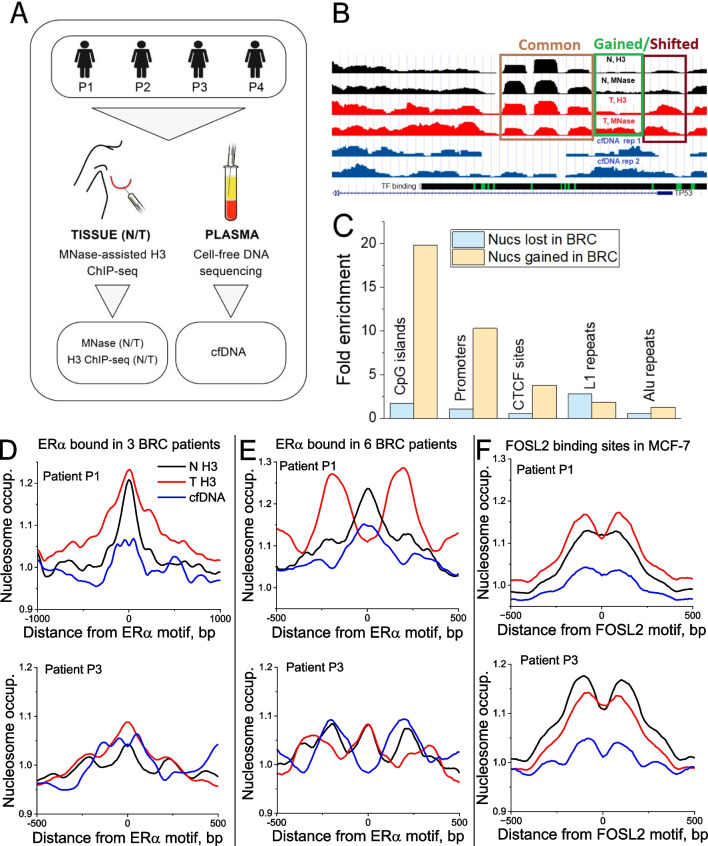
Background: Nucleosome repositioning in cancer is believed to cause many changes in genome organisation and gene expression. Understanding these changes is important to elucidate fundamental aspects of cancer. It is also important for medical diagnostics based on cell-free DNA (cfDNA), which originates from genomic DNA regions protected from digestion by nucleosomes.

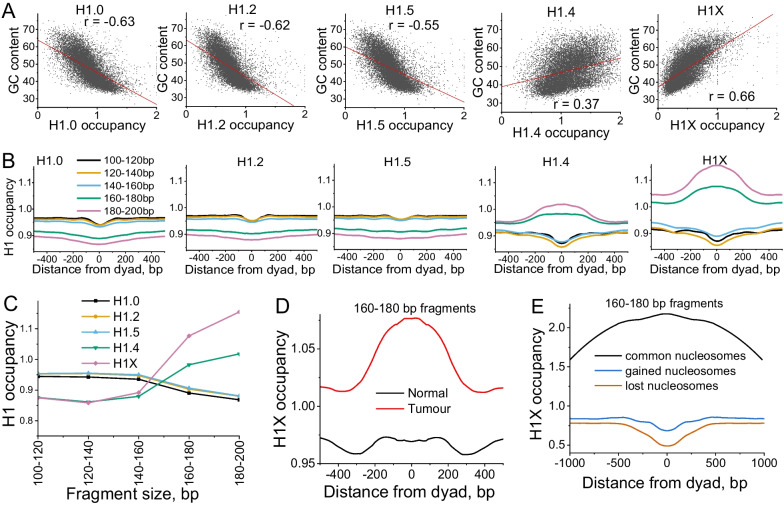
Results: We have generated high-resolution nucleosome maps in paired tumour and normal tissues from the same breast cancer patients using MNase-assisted histone H3 ChIP-seq and compared them with the corresponding cfDNA from blood plasma. This analysis has detected single-nucleosome repositioning at key regulatory regions in a patient-specific manner and common cancer-specific patterns across patients. The nucleosomes gained in tumour versus normal tissue were particularly informative of cancer pathways, with ~ 20-fold enrichment at CpG islands, a large fraction of which marked promoters of genes encoding DNA-binding proteins. The tumour tissues were characterised by a 5-10 bp decrease in the average distance between nucleosomes (nucleosome repeat length, NRL), which is qualitatively similar to the differences between pluripotent and differentiated cells. This effect was correlated with gene activity, differential DNA methylation and changes in local occupancy of linker histone variants H1.4 and H1X.

Conclusions: Our study offers a novel resource of high-resolution nucleosome maps in breast cancer patients and reports for the first time the effect of systematic decrease of NRL in paired tumour versus normal breast tissues from the same patient. Our findings provide a new mechanistic understanding of nucleosome repositioning in tumour tissues that can be valuable for patient diagnostics, stratification and monitoring.

Keywords: Breast cancer; Chromatin; Linker histones; Liquid biopsy; NRL; Nucleosome positioning; Nucleosome repeat length; Nucleosomics; Transcription factors binding; cfDNA.


Conflict of interest statement

The authors declare that they have no competing interests.

Figures

Fig. 1
Fig. 1
The study design and small-scale nucleosome repositioning analysis. A Scheme of the study: paired tumour/normal breast tissues taken from breast cancer patients numbered P1–P4 were used to determine nucleosome positioning using MNase-seq and MNase-assisted histone H3 ChIP-seq (MNase-H3), complemented by whole-genome sequencing of cell-free DNA extracted from blood plasma from the same patients. The analysis of each sample was performed individually, without pooling. B Example genomic region (Chr 17: 7,855,262–7,592,516) enclosing gene TP53 and nucleosome occupancy maps for patient P3. Tracks top to bottom: normal tissue MNase-H3 and MNase-seq; tumour tissue MNase-H3 and MNase-seq; cfDNA in two replicates; UCSC Genome Browser track with ENCODE Factorbook TF motifs. Rectangles show regions containing common (brown), gained (green) and shifted nucleosomes (violet). The gained and shifted classifications are not mutually exclusive. C Fold enrichment of nucleosomes that were gained and lost in all tumours versus healthy breast tissues in CpG islands, promoters, CTCF binding sites, L1 repeats and Alu repeats, in comparison with the intersections with these regions expected by chance. In all cases except for nucleosomes lost in BRC at CTCF sites, enrichments are statistically significant (p < 0.005, Fisher test). DF Representative nucleosome occupancy profiles around TF binding sites. D and E Nucleosome profiles in patient P1 (top) and patient P3 from the current cohort (bottom) around ERα sites bound in any three out of six ER-positive BRC patients from the cohort of Severson et al., 2018 (D) and in sites bound by ERα in all six BRC patients from Severson et al., 2018 (E) (10-bp smoothing). F Nucleosome profiles in patient P1 (top) and patient P3 (bottom) around FOSL2 binding sites determined in MCF-7 cells. Black lines—tumour tissues; red—normal tissues; blue—cfDNA from the same patient
Fig. 2
Fig. 2
Nucleosome repeat length shortening in cancer. A Frequencies of distances between dyads of DNA fragments protected from MNase digestion in paired normal and tumour breast tissue samples from patient P2. B Genome-wide NRL values calculated for each sample reported in this study. The difference of NRLs between normal and tumour tissues is statistically significant (p = 0.014, paired sample t test). Open squares—average values across all samples in a given condition; horizontal lines—median values for a given condition. The colours of the points corresponding to NRL values in N/T tissues are assigned per patient and per experiment type as follows: MNase-seq: patient P1 (black), P2 (red), P3 (blue), P4 (green); MNase-assisted H3 ChIP-seq: patient P1 (violet), P3 (brown), P4 (cyan). Panels A and B use DNA fragments of sizes 120–180 bp. C NRL in normal (grey violins) and tumour (beige violins) breast tissue calculated inside genomic regions enriched with 160–180 bp DNA fragments (“long nuc”) and depleted of 160–180 bp fragments (“short nuc”). The colours of the points are assigned per patient and per experiment type in the same way as in B. Paired-sample t test p values are indicated on the figure. Open squares—average values across all samples in a given condition; horizontal lines—median values for a given condition. D NRL in normal and tumour breast tissue samples from patient P2 inside genes which are marked by nucleosome loss or gain at their promoters (black), compared with NRL calculated genome-wide in 10 kb regions with low-GC content (< 40%) (red) and high-GC content (> 40%) (blue). E NRL in normal (black) and tumour breast tissues from patient P2 from this study (red), calculated inside genes which are highly- or lowly expressed in a healthy state (circles) or breast cancer (squares). This analysis is based on 3,000 genes with largest and smallest RSEM values in normal/cancer cells reported by the TCGA Cancer Atlas. F NRL in MCF-7 and T47D breast cancer cells as well as human embryonic stem cells (hESC), compared with NRL in normal and tumour breast tissues. For T47D and hESC, each point corresponds to one replicate experiment. For MCF-7, each point corresponds to a sample with different MNase digestion level. For breast tissues, each point corresponds to one sample from this work, in a subset of genomic regions enriched with DNA fragment sizes in one of the following ranges [100–120 bp], [120–140 bp], [140–160 bp], [160–180 bp], [180–200 bp]
Fig. 3
Fig. 3
Interplay between nucleosome stability in BRC, DNA fragment sizes, GC content and DNA methylation. A The distribution of sizes of common nucleosomes that did not shift in cancer (grey) is skewed towards larger sizes in comparison with shifted nucleosomes whose coordinates changed > 20% in cancer (red). B Aggregate DNA methylation profile based on MCF-7 cells plotted around common and shifted nucleosomes determined in this study. C GC content of DNA fragments protected from digestion in normal (black) and cancer breast tissues (red) and cfDNA from the same patient cohort (blue). D DNA methylation based on MCF-7 cells averaged across DNA fragments of different sizes protected from MNase digestion from panel C.
Fig. 4
Fig. 4
Effects of linker histones on nucleosome repositioning in breast cancer. A Correlation of GC content and H1 occupancy in 10-kb regions genome-wide. H1 variants H1.0, H1.2 and H1.5 preferentially bind AT-rich regions, while H1.4 and H1X have a higher affinity for GC-rich regions. BD Averaged aggregate profiles of H1 occupancy around different types of DNA fragments protected from MNase digestion. These profiles were first calculated individually for each MNase-seq tumour tissue sample reported in this study, and then averaged across all patients. B Occupancy of H1 variants around nucleosome dyads calculated for different DNA fragment sizes. C H1 occupancy in the region [-50, 50] bp around nucleosome dyad calculated for different H1 variants as a function of DNA fragment size. D Average H1X occupancy in T47D breast cancer cell line calculated around DNA fragments of 160–180 bp in normal (black lines) and tumour breast tissues (red). E Average H1X occupancy profiles around the consensus set defined based on all tissue samples from this study, of common nucleosomes (black), and nucleosomes which are gained (blue) and lost in cancer (orange)
Fig. 5
Fig. 5
NRL shortening as a novel breast cancer marker. AE NRL values calculated for each individual sample from this study inside different types of genomic regions. A Transcriptionally active A-compartments of chromatin annotated in breast cancer MCF-7 cells; B Regions surrounding gene promoters. C Genomic regions around Alu repeats; D Regions enriched with H1X linker histones in breast cancer T47D cells; E Differentially methylated DNA regions annotated based on cell lines MCF-10A, MCF-7 and MDA-MB-231. Open squares—average NRL values for a given condition; horizontal lines—median values. The colours of the points are assigned per sample as in Fig. 3A. F A scheme of the global change of nucleosome compaction in breast cancer tissues. DNA (black) is wrapped around histone octamers (grey) in contact with linker histones (blue). MNase used in this study or apoptotic nucleases present in situ (orange) cut DNA not protected by nucleosomes and linker histones. Cancer cells have shorter NRL and contain more nucleosomes which are less protected from MNase digestion due to redistribution of linker histone variant H1X, changes in DNA methylation and other factors

References

    1. Shtumpf M, Piroeva KV, Agrawal SP, Jacob DR, Teif VB. NucPosDB: a database of nucleosome positioning in vivo and nucleosomics of cell-free DNA. Chromosoma. 2022;131(1–2):19–28. doi: 10.1007/s00412-021-00766-9. - DOI - PMC - PubMed
    1. Kustanovich A, Schwartz R, Peretz T, Grinshpun A. Life and death of circulating cell-free DNA. Cancer Biol Ther. 2019;20(8):1057–1067. doi: 10.1080/15384047.2019.1598759. - DOI - PMC - PubMed
    1. Snyder MW, Kircher M, Hill AJ, Daza RM, Shendure J. Cell-free DNA comprises an in vivo nucleosome footprint that informs its tissues-of-origin. Cell. 2016;164(1–2):57–68. doi: 10.1016/j.cell.2015.11.050. - DOI - PMC - PubMed
    1. Teif VB, Vainshtein Y, Caudron-Herger M, Mallm JP, Marth C, Hofer T, Rippe K. Genome-wide nucleosome positioning during embryonic stem cell development. Nat Struct Mol Biol. 2012;19(11):1185–1192. doi: 10.1038/nsmb.2419. - DOI - PubMed
    1. Cole L, Kurscheid S, Nekrasov M, Domaschenz R, Vera DL, Dennis JH, Tremethick DJ. Multiple roles of H2A.Z in regulating promoter chromatin architecture in human cells. Nat Commun. 2021;12(1):2524. doi: 10.1038/s41467-021-22688-x. - DOI - PMC - PubMed

Publication types