. 2024 Apr 1;17(1):96.
doi: 10.1186/s13104-024-06748-1.

Resilience and mindfulness among radiological personnel in Norway, their relationship and their impact on quality and safety- a questionnaire study

Affiliations

Resilience and mindfulness among radiological personnel in Norway, their relationship and their impact on quality and safety- a questionnaire study

Ann Mari Gransjøen. BMC Res Notes. .

Abstract

Background: Stress and burnout are widespread problems among radiological personnel Individual and organizational resilience and mindfulness offer protection against burnout.

Aim: To investigate the level of resilience and mindfulness among radiological personnel, the associations between organizational resilience, individual resilience, and mindfulness, and how these factors impact the quality of care provided in radiological departments.

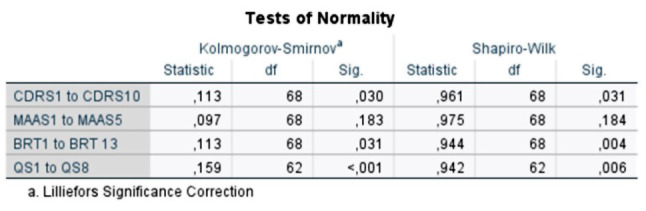
Methods: An online questionnaire consisting of the Connor-Davidson Resilience Scale, the Mindful Attention Awareness Scale, the Benchmark Resilience Tool, and questions regarding burnout, and quality and safety was used. Data analysis consisted of descriptive statistics, bivariate correlation and standard multiple regression.

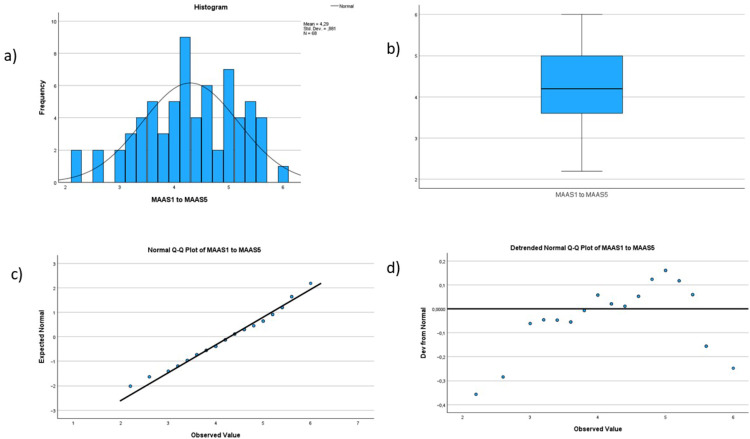
Results and conclusion: Few participants considered burnout a significant challenge. Individual and organizational resilience were low (30.40 ± 4.92 and 63.21 ± 13.63 respectively), and mindfulness was high (4.29 ± 0.88). There was a significant correlation between individual and organizational resilience (p = 0.004), between individual resilience and mindfulness (p = 0.03), and between organizational resilience and mindfulness (p = 0.02). Individual and organizational resilience affect each other. However; neither significantly affect quality and safety, nor mindfulness.

Keywords: Individual resilience; Mindfulness; Organizational resilience; Quality and safety.


Conflict of interest statement

The authors declare no competing interests.

Figures

Fig. 1
Fig. 1
Tests of normality. Table produced by SPSS describing the tests of normality that were performed on all main variables: individual resilience (CDRS1 to CDRS10), mindfulness (MAAS1– MAAS5), organizational resilience (BRT1 to BRT13), and quality and safety (QS1 to QS8). This includes the Kolmogorov - Smirnov and Shapiro - Wilk tests. The significance value (Sig.) under 0.05 indicates that the variables individual resilience, organizational resilience and quality and safety are not normally distributed. This does not necessarily indicate a problem with the scale used, but rather reflects the underlying nature of the construct being measured. In the case of resilience previous studies have shown this to be low among radiological personnel, which can explain why this variable is somewhat skewed. Low organizational resilience can explain why this variable is skewed, and high quality and safety can explain why this variable is skewed even if there are no problems with the scales themselves. Further inspections of normality are shown in figures 2, 3, 4 and 5
Fig. 2
Fig. 2
Histogram, boxplot, and Q-Q Plots for the variable individual resilience. The histogram (labeled a in the figure) shows that the data are not entirely normally distributed but have a peak to the left. However, the data are not severely skewed. The boxplot (labeled b in the figure) shows no outliers. The Normal Q-Q Plot (labeled c in the figure) shows a reasonably straight line, indicating that the data are not entirely normally distributed, but are not severely skewed. Last, the Detrended Normal Q-Q Plot (labeled d in the figure) show no clustering of points, indicating that the data are not severely skewed for this variable
Fig. 3
Fig. 3
Histogram, boxplot and Q-Q Plots for the variable organizational resilience. The histogram (labeled a in the figure) shows that the data are not entirely normally distributed but are somewhat skewed to the left. However, the data are not severely skewed. The boxplot (labeled b in the figure) shows no outliers. The Normal Q-Q Plot (labeled c in the figure) shows a reasonably straight line, indicating that the data are not entirely normally distributed, but are not severely skewed. Last, the Detrended Normal Q-Q Plot (labeled d in the figure) show no clustering of points, indicating that the data are not severely skewed for this variable
Fig. 4
Fig. 4
Histogram, boxplot and Q-Q Plots for the variable mindfulness. The histogram (labeled a in the figure) shows that the data are reasonably normally distributed. The boxplot (labeled b in the figure) shows no outliers. The Normal Q-Q Plot (labeled c in the figure) is showing a reasonably straight line, indicating that the data is normally distributed. Last, the Detrended Normal Q-Q Plot (labeled d in the figure) shows no clustering of points, indicating that the data are not skewed for this variable.
Fig. 5
Fig. 5
Histogram, boxplot and Q-Q Plots for the variable quality and safety. The histogram (labeled a in the figure) shows that the data are not entirely normally distributed but have a peak to the right. However, the data are not severely skewed. The boxplot (labeled b in the figure) shows no outliers. The Normal Q-Q Plot (labeled c in the figure) shows a reasonably straight line, indicating that the data are not entirely normally distributed, but are not severely skewed. Last, the Detrended Normal Q-Q Plot (labeled d in the figure) show no clustering of points, indicating that the data are not severely skewed for this variable.
Fig. 6
Fig. 6
Tests for confounding factors in the models. To check for confounding factors the models were built by adding in one independent variable at a time. In model 1 (labeled a in the figure), where individual resilience is the dependent variable and mindfulness and organizational resilience are the independent variables, mindfulness might be a confounding variable. This is indicated by a change in the β-value (and standardized β-value) that is rather large. However, the large CI makes this change less worrisome. In model 2 (labeled b in the figure), where organizational resilience is the dependent variable and individual resilience and mindfulness are the independent variables a similar challenge occurred. This can indicate that the confounding might be between mindfulness and individual resilience. However, the CI is still large enough that the change in value in mindfulness is not worrisome. In the third and last model (labeled c in the figure), mindfulness still might be a confounding variable with individual resilience based on the change in its β-value when individual resilience is introduced which is not seen when organizational resilience is introduced to the model. The change in beta-value is the largest in this model, and the smaller CI makes this change more worrisome than in the other two models. The change in β-values and large CI can also, in part, be explained by the correlation between these factors and the relationship between them that has been established in previous studies. Since the evidence for confounding is not that strong and the indication of confounding is between two factors with a known correlation the choice was made to perform the statistical analysis as planned.
Fig. 7
Fig. 7
Tests for interacting variables. To check for interaction between variables the Z-scores for the variables were used, as well as moderator-variables. The Z-scores are a variable standardized to have a standard deviation of 1 and a mean of 0. The moderation-variable is the product of the independent variables in the planned regression model, which is then added to the regression model. To confirm if a variable has a moderation effect on the relationship between an independent variable and a dependent variable, the nature of this relationship must change once the moderator variable changes. In this case there does not seem to be any interacting factors, since the moderator variable is not statistically significant in either model 1 (labeled a in the figure), model 2 (labeled b in the figure) or model 3 (labeled c in the figure). This is further supported by the fact that the R Squared or adjusted R squared did not significantly change between this model and the model run with the actual variables, indicating that the relationship between the variables has not changed
Fig. 8
Fig. 8
Bivariate correlation using Spearman’s Rho. The correlation analysis revealed that there are statistically significant relationships between mindfulness and individual resilience (ρ = 0.27, n=62, p= 0.03), between mindfulness and organizational resilience (ρ = 0.28, n=62, p= 0.02), and between individual and organizational resilience (ρ = 0.35, n=62, p= 0.004). There are no variables that are significantly correlated with quality and safety, however. Even if it is not statistically significant, there seems to be a small, negative relationship between quality and safety and individual resilience (ρ = -0.16, n=62, p=0.21). This could indicate that there is a relationship between these variables that could be worth exploring even if their relationship is not statistically significant in this test.
Fig. 9
Fig. 9
Summary of model 1. There do not appear to be any problems with multicollinearity in this model (tolerance <0.10, VIF-values >10 in the table labeled a in the figure, only one dimension with a variance proportion <0.90 in the table labeled b in the figure, and small correlation between the independent variables, the Pearson Correlation being 0.27, as seen in the table labeled c in the figure). There do not seem to be any outliers in the model, and the reasonably straight line in the Normal P-P Plot (labeled d in the figure) indicates normality of the data. The Adjusted R Square of the model is 0.138 (13.8% of the variance in individual resilience can be explained by the independent variables), which is statistically significant (F=6.38, p= 0.003). Organizational resilience contributed the largest, and statistically significant, unique contribution to the equation (Beta=0.31, p=0.01, as seen in the table labeled a in the figure)
Fig. 10
Fig. 10
Summary of model 2There could be a small challenge with multicollinearity in this model. Tolerance <0.10, and VIF-values >10 in the table labeled a in the figure, does not indicate any problems, but there are two dimensions with a variance proportion <0.90 in the table labeled b in the figure, which can indicate some problems with multicollinearity. However, the correlation between the independent variables is low enough (Pearson Correlation =0.27) that it is not worrisome. There do not seem to be any outliers in the model, and the reasonably straight line in the Normal P-P Plot (labeled d in the figure) indicates normality of the data. The models Adjusted R Square is 0.139 (13.9% of the variance in organizational resilience can be explained by the independent variables), which is statistically significant (F=6.39, p= 0.003). Individual resilience contributed the largest, and statistically significant, unique contribution to the equation (Standardized β=0.31, p=0.01, as seen in the table labeled a in the figure)
Fig. 11
Fig. 11
Summary of model 3There do not appear to be any problems with multicollinearity in this model (tolerance <0.10, VIF-values >10 in the table labeled a in the figure, no dimension with a variance proportion <0.90 in the table labeled b in the figure, and small correlation between the independent variables, the Pearson Correlation ranging from -0.12 to 0.07, as seen in the table labeled c in the figure). There do not seem to be any outliers in the model, and the reasonably straight line in the Normal P-P Plot (labeled d in the figure) indicates normality of the data. The models Adjusted R Square is -0.018 indicating that the independent variables do not have enough predictive value. The model is not statistically significant (F=0.64, p= 0.59).
Fig. 12
Fig. 12
Residual analysis for model fit. Based on the residual analysis all three models have a reasonably good fit. All residuals are somewhere between -3 and 3 in all models (model 1 is labeled a in the figure, model 2 is labeled b, and model 3 is labeled c in the figure), indicating a reasonably good fit. In model 3 (labeled c), all residuals are somewhere between -2 and 2, indicating that this model might have the best fit out of the three. The residuals are also reasonably normally distributed for models 1 and 3 (labeled a and c), further supporting that the models have a good fit. For model 2 (labeled b in the figure) the residuals seem to be somewhat skewed to the left; however, they are not skewed enough that they indicate a problem with the fit of the model.

Similar articles

References

    1. Ayyala RS, Ahmed FS, Ruzal-Shapiro C, Taylor GA. Prevalence of burnout among pediatric radiologists. J Am Coll Radiol. 2019;16(4):518–22. doi: 10.1016/j.jacr.2018.08.016. - DOI - PubMed
    1. Bundy JJ, Hage AN, Srinivasa RN, Gemmete JJ, Lee E, Gross JS, et al. Burnout among interventional radiologists. J Vasc Interv Radiol. 2020;31(4):607–13. doi: 10.1016/j.jvir.2019.06.002. - DOI - PubMed
    1. Spieler B, Baum N. Burnout: a mindful framework for the radiologist. Curr Probl Diagn Radiol. 2022;51(2):155–61. doi: 10.1067/j.cpradiol.2021.08.005. - DOI - PubMed
    1. Kalantarova S, Mickinac N, Santhosh S, Malik S, Surovitsky M, Madsen L, et al. Preventing physician burnout in breast imaging: scope of the Problem and Keys to Success. Curr Probl Diagn Radiol. 2021;50(5):734–7. doi: 10.1067/j.cpradiol.2020.09.005. - DOI - PubMed
    1. Ganeshan D, Wei W, Yang W. Burnout in chairs of academic radiology departments in the United States. Acad Radiol. 2019;26(10):1378–84. doi: 10.1016/j.acra.2018.12.006. - DOI - PubMed

Supplementary concepts

LinkOut - more resources