

Nanofunctionalized Microparticles for Glucose Delivery in Three-Dimensional Cell Assemblies
- PMID: 38561903
- PMCID: PMC11009907
- DOI: 10.1021/acsami.4c02321
Nanofunctionalized Microparticles for Glucose Delivery in Three-Dimensional Cell Assemblies
Abstract
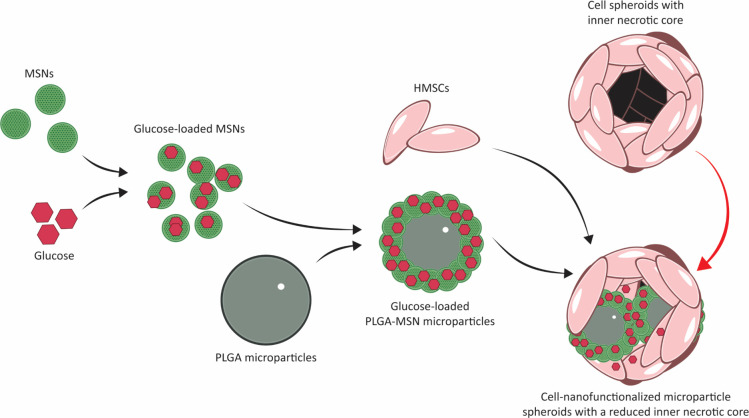
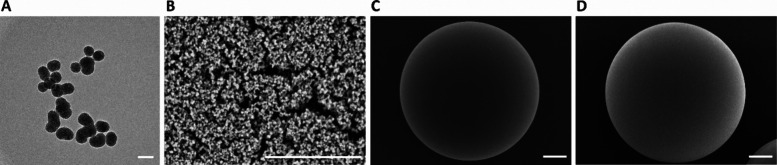
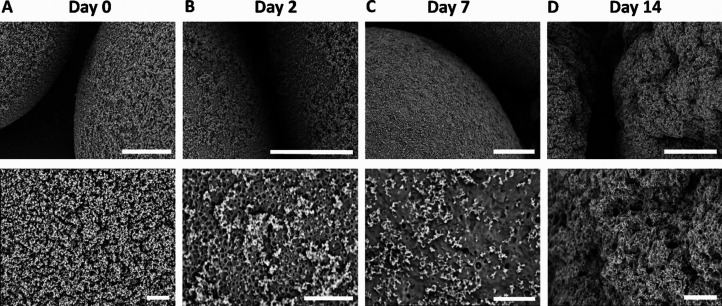
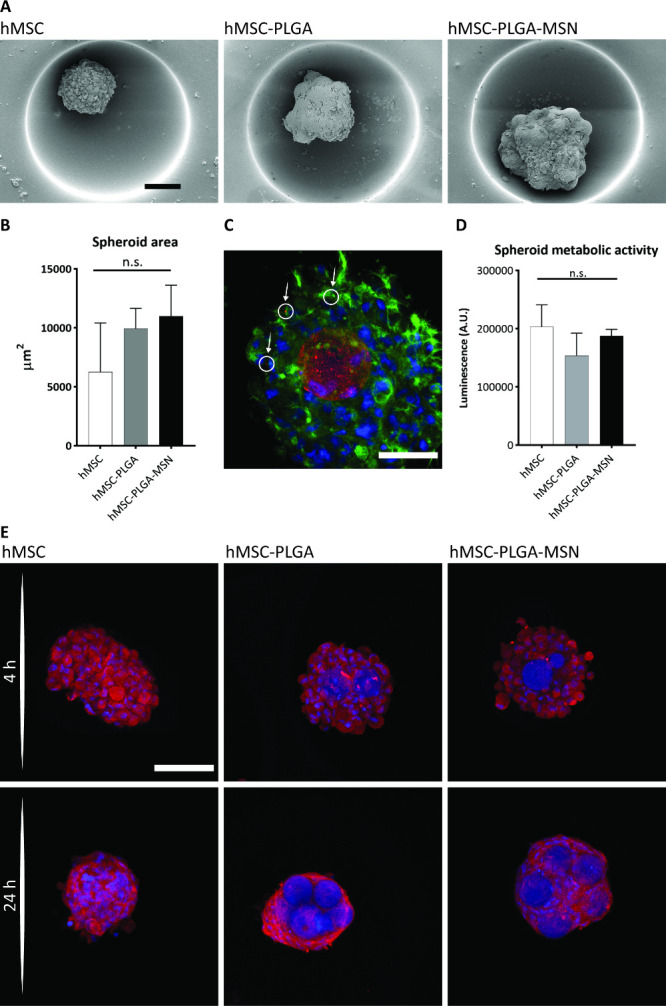
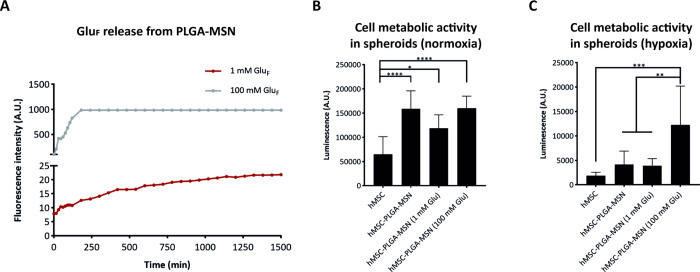
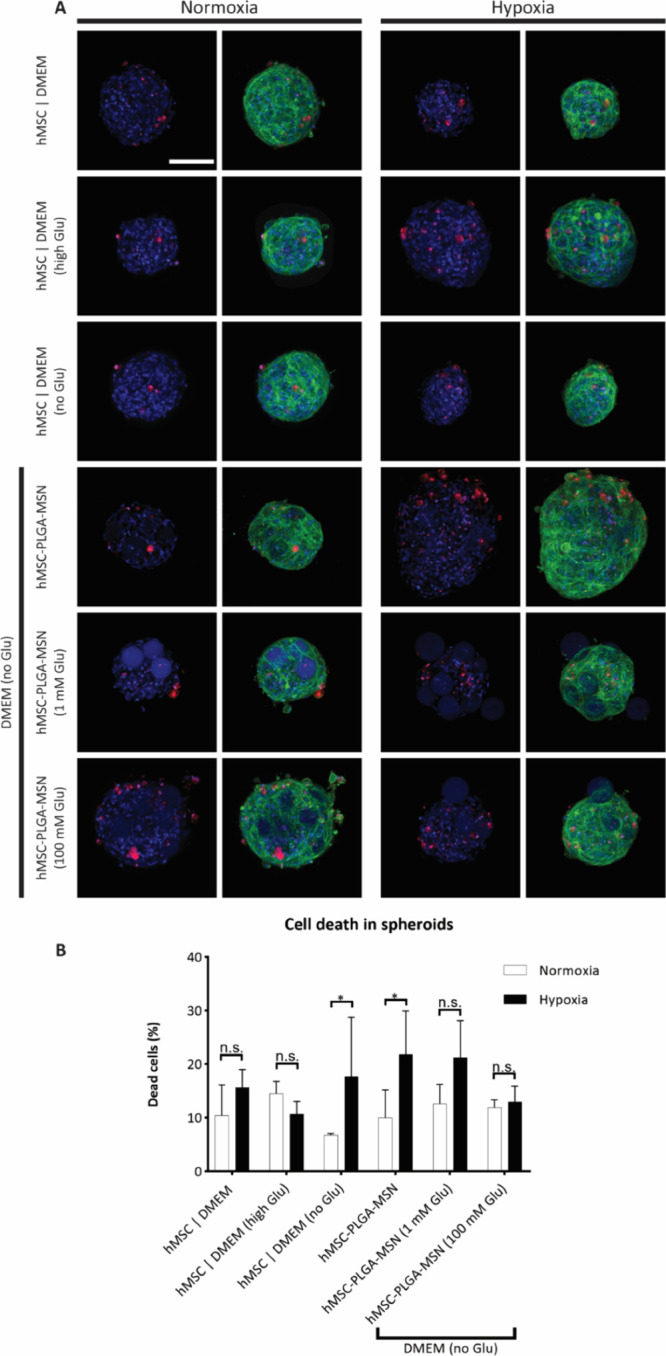
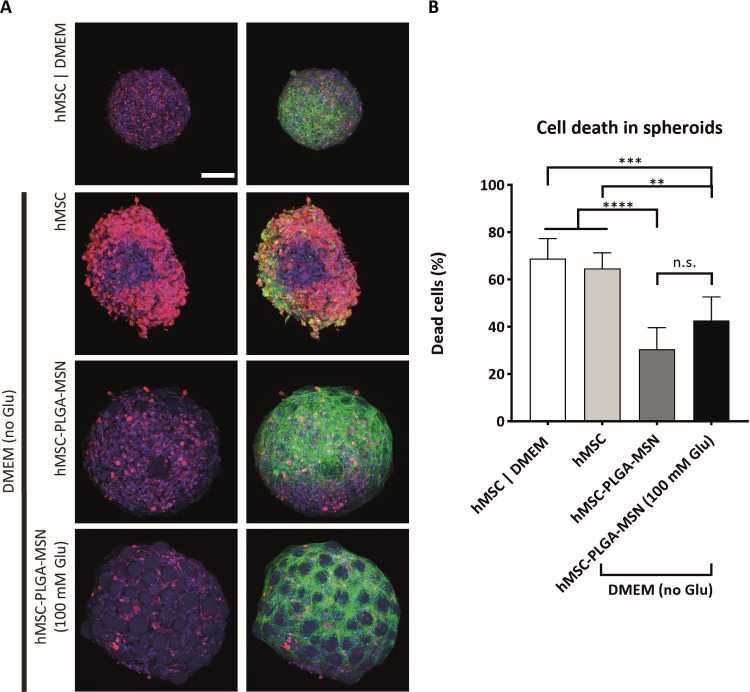
Three-dimensional (3D) cell assemblies, such as multicellular spheroids, can be powerful biological tools to closely mimic the complexity of cell-cell and cell-matrix interactions in a native-like microenvironment. However, potential applications of large spheroids are limited by the insufficient diffusion of oxygen and nutrients through the spheroids and, thus, result in the formation of a necrotic core. To overcome this drawback, we present a new strategy based on nanoparticle-coated microparticles. In this study, microparticles function as synthetic centers to regulate the diffusion of small molecules, such as oxygen and nutrients, within human mesenchymal stem cell (hMSC) spheroids. The nanoparticle coating on the microparticle surface acts as a nutrient reservoir to release glucose locally within the spheroids. We first coated the surface of the poly(lactic-co-glycolic acid) (PLGA) microparticles with mesoporous silica nanoparticles (MSNs) based on electrostatic interactions and then formed cell-nanofunctionalized microparticle spheroids. Next, we investigated the stability of the MSN coating on the microparticles' surface during 14 days of incubation in cell culture medium at 37 °C. Then, we evaluated the influence of MSN-coated PLGA microparticles on spheroid aggregation and cell viability. Our results showed the formation of homogeneous spheroids with good cell viability. As a proof of concept, fluorescently labeled glucose (2-NBD glucose) was loaded into the MSNs at different concentrations, and the release behavior was monitored. For cell culture studies, glucose was loaded into the MSNs coated onto the PLGA microparticles to sustain local nutrient release within the hMSC spheroids. In vitro results demonstrated that the local delivery of glucose from MSNs enhanced the cell viability in spheroids during a short-term hypoxic culture. Taken together, the newly developed nanofunctionalized microparticle-based delivery system may offer a versatile platform for local delivery of small molecules within 3D cellular assemblies and, thus, improve cell viability in spheroids.
Keywords: 3D cell culture; drug delivery; glucose; mesoporous silica nanoparticles; microparticles; spheroids.
Conflict of interest statement
The authors declare the following competing financial interest(s): Stefan Giselbrecht and Roman K. Truckenmller are founders, shareholders, and managing directors of the company 300MICRONS GmbH active in the field of 3D cell culture solutions.
Figures
Similar articles
-
Three-dimensional poly(lactic-co-glycolic acid)/silica colloidal crystal microparticles for sustained drug release and visualized monitoring.J Colloid Interface Sci. 2018 Nov 15;530:465-472. doi: 10.1016/j.jcis.2018.05.102. Epub 2018 May 30. J Colloid Interface Sci. 2018. PMID: 29990782
-
Efficient and cost-effective generation of hepatocyte-like cells through microparticle-mediated delivery of growth factors in a 3D culture of human pluripotent stem cells.Biomaterials. 2018 Mar;159:174-188. doi: 10.1016/j.biomaterials.2018.01.005. Epub 2018 Jan 2. Biomaterials. 2018. PMID: 29329052
-
Generation of Oxygenating Fluorinated Methacrylamide Chitosan Microparticles to Increase Cell Survival and Function in Large Liver Spheroids.ACS Appl Mater Interfaces. 2022 Feb 2;14(4):4899-4913. doi: 10.1021/acsami.1c19962. Epub 2022 Jan 21. ACS Appl Mater Interfaces. 2022. PMID: 35060707
-
A microparticle approach for non-viral gene delivery within 3D human mesenchymal stromal cell aggregates.Acta Biomater. 2019 Sep 1;95:408-417. doi: 10.1016/j.actbio.2019.04.038. Epub 2019 Apr 18. Acta Biomater. 2019. PMID: 31004846 Free PMC article.
-
Cell spheroids as a versatile research platform: formation mechanisms, high throughput production, characterization and applications.Biofabrication. 2021 Apr 8;13(3). doi: 10.1088/1758-5090/abe6f2. Biofabrication. 2021. PMID: 33592595 Review.
References
-
- Leferink A.; Tibbe M. P.; Bossink E. G. B. M.; de Heus L. E.; van Vossen H.; van den Berg A.; Moroni L.; Truckenmüller R. K. Shape-Defined Solid Micro-Objects From Poly(D,L-Lactic Acid) as Cell-Supportive Counterparts in Bottom-Up Tissue Engineering. Mater. Today Bio 2019, 4, 10002510.1016/j.mtbio.2019.100025. - DOI - PMC - PubMed
-
- Leferink A.; Schipper D.; Arts E.; Vrij E.; Rivron N.; Karperien M.; Mittmann K.; van Blitterswijk C.; Moroni L.; Truckenmüller R. K. Engineered Micro-Objects as Scaffolding Elements in Cellular Building Blocks for Bottom-Up Tissue Engineering Approaches. Adv. Mater. 2014, 26 (16), 2592–2599. 10.1002/adma.201304539. - DOI - PubMed
MeSH terms
Substances
LinkOut - more resources
Full Text Sources
Research Materials
Miscellaneous
