The addition of blood flow restriction during resistance exercise does not increase prolonged low-frequency force depression
- PMID: 38562023
- PMCID: PMC11061635
- DOI: 10.1113/EP091753
The addition of blood flow restriction during resistance exercise does not increase prolonged low-frequency force depression
Abstract
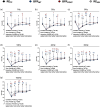
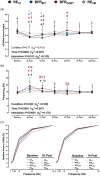
At a given exercise intensity, blood flow restriction (BFR) reduces the volume of exercise required to impair post-exercise neuromuscular function. Compared to traditional exercise, the time course of recovery is less clear. After strenuous exercise, force output assessed with electrical muscle stimulation is impaired to a greater extent at low versus high stimulation frequencies, a condition known as prolonged low-frequency force depression (PLFFD). It is unclear if BFR increases PLFFD after exercise. This study tested if BFR during exercise increases PLFFD and slows recovery of neuromuscular function compared to regular exercise. Fifteen physically active participants performed six low-load sets of knee-extensions across four conditions: resistance exercise to task failure (RETF), resistance exercise to task failure with BFR applied continuously (BFRCONT) or intermittently (BFRINT), and resistance exercise matched to the lowest exercise volume condition (REVM). Maximal voluntary contraction (MVC) force output, voluntary activation and a force-frequency (1-100 Hz) curve were measured before and 0, 1, 2, 3, 4 and 24 h after exercise. Exercise to task failure caused similar reductions at 0 h for voluntary activation (RETF = 81.0 ± 14.2%, BFRINT = 80.9 ± 12.4% and BFRCONT = 78.6 ± 10.7%) and MVC force output (RETF = 482 ± 168 N, BFRINT = 432 ± 174 N, and BFRCONT = 443 ± 196 N), which recovered to baseline values between 4 and 24 h. PLFFD occurred only after RETF at 1 h supported by a higher frequency to evoke 50% of the force production at 100 Hz (1 h: 17.5 ± 4.4 vs. baseline: 15 ± 4.1 Hz, P = 0.0023), BFRINT (15.5 ± 4.0 Hz; P = 0.03), and REVM (14.9 ± 3.1 Hz; P = 0.002), with a trend versus BFRCONT (15.7 ± 3.5 Hz; P = 0.063). These findings indicate that, in physically active individuals, using BFR during exercise does not impair the recovery of neuromuscular function by 24 h post-exercise.
Keywords: PLFFD; ischaemia; oxygen availability; volitional fatigue.
© 2024 The Authors. Experimental Physiology published by John Wiley & Sons Ltd on behalf of The Physiological Society.
Conflict of interest statement
The authors declare no conflicts of interest.
Figures


Similar articles
-
Prolonged low-frequency force depression is underestimated when assessed with doublets compared with tetani in the dorsiflexors.J Appl Physiol (1985). 2019 May 1;126(5):1352-1359. doi: 10.1152/japplphysiol.00840.2018. Epub 2019 Mar 14. J Appl Physiol (1985). 2019. PMID: 30870083 Free PMC article.
-
Impact of Blood Flow Restriction Exercise on Muscle Fatigue Development and Recovery.Med Sci Sports Exerc. 2018 Mar;50(3):436-446. doi: 10.1249/MSS.0000000000001475. Med Sci Sports Exerc. 2018. PMID: 29112627
-
Blood flow restriction does not alter the early hypertrophic signaling and short-term adaptive response to resistance exercise when performed to task failure.J Appl Physiol (1985). 2023 May 1;134(5):1265-1277. doi: 10.1152/japplphysiol.00529.2022. Epub 2023 Apr 13. J Appl Physiol (1985). 2023. PMID: 37055038
-
The effect of blood flow occlusion during acute low-intensity isometric elbow flexion exercise.Eur J Appl Physiol. 2019 Mar;119(3):587-595. doi: 10.1007/s00421-019-04088-8. Epub 2019 Feb 8. Eur J Appl Physiol. 2019. PMID: 30734842 Review.
-
Task-Dependent Mechanisms Underlying Prolonged Low-Frequency Force Depression.Exerc Sport Sci Rev. 2025 Jan 1;53(1):41-47. doi: 10.1249/JES.0000000000000352. Epub 2024 Nov 4. Exerc Sport Sci Rev. 2025. PMID: 39652000 Review.
Cited by
-
The Effect of Blood Flow Restriction Training on Isokinetic Strength Muscle Thickness and Athletic Performance.J Musculoskelet Neuronal Interact. 2025 Jun 1;25(2):208-218. doi: 10.22540/JMNI-25-208. J Musculoskelet Neuronal Interact. 2025. PMID: 40452197 Free PMC article.
-
Effects of different arterial occlusion pressures during blood flow restriction exercise on muscle damage: a single-blind randomized controlled trial.Sci Rep. 2025 Jul 31;15(1):27985. doi: 10.1038/s41598-025-11654-y. Sci Rep. 2025. PMID: 40744948 Free PMC article. Clinical Trial.
-
Effect of training status on muscle excitation and neuromuscular fatigue with resistance exercise with and without blood flow restriction in young men.Physiol Rep. 2025 Mar;13(6):e70274. doi: 10.14814/phy2.70274. Physiol Rep. 2025. PMID: 40110914 Free PMC article.
References
-
- Adami, A. , & Rossiter, H. B. (2018). Principles, insights, and potential pitfalls of the noninvasive determination of muscle oxidative capacity by near‐infrared spectroscopy. Journal of Applied Physiology, 124(1), 245–248. - PubMed
-
- Allen, D. G. , Lamb, G. D. , & Westerblad, H. (2008). Skeletal muscle fatigue: Cellular mechanisms. Physiological Reviews, 88(1), 287–332. - PubMed
-
- Andrade, F. H. , Reid, M. B. , & Westerblad, H. (2001). Contractile response of skeletal muscle to low peroxide concentrations: Myofibrillar calcium sensitivity as a likely target for redox‐modulation. Federation of American Societies of Experimental Biology Journal, 15(2), 309–311. - PubMed
-
- Barstow, T. J. (2019). Understanding near infrared spectroscopy and its application to skeletal muscle research. Journal of Applied Physiology, 126(5), 1360–1376. - PubMed
-
- Broxterman, R. M. , Ade, C. J. , Craig, J. C. , Wilcox, S. L. , Schlup, S. J. , & Barstow, T. J. (2015). Influence of blood flow occlusion on muscle oxygenation characteristics and the parameters of the power‐duration relationship. Journal of Applied Physiology, 118(7), 880–889. - PubMed
Publication types
MeSH terms
Grants and funding
LinkOut - more resources
Full Text Sources
Medical
Miscellaneous
