. 2024 Mar 18:15:1376220.
doi: 10.3389/fendo.2024.1376220. eCollection 2024.

Identifying diagnostic indicators for type 2 diabetes mellitus from physical examination using interpretable machine learning approach

Affiliations

Identifying diagnostic indicators for type 2 diabetes mellitus from physical examination using interpretable machine learning approach

Xiang Lv et al. Front Endocrinol (Lausanne). .

Abstract

Background: Identification of patients at risk for type 2 diabetes mellitus (T2DM) can not only prevent complications and reduce suffering but also ease the health care burden. While routine physical examination can provide useful information for diagnosis, manual exploration of routine physical examination records is not feasible due to the high prevalence of T2DM.

Objectives: We aim to build interpretable machine learning models for T2DM diagnosis and uncover important diagnostic indicators from physical examination, including age- and sex-related indicators.

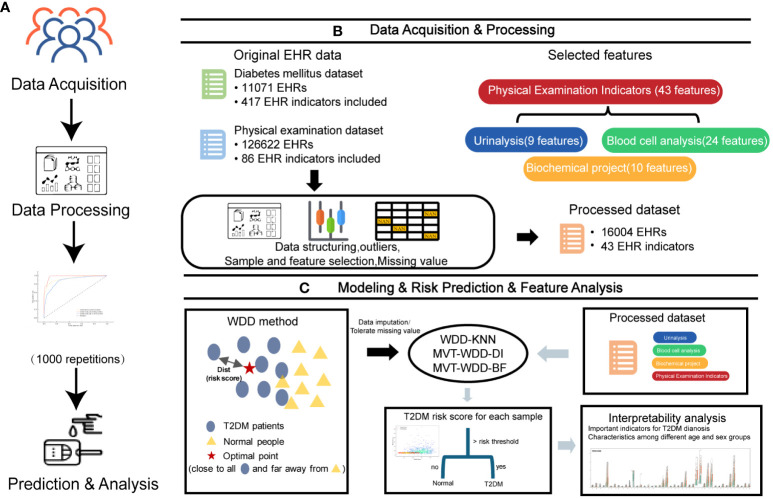
Methods: In this study, we present three weighted diversity density (WDD)-based algorithms for T2DM screening that use physical examination indicators, the algorithms are highly transparent and interpretable, two of which are missing value tolerant algorithms.

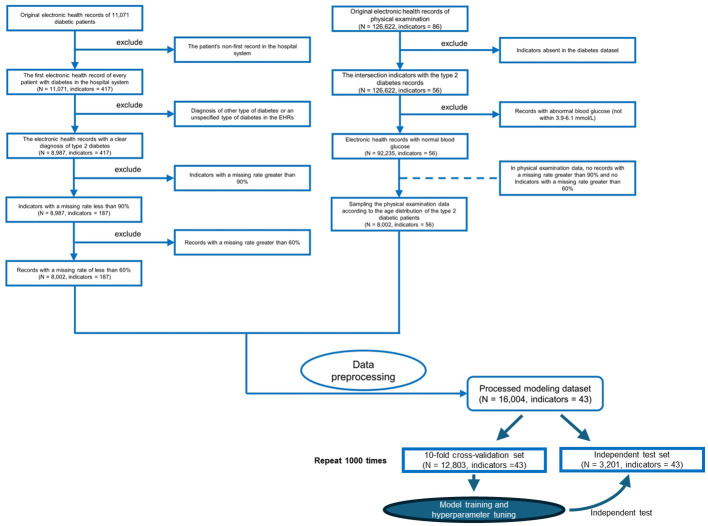
Patients: Regarding the dataset, we collected 43 physical examination indicator data from 11,071 cases of T2DM patients and 126,622 healthy controls at the Affiliated Hospital of Southwest Medical University. After data processing, we used a data matrix containing 16004 EHRs and 43 clinical indicators for modelling.

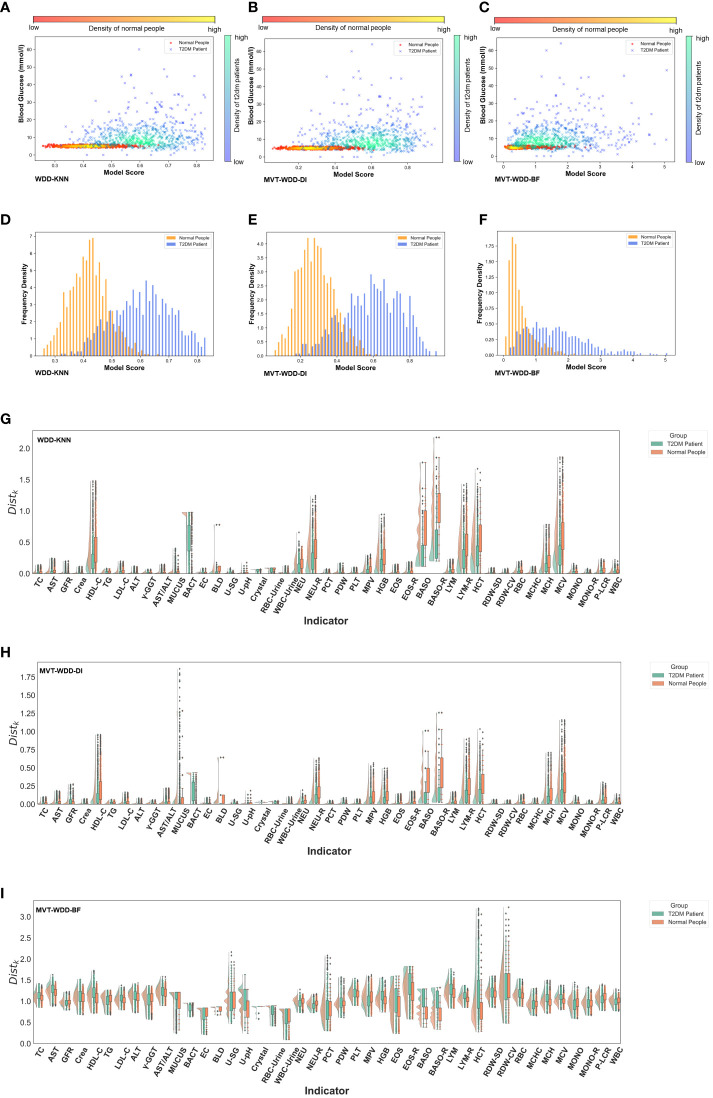
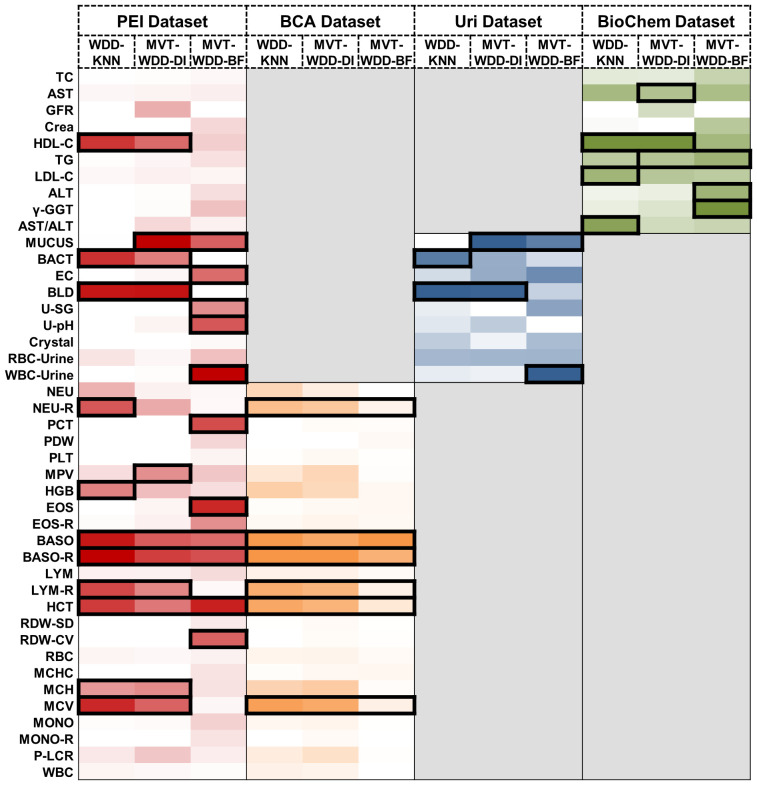
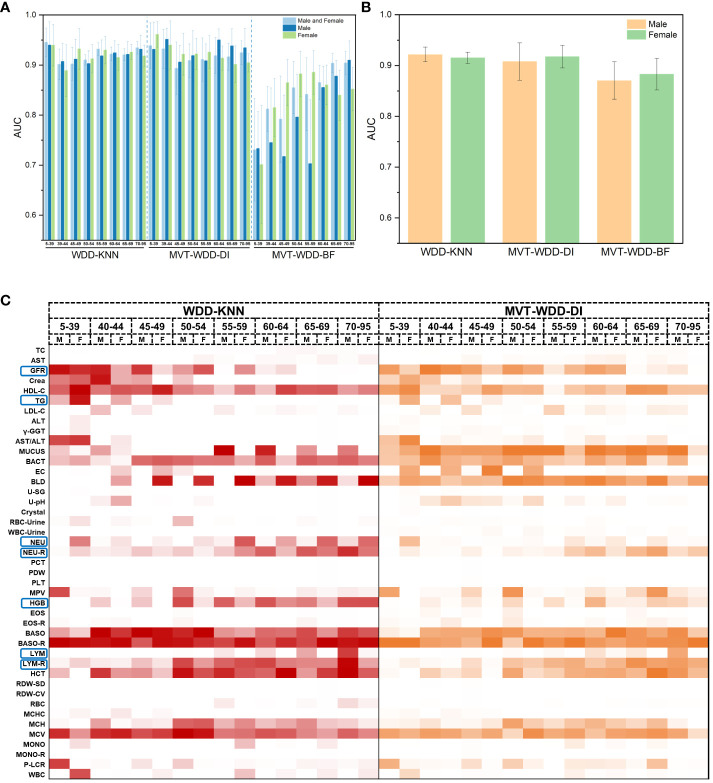
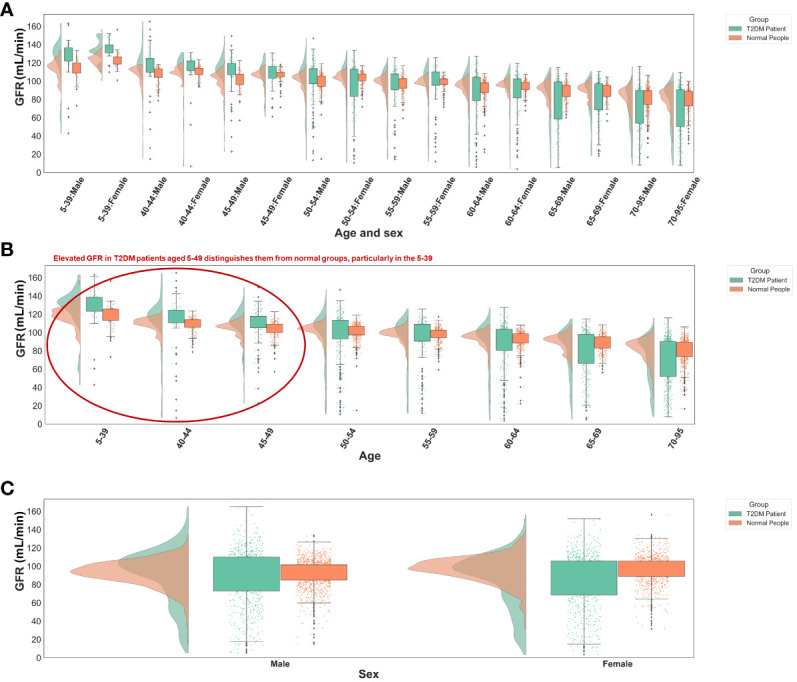
Results: The indicators were ranked according to their model weights, and the top 25% of indicators were found to be directly or indirectly related to T2DM. We further investigated the clinical characteristics of different age and sex groups, and found that the algorithms can detect relevant indicators specific to these groups. The algorithms performed well in T2DM screening, with the highest area under the receiver operating characteristic curve (AUC) reaching 0.9185.

Conclusion: This work utilized the interpretable WDD-based algorithms to construct T2DM diagnostic models based on physical examination indicators. By modeling data grouped by age and sex, we identified several predictive markers related to age and sex, uncovering characteristic differences among various groups of T2DM patients.

Keywords: diabetes; diabetes diagnosis; diabetic prediction; diagnostic indicator; health informatics; interpretable machine learning.


Conflict of interest statement

The authors declare that the research was conducted in the absence of any commercial or financial relationships that could be construed as a potential conflict of interest.

Figures

Figure 1
Figure 1
Overview of the study design. (A) The workflow of this work. (B) The first two steps in A, 11071 T2DM electronic health records (EHRs) and 126622 physical examination EHRs were collected. After preprocessing, 16004 EHRs were selected to build models for T2DM prediction. (C) The last two steps in A and the basic principle of the weighted diversity density method.
Figure 2
Figure 2
Flowchart of inclusion and exclusion criteria for the study populations of patients with type 2 diabetes mellitus (T2DM) and the physical examination population. We only use the first electronic health records for each patient in the hospital system.
Figure 3
Figure 3
Model interpretability reflected by model scores. (A-C) Scatter-density heat maps of model score versus blood glucose of 3 models trained by whole PEI dataset. (D-F) Histograms of model score distribution of 3 models using whole PEI dataset. (G-I) The raincloud plots of distance scores ( Distk ) of the three models using the whole PEI dataset.
Figure 4
Figure 4
Important feature weights from different algorithms and datasets. Heat map based on the normalized feature weight values. The summation of a column (an algorithm) is 1. Darker colors represent larger weight values. The top 25% features in every column are framed by black rectangle.
Figure 5
Figure 5
Model performance of 10-fold cross validation and feature importance in different age and sex groups. (A) The AUC values of the three algorithms when modeling male, female and both sexes of different ages. Error bars were generated by 10-fold cross validation (error bar represents standard deviation). (B) The AUC values of the three algorithms when modeling male and female of all ages. (C) Heat map of normalized feature weight values extracted from the model for male and female of different ages, ‘M’ represents male, ‘F’ represents female.
Figure 6
Figure 6
Distribution of GFR values in different groups. (A) Different age and sex groups. (B) Different age groups. (C) Different sex groups. All the GFR values were from origin EHRs.

Similar articles

Cited by

References

    1. Donath MY, Shoelson SE. Type 2 diabetes as an inflammatory disease. Nat Rev Immunol. (2011) 11:98–107. doi: 10.1038/nri2925 - DOI - PubMed
    1. Wong TY, Cheung CMG, Larsen M, Sharma DO, Simó R. Diabetic retinopathy. Nat Rev Dis Primers. (2016) 2:1–17. doi: 10.1038/nrdp.2016.12 - DOI - PubMed
    1. Matheus AS de M, Tannus LRM, Cobas RA, Palma CCS, Negrato CA, Gomes M de B. Impact of diabetes on cardiovascular disease: an update. Int J hypertension. (2013) 2013 :653789. doi: 10.1155/2013/653789 - DOI - PMC - PubMed
    1. Carson AP, Muntner P, Kissela BM, Kleindorfer DO, Howard VJ, Meschia JF, et al. . Association of prediabetes and diabetes with stroke symptoms: the REasons for Geographic and Racial Differences in Stroke (REGARDS) study. Diabetes Care. (2012) 35:1845–52. doi: 10.2337/dc11-2140 - DOI - PMC - PubMed
    1. Rathur HM, Boulton AJ. The neuropathic diabetic foot. Nat Rev Endocrinol. (2007) 3:14–25. doi: 10.1038/ncpendmet0347 - DOI - PubMed