

This is a preprint.
Deep Few-view High-resolution Photon-counting Extremity CT at Halved Dose for a Clinical Trial
- PMID: 38562444
- PMCID: PMC10984006
Deep Few-view High-resolution Photon-counting Extremity CT at Halved Dose for a Clinical Trial
Abstract
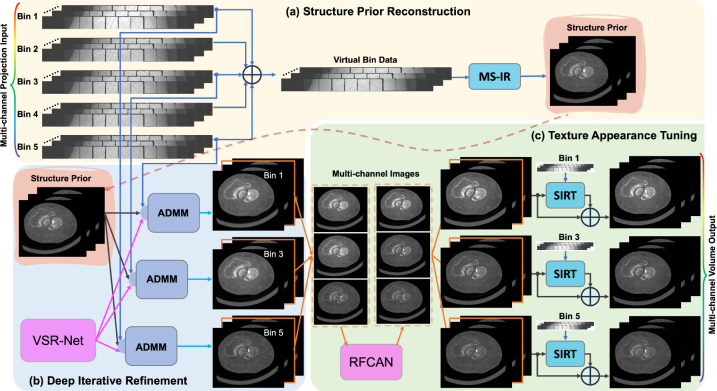
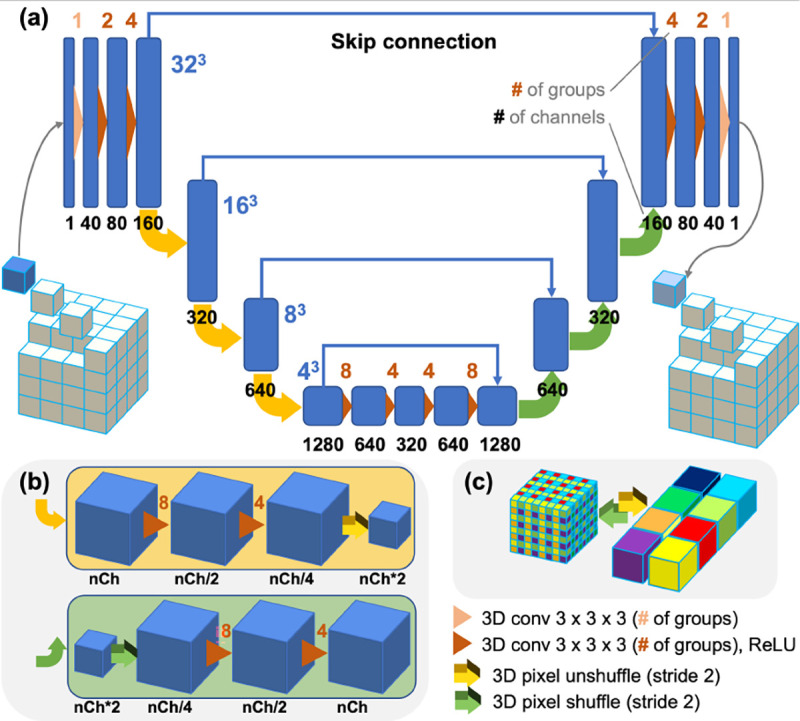
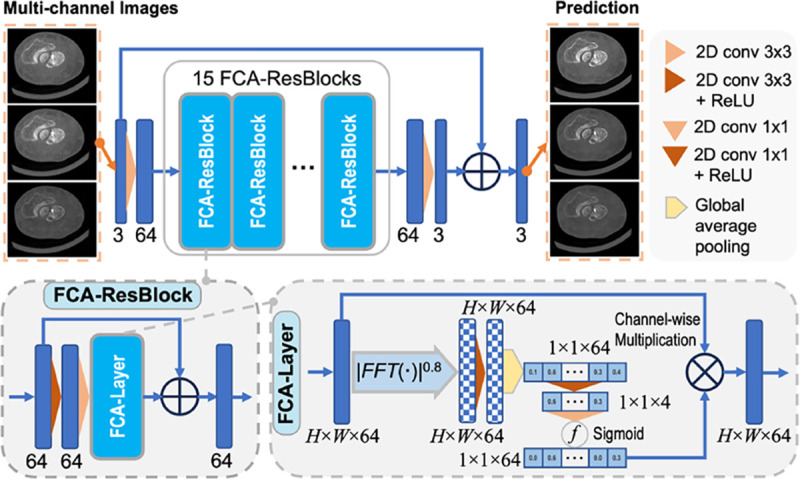
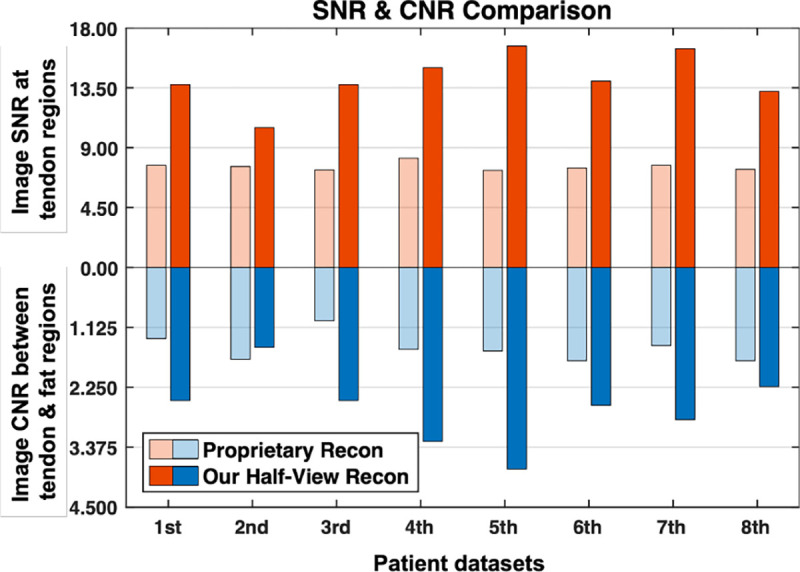
The latest X-ray photon-counting computed tomography (PCCT) for extremity allows multi-energy high-resolution (HR) imaging for tissue characterization and material decomposition. However, both radiation dose and imaging speed need improvement for contrast-enhanced and other studies. Despite the success of deep learning methods for 2D few-view reconstruction, applying them to HR volumetric reconstruction of extremity scans for clinical diagnosis has been limited due to GPU memory constraints, training data scarcity, and domain gap issues. In this paper, we propose a deep learning-based approach for PCCT image reconstruction at halved dose and doubled speed in a New Zealand clinical trial. Particularly, we present a patch-based volumetric refinement network to alleviate the GPU memory limitation, train network with synthetic data, and use model-based iterative refinement to bridge the gap between synthetic and real-world data. The simulation and phantom experiments demonstrate consistently improved results under different acquisition conditions on both in- and off-domain structures using a fixed network. The image quality of 8 patients from the clinical trial are evaluated by three radiologists in comparison with the standard image reconstruction with a full-view dataset. It is shown that our proposed approach is essentially identical to or better than the clinical benchmark in terms of diagnostic image quality scores. Our approach has a great potential to improve the safety and efficiency of PCCT without compromising image quality.
Keywords: Photon-counting CT; clinical trial; deep learning; dose reduction; few-view reconstruction; high resolution.
Figures


Similar articles
-
Patch-based dual-domain photon-counting CT data correction with residual-based WGAN-ViT.Phys Med Biol. 2025 Feb 6;70(4):045008. doi: 10.1088/1361-6560/adaf71. Phys Med Biol. 2025. PMID: 39874670 Free PMC article.
-
Thin slice photon-counting CT coronary angiography compared to conventional CT: Objective image quality and clinical radiation dose assessment.Med Phys. 2024 Apr;51(4):2924-2932. doi: 10.1002/mp.16992. Epub 2024 Feb 15. Med Phys. 2024. PMID: 38358113
-
Low-dose high-resolution chest CT in adults with cystic fibrosis: intraindividual comparison between photon-counting and energy-integrating detector CT.Eur Radiol Exp. 2024 Sep 19;8(1):105. doi: 10.1186/s41747-024-00502-9. Eur Radiol Exp. 2024. PMID: 39298080 Free PMC article.
-
Photon-Counting Computed Tomography - Basic Principles, Potenzial Benefits, and Initial Clinical Experience.Rofo. 2023 Aug;195(8):691-698. doi: 10.1055/a-2018-3396. Epub 2023 Mar 2. Rofo. 2023. PMID: 36863367 Review. English.
-
Potential Benefits of Photon-Counting CT in Dental Imaging: A Narrative Review.J Clin Med. 2024 Apr 22;13(8):2436. doi: 10.3390/jcm13082436. J Clin Med. 2024. PMID: 38673712 Free PMC article. Review.
References
-
- Joyce S., O’Connor O. J., Maher M. M., and McEntee M. F., “Strategies for dose reduction with specific clinical indications during computed tomography,” Radiography, vol. 26, pp. S62–S68, 2020. - PubMed
-
- Söderberg M. and Gunnarsson M., “Automatic exposure control in computed tomography–an evaluation of systems from different manufacturers,” Acta Radiol., vol. 51, no. 6, pp. 625–634, 2010. - PubMed
-
- Muhammad N., Karim M., Harun H., Rahman M., Azlan R., and Sumardi N., “The impact of tube current and iterative reconstruction algorithm on dose and image quality of infant ct head examination,” Radiat. Phys. Chem., p. 110272, 2022.
-
- Willemink M. J., Persson M., Pourmorteza A., Pelc N. J., and Fleischmann D., “Photon-counting ct: technical principles and clinical prospects,” Radiology, vol. 289, no. 2, pp. 293–312, 2018. - PubMed
-
- Benjaminov O., Perlow E., Romman Z., Levinson R., Bashara B., Cohen M. et al., “Novel, energy-discriminating photon counting CT system (EDCT): first clinical evaluation—CT angiography: Carotid artery stenosis,” presented at the Radiol. Soc. North Amer. 2008 Sci. Assem. Annu. Meeting, Chicago, IL, USA, 2 2008.
Publication types
Grants and funding
LinkOut - more resources
Full Text Sources
Miscellaneous