. 2024 Mar 11;27(4):109463.
doi: 10.1016/j.isci.2024.109463. eCollection 2024 Apr 19.

Oleuropein activates autophagy to circumvent anti-plasmodial defense

Affiliations

Oleuropein activates autophagy to circumvent anti-plasmodial defense

Praveen Sharma et al. iScience. .

Abstract

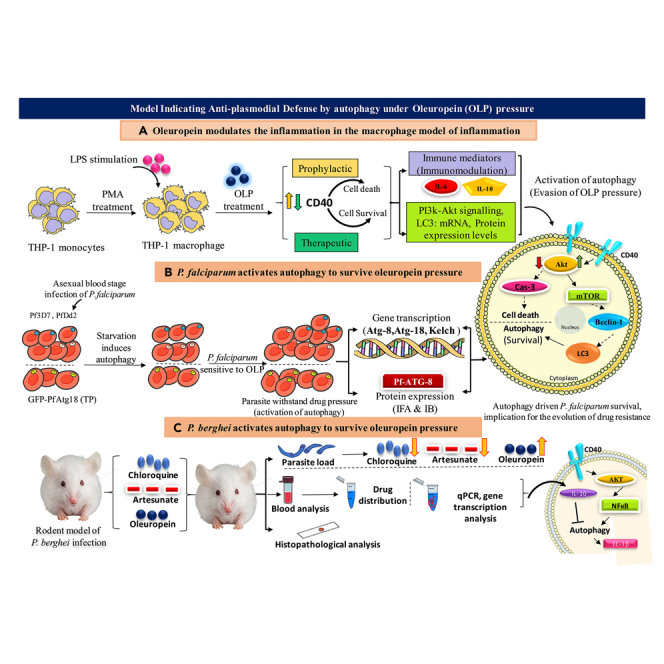
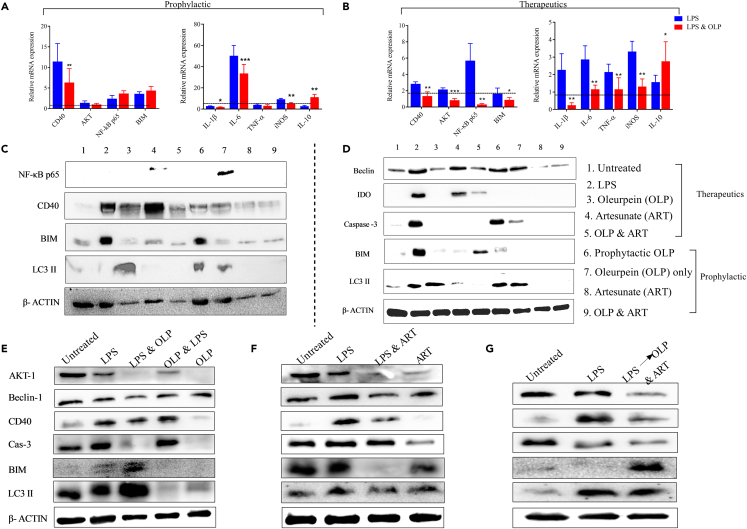
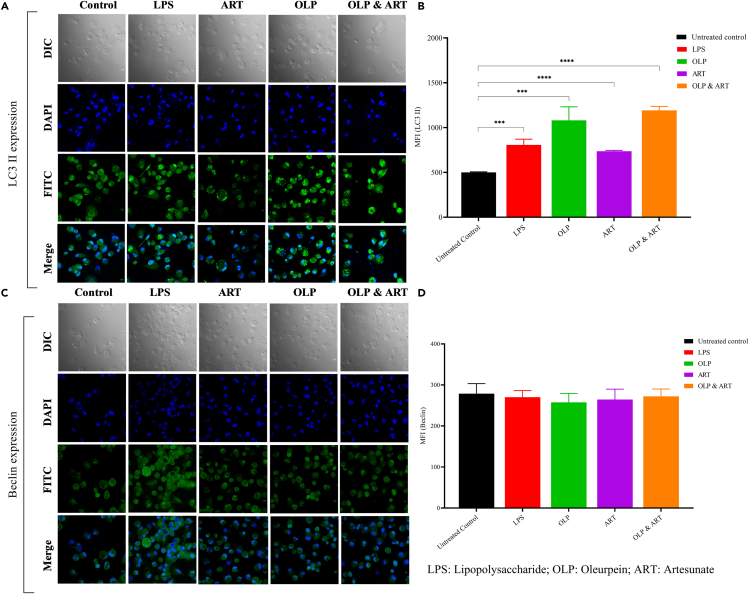
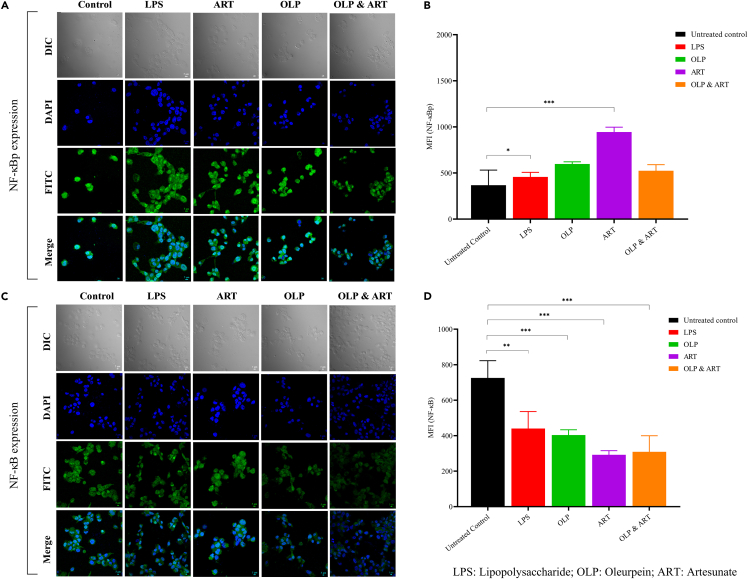
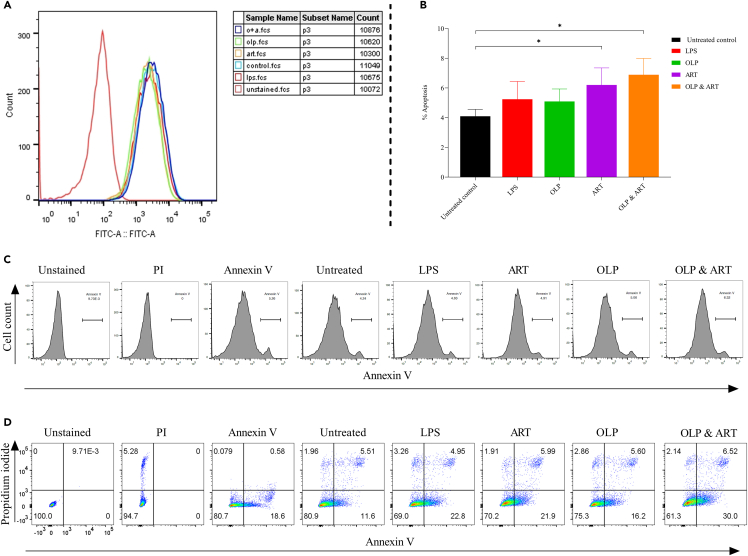
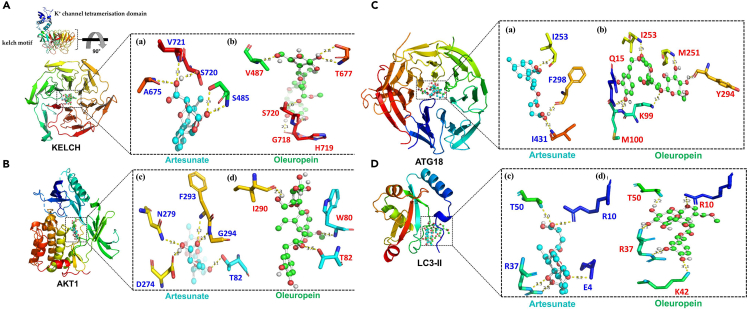
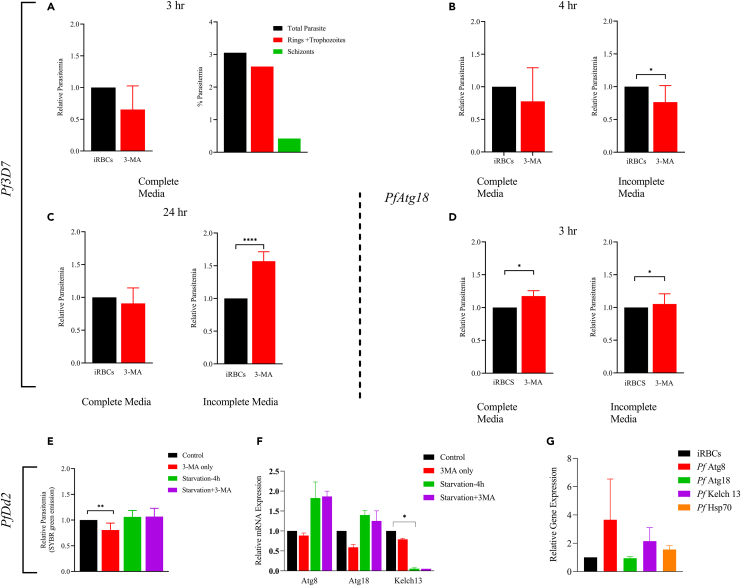
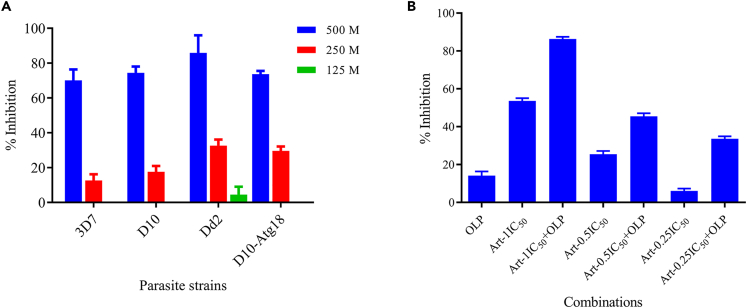
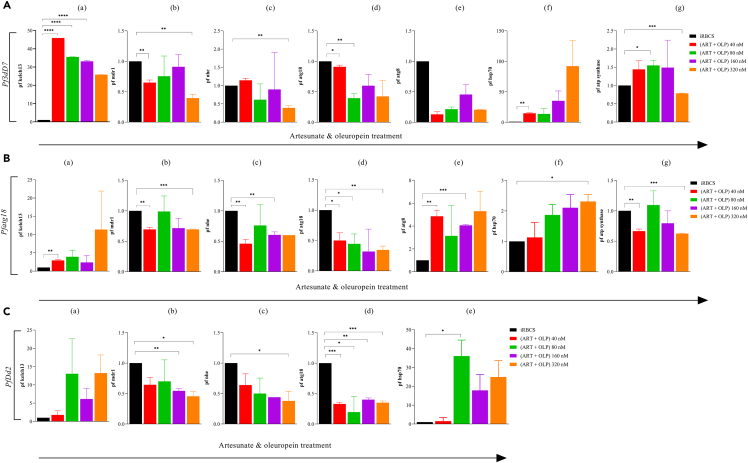
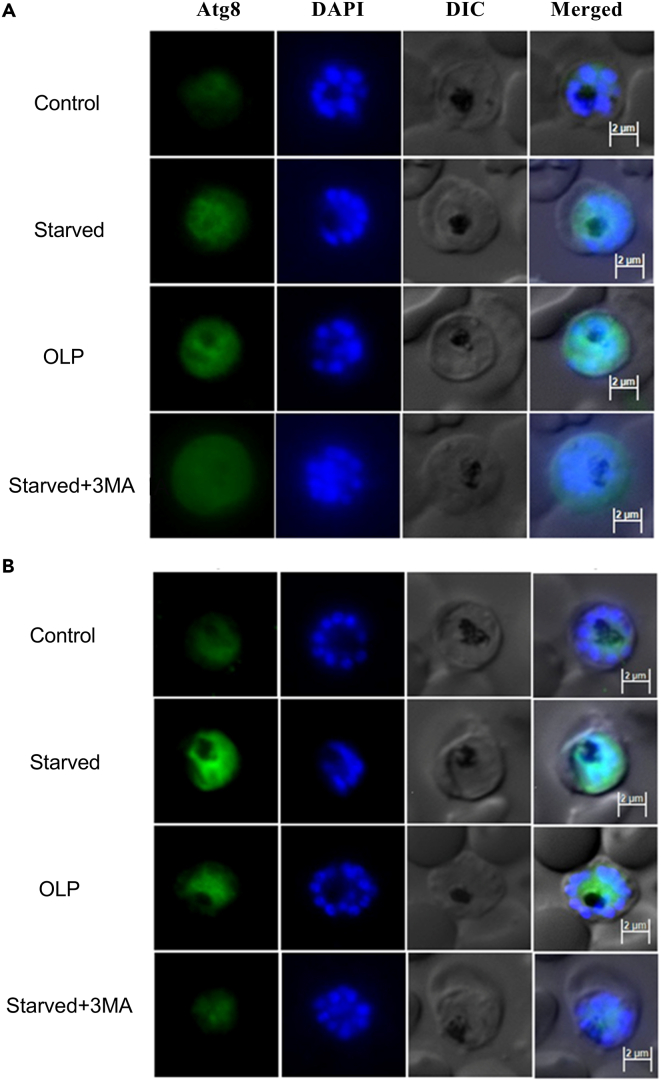
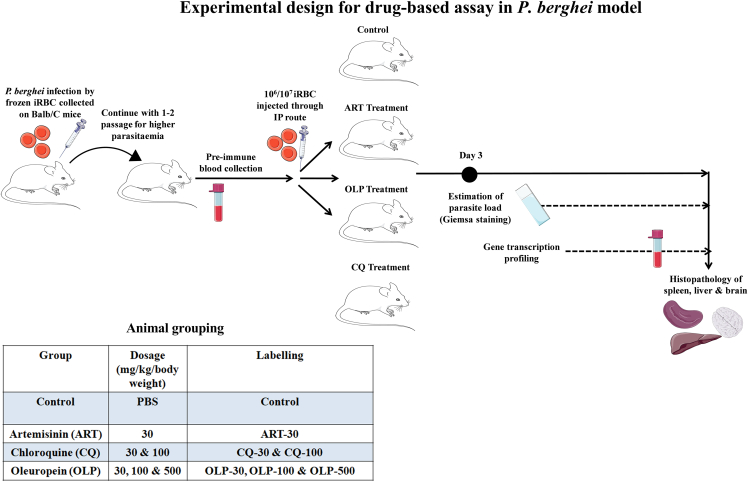
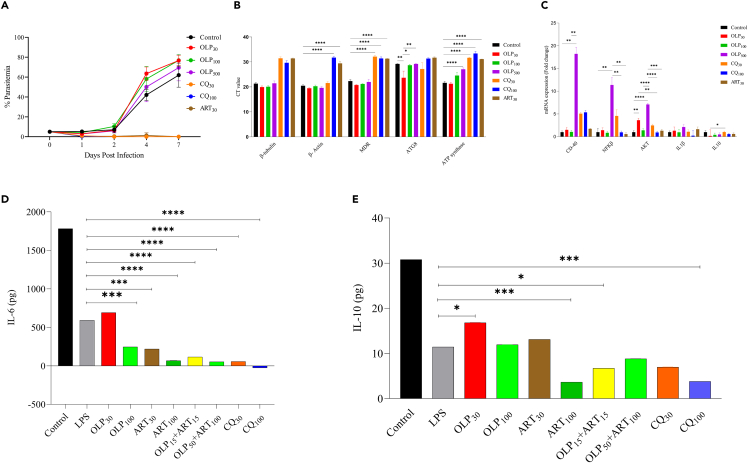
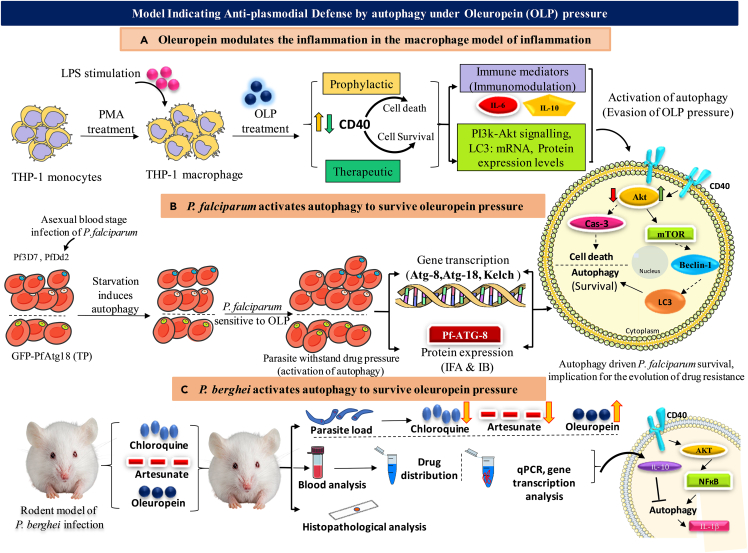
Antimalarial drug resistance and unavailability of effective vaccine warrant for newer drugs and drug targets. Hence, anti-inflammatory activity of phyto-compound (oleuropein; OLP) was determined in antigen (LPS)-stimulated human THP-1 macrophages (macrophage model of inflammation; MMI). Reduction in the inflammation was controlled by the PI3K-Akt1 signaling to establish the "immune-homeostasis." Also, OLP treatment influenced the cell death/autophagy axis leading to the modulated inflammation for extended cell survival. The findings with MII prompted us to detect the antimalarial activity of OLP in the wild type (3D7), D10-expressing GFP-Atg18 parasite, and chloroquine-resistant (Dd2) parasite. OLP did not show the parasite inhibition in the routine in vitro culture of P. falciparum whereas OLP increased the antimalarial activity of artesunate. The molecular docking of autophagy-related proteins, investigations with MMI, and parasite inhibition assays indicated that the host activated the autophagy to survive OLP pressure. The challenge model of P. berghei infection showed to induce autophagy for circumventing anti-plasmodial defenses.

Keywords: Drug delivery system; Health sciences.


Conflict of interest statement

The authors declare no competing interests.

Figures

None
Graphical abstract
Figure 1
Figure 1
Determination of immune/signaling mediators in the macrophage model of inflammation (MMI) (antigen [LPS; 1 μg/mL]-stimulated human macrophages). (A and B) The human THP-1 monocytes were differentiated to THP-1 macrophages by PMA (100 ng/mL) treatment. Quantification of relative mRNA expression of signaling (CD40, Akt, NF-κB, Bim) (left panel) and inflammatory (IL-1β, IL-6, TNFα, iNOS, IL-10) (right panel) markers in OLP (30 μg/mL)-treated macrophages in (A) prophylactic and (B) therapeutic mode of drug treatment. The protein expression of NF-κB, CD40, Bim, LC3II, IDO1, Beclin-1, caspase-3, and LC3 II was assessed in the OLP- and ART (30 μg/mL)-treated macrophages in both the therapeutic and prophylactic mode of drug treatment (C, D, E, F, G). (D) Lane 6: prophylactic OLP treatment, Lane 7: OLP treatment. The individual (OLP, ART)- and combination of drugs (OLP & ART)-treated cells were lysed, and proteins were detected by the immunoblotting. The β-actin served as a loading control, and data represent three independent experiments (n = 3) (∗∗∗p < 0.001; highly significant, ∗∗p < 0.01; moderately significant, ∗p < 0.1 significant).
Figure 2
Figure 2
Expression of autophagy-related protein markers by the confocal microscopy-based immunofluorescence assay (A) Qualitative and (B) quantitative (mean fluorescence intensity; MFI) expression of LC3 II in the individual (OLP, ART)- and combination of drugs (OLP & ART)-treated and antigen-stimulated macrophages. The qualitative expression of (C) Beclin-1/surviving protein was observed to determine the drug-induced autophagy in the macrophages. Beclin-1 binds phosphatidylinositol 3-kinase (PI3KC3) to form a core PI3KC3 complex that mediates multiple vesicle-trafficking processes to regulate the autophagy. (D) Quantification (MFI) of Beclin-1 expression did not show any difference with individual and combination drug treatment. The data represent three independent experiments (n = 3). (∗∗∗∗p < 0.0001, highly significant; ∗∗∗p < 0.001, significant).
Figure 3
Figure 3
Drug treatment influences the cell death/autophagy axis and controls the death of macrophages receiving stimulus with antigen (A–D) Cell death is regulated by the nuclear transcription factor (NF-κBp65 & NF-κB); (A) qualitative and (B) quantitative (MFI) expression of NF-κBp65 in the individual (OLP, ART)- and combination of drugs (OLP & ART)-treated and antigen-stimulated macrophages. The expression of un-phosphorylated NF-κB was determined (C) qualitatively and (D) quantitatively (MFI). The reduced NF-κB expression leads to the reduced cell death and promotes autophagy. NF-κB gets dissociated from its inhibitor (Ikβ) and regulates FOXO1 in the nucleus. The latter controls the expression of Bim., Death of the antigen stimulated macrophages by binding the phosphatidylinositol 3-kinase (PI3KC3) to form a core PI3KC3 complex that mediates the multiple vesicle-trafficking processes and regulates the autophagy complex. The data represent three independent experiments (n = 3) (∗∗∗p < 0.001, highly significant; ∗∗p < 0.01, significant; ∗p < 0.1, moderately significant).
Figure 4
Figure 4
Oleuropein mediates the survival of the antigen-stimulated human macrophages (A and B) Cells receiving treatment with individual (OLP, ART) and combination of drugs (OLP & ART) to assess (A) reactive oxygen species (ROS) production and (B) detection of % cell death of LPS-stimulated macrophages by the fluorescently labeled Annexin V staining. 7-aminoactinomycine (7-AAD) or propidium iodide (PI) staining by the C6 Accuri flow cytometer (∗p < 0.05 [significant]). (C) Histogram of Annexin V and FITC/PI flow cytometry to confirm the cell death of treated and untreated cells. (D) The scatterplots of annexin V-FITC/PI-stained cells treated with drug (OLP, ART) individually as well in combination. The data represent three independent experiments (n = 3).
Figure 5
Figure 5
Binding affinity-based molecular docking analysis to confirm the expression of autophagy-related protein (ARP) upon the drug-protein interaction The interaction of ART and OLP with the development (A) (Kelch13) (a, b) and cell death/survival (B) (AKT1) (c, d) protein markers. Black box is magnified to show the interaction of the amino acid residues with ART and OLP. ART (cyan) and OLP (green) shared the similar binding region with both the proteins (AKT1, KELCH) (shown in the ball and sticks). The yellow dotted line represents the formation of the hydrogen bond among the selected residues to the corresponding ligands/drugs. Molecular docking interaction with P. falciparum-specific (C) (PfATG18) (a, b) and autophagy-related protein (D) (LC3 II) (c, d). Black box is magnified to show the amino acid residues showing interaction with ART and OLP. ART (cyan) and OLP (green) shared the similar binding region with both the proteins (ATG18 and LC3II) (shown in the ball and sticks). The yellow dotted line represents the formation of the hydrogen bond among the selected residues with the corresponding drugs.
Figure 6
Figure 6
Activation of autophagy in response to starvation and drug pressure (A–C) The asexual BS infection of 3D7P. falciparum was cultivated in the complete (with Albumax) and incomplete (without Albumax) medium for 3 h (A), 4 h (B), and 24 h (C). Parasite cultured in incomplete medium was treated with 3-MA (3 mM), and infectious parasite load (relative parasitemia) was determined by the SYBR green emission assay. (D) Quantification of parasite load of D10 parasite expressing GFP-Atg18 line of P. falciparum cultivated in the complete and incomplete medium for 3 h and treated with 3-MA. Confirmation of autophagy in chloroquine-resistant (Dd2) P. falciparum under physiological stress. (E) Quantification of parasite load in the starved (3 h) parasite followed by the 3-MA treatment. (F) Quantification of the relative gene expression (fold change regulation) of the autophagy and tolerance markers (Atg8, Atg18, Kelch13) by the RT-PCR in the starved (4 h) Dd2 parasite. (G) Expression profiling of Atg8, Atg18, Kelch13, and Hsp70 in the Dd2 P. falciparum by RT-PCR. (∗p < 0.05 [significant], ∗∗p < 0.01 [moderately significant], and ∗∗∗∗p < 0.0001 [highly significant]). Data represent two independent experiments in triplicates (n = 2).
Figure 7
Figure 7
Effect of OLP and combination of OLP and artemisinin on parasite development (A) P. falciparum 3D7, Dd2, D10, and D10-Atg18 strains were cultured in presence of indicated compounds for 96 h. Each bar shows mean % inhibition with SD error bar at the indicated OLP concentration from three experiments, each with two replicates. (B) P. falciparum 3D7 were cultured in the presence of artemisinin, OLP, or artemisinin-OLP combination for 50 h. Each bar shows mean % inhibition with SD error bar at different concentration of indicated compounds or artemisinin-OLP combination from three experiments, each with two replicates.
Figure 8
Figure 8
Determination of gene expression profiling of growth (Kelch13, Atp synthase), resistance/tolerance (mdr1, nhe), and autophagy (Atg8, Atg18) markers under drug pressure by RT-PCR (A–C) The laboratory strains (A) 3D7 and (B) D10 parasite expressing GFP-Atg18 line and (C) chloroquine-resistant (Dd2) of P. falciparum were treated with the combination of drugs (OLP & ART) at 40, 80, 160, and 320 nM concentrations. iRBCs were taken as an experimental/negative control. The data represent two independent experiments in triplicates (n = 2). (∗p < 0.05 [significant], ∗∗p < 0.01 [moderately significant], and ∗∗∗p < 0.001 [highly significant]).
Figure 9
Figure 9
Atg8 expression in P. falciparum (A and B) Synchronized late trophozoite stages P. falciparum 3D7 (A) and P. falciparum D10-Atg18 (B) parasites were cultured in complete medium (control), Albumax-deficient medium (Starved), and complete medium with OLP or Albumax-deficient medium with 3-MA for 3 h. The parasites were processed for Atg8 expression using anti-Atg8 antibodies. The panels are for Atg8 expression (Atg8), nucleic acid stain (DAPI), bright field (DIC), and the overlap of all three images (Merged). Scale bar has been shown in the merged panel.
Scheme 1
Scheme 1
Experimental design for drug-based assays in the challenge model of P berghei infection
Figure 10
Figure 10
Infectious challenge model of P. berghei infection in the BALB/c mice to confirm activation of autophagy under OLP pressure (A) The parasite load (% parasitemia) was determined by the Giemsa-stained thin blood smears drawn from the experimental mice receiving treatment with OLP (30, 100, 500 mg/kg), CQ (30, 100 mg/kg), and ART (30 mg/kg). (B) Determination of the expression (cT value) of autophagy and development markers of pathogen (P. berghei) (mdr, atg8, Atp synthase) by RT-PCR on the mRNA isolated from blood samples collected on the experimental mice on day 10 post-infection (day 5 post drug treatment). (C) The relative mRNA expression (fold change regulation) of signaling (CD40, NF-κBp50, Akt1) and inflammatory (IL-1β, IL-10) markers of the host (Balb/C mice). The reduction in the chronic inflammation induced by the LPS (1 μg/mL)-stimulated human macrophages following the OLP treatment was measured by ELISA. (D and E) The expression of (D) pro-inflammatory (IL-6) and (E) anti-inflammatory (IL-10) cytokines was quantified from the supernatant collected on the OLP-, ART-, and CQ-treated macrophages. Combination of OLP & ART was used at the 30 and 100 μg/ml. The data represent one independent experiment in triplicate (n = 1). (∗p < 0.05 [significant], ∗∗p < 0.01 [moderately significant], ∗∗∗p < 0.001 [highly significant], ∗∗∗∗p < 0.0001 [extremely significant]).
Figure 11
Figure 11
Model indicating the activation of immune response evasion mechanism (autophagy) by the oleuropein (OLP) treatment in the antigen (LPS)-stimulated human macrophages Antimalarial activity of OLP in the routine culture of P. falciparum (3D7, D10-Atg18, Dd2) and confirmation of the elicitation of the anti-plasmodial defenses driven by autophagy. (A) Development of LPS-stimulated human THP-1 macrophages (macrophage model of inflammation; MMI) to determine modulation of inflammation controlled by the PI3K-Akt1 signaling to establish the immune homeostasis. OLP treatment circumvents the death of the antigen stimulated macrophages. (B) Antimalarial activity of OLP in 3D7, D10 parasite expressing GFP-Atg18 line, chloroquine-resistant (Dd2) P. falciparum. Gene transcription and protein level expression, autophagy, and development-related proteins (ARP/DRP) to confirm the inhibited death of the antigen-stimulated macrophages regulated by the Akt1-mediated signaling. (C) Developed challenge model of P. berghei infection to validate the in vitro findings showing the induction of autophagy under OLP pressure.

Similar articles

Cited by

References

    1. Weiland A.S. Recent Advances in Imported Malaria Pathogenesis, Diagnosis, and Management. Curr. Emerg. Hosp. Med. Rep. 2023;11:49–57. doi: 10.1007/s40138-023-00264-5. - DOI - PMC - PubMed
    1. Yu L., Chen Y., Tooze S.A. Autophagy pathway: Cellular and molecular mechanisms. Autophagy. 2018;14:207–215. doi: 10.1080/15548627.2017.1378838. - DOI - PMC - PubMed
    1. Ghartey-Kwansah G., Adu-Nti F., Aboagye B., Ankobil A., Essuman E.E., Opoku Y.K., Abokyi S., Abu E.K., Boampong J.N. Autophagy in the control and pathogenesis of parasitic infections. Cell Biosci. 2020;10:101. doi: 10.1186/s13578-020-00464-6. - DOI - PMC - PubMed
    1. Ghosh D., Walton J.L., Roepe P.D., Sinai A.P. Autophagy is a cell death mechanism in Toxoplasma gondii. Cell Microbiol. 2012;14:589–607. doi: 10.1111/j.1462-5822.2011.01745.x. - DOI - PMC - PubMed
    1. Cirmi S., Maugeri A., Russo C., Musumeci L., Navarra M., Lombardo G.E. Oleacein Attenuates Lipopolysaccharide-Induced Inflammation in THP-1-Derived Macrophages by the Inhibition of TLR4/MyD88/NF-kappaB Pathway. Int. J. Mol. Sci. 2022;23 doi: 10.3390/ijms23031206. - DOI - PMC - PubMed

LinkOut - more resources