. 2024 Mar 25;11(2):100113.
doi: 10.1016/j.acpath.2024.100113. eCollection 2024 Apr-Jun.

Intra- and post-pandemic impact of the COVID-19 outbreak on Stanford Health Care

Affiliations

Intra- and post-pandemic impact of the COVID-19 outbreak on Stanford Health Care

Thanaphong Phongpreecha et al. Acad Pathol. .

Abstract

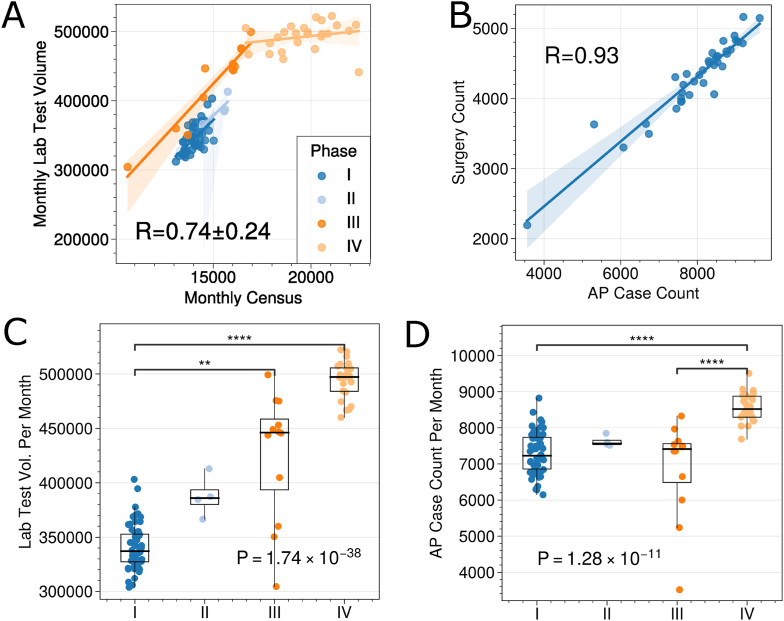
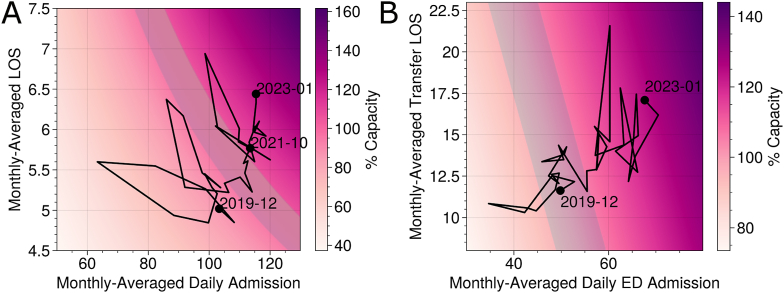
Stanford Health Care, which provides about 7% of overall healthcare to approximately 9 million people in the San Francisco Bay Area, has undergone significant changes due to the opening of a second hospital in late 2019 and, more importantly, the COVID-19 pandemic. We examine the impact of these events on anatomic pathology (AP) cases, aiming to enhance operational efficiency in response to evolving healthcare demands. We extracted historical census, admission, lab tests, operation, and AP data since 2015. An approximately 45% increase in the volume of laboratory tests (P < 0.0001) and a 17% increase in AP cases (P < 0.0001) occurred post-pandemic. These increases were associated with progressively increasing (P < 0.0001) hospital census. Census increase stemmed from higher admission through the emergency department (ED), and longer lengths of stay mostly for transfer patients, likely due to the greater capability of the new ED and changes in regional and local practice patterns post-pandemic. Higher census led to overcapacity, which has an inverted U relationship that peaked at 103% capacity for AP cases and 114% capacity for laboratory tests. Overcapacity led to a lower capability to perform clinical activities, particularly those related to surgical procedures. We conclude by suggesting parameters for optimal operations in the post-pandemic era.

Keywords: Anatomic pathology; Hospital admission; Hospital census; Overcapacity; Surgery capability.


Conflict of interest statement

The authors declare no competing interests.

Figures

Fig. 1
Fig. 1
Overview of the study. Monthly anatomical pathology (AP) case counts and laboratory test numbers are plotted over time. During COVID-19, the trend changed when the increase in laboratory test volume became greater. This suggests lower surgical operations and this study aims to study effects from potential sources of changes, including census, length of stay, and admission, and then optimize these parameters for maximizing AP cases.
Fig. 2
Fig. 2
Overview of the hospital activity during different phases. (A) Monthly census and laboratory test volume showed strong correlations in each phase supporting this as a dynamic measure of overall clinical activity. (B) The number of AP cases and surgery count showed a high correlation validating AP case count as a surrogate for surgery count. (C) One-way ANOVA of laboratory test volumes across phases (P < 0.0001) with corrected (Dunn's multiple comparisons) pairwise comparisons. (D) AP case counts across phases. One-way ANOVA of AP counts across phases (P < 0.0001) with corrected (Dunn's multiple comparisons) pairwise comparisons. ∗∗P < 0.01 and ∗∗∗∗P < 0.0001.
Fig. 3
Fig. 3
Increased admission and census over time, and their potential drivers. (A) Monthly census and admissions over time show the increase mostly stemmed from the increase in emergency department (ED) admissions. (B) There were multiple significant increases in the census from different admission sources across the phases (Two-way ANOVA P < 0.0001, Tukey's corrected pairwise comparisons), but ED had the greatest increase. (C) Similar to (B), the increase in admission was significant for the ED only (D) Average length of stay (LOS) plotted by month over Phases II to IV. (E) Two-way ANOVA with Tukey's corrected pairwise comparisons showed a significant increase in LOS for ED patients and, to a larger extent, transfer patients. (F) The % contribution from total admission and length of stay on census from its average in Phase I. (G) Two-way ANOVA with Tukey's corrected pairwise comparisons showed a significant increase in the contribution of admission and LOS on the increase of census relative to Phase I. (H) The percent variance explained in lab test volume and AP cases during Phase IV by LOS and admission. ∗P < 0.05, ∗∗P < 0.01, and ∗∗∗P < 0.001.
Fig. 4
Fig. 4
Capacity. (A) Estimate of % capacity plotted by month across the four phases. (B) The effect of capacity on clinical laboratory tests and AP case counts. The dashed black lines indicate the point where % capacity reaches the maximum for AP cases and then the laboratory test number.
Fig. 5
Fig. 5
Heatmaps showing the effects of LOS and admission on capacity. (A) The impact of monthly-averaged LOS and admission on capacity. The gray color zone depicts 95 to 105% capacity as calculated by the daily census divided by the number of licensed beds. The black line represents the trajectory of Stanford Hospital from Phases II to IV. (B) The impact of monthly-averaged LOS from transfer patients and monthly-averaged ED admissions on capacity. LOS and admission from other sources were kept constant using their average.

References

    1. Stanford Health Care Officially Opens Doors to New Stanford Hospital. News Center. http://med.stanford.edu/news/all-news/2019/11/stanford-health-care-offic... Published November 4, 2019.
    1. Seabold S., Perktold J. Statsmodels: econometric and statistical modeling with python. Proc 9th Python Sci Conf. 2010;57(61)
    1. Terpilowski M.A. Scikit-posthocs: pairwise multiple comparison tests in Python. J Open Source Softw. 2019;4(36):1169. doi: 10.21105/joss.01169. - DOI
    1. Swift M.L. GraphPad prism, data analysis, and scientific graphing. J Chem Inf Comput Sci. 1997;37(2):411–412. doi: 10.1021/ci960402j. - DOI
    1. McPhillips D. Hospitals in the US Are the Fullest They’ve Been throughout the Pandemic -- but It's Not Just Covid. CNN. https://www.cnn.com/2022/12/08/health/hospitals-full-not-just-covid/inde... Published December 8, 2022.

LinkOut - more resources