[Preprint]. 2025 Feb 28:2024.03.14.585103.
doi: 10.1101/2024.03.14.585103.

Atomically accurate de novo design of antibodies with RFdiffusion

Affiliations

Atomically accurate de novo design of antibodies with RFdiffusion

Nathaniel R Bennett et al. bioRxiv. .

Abstract

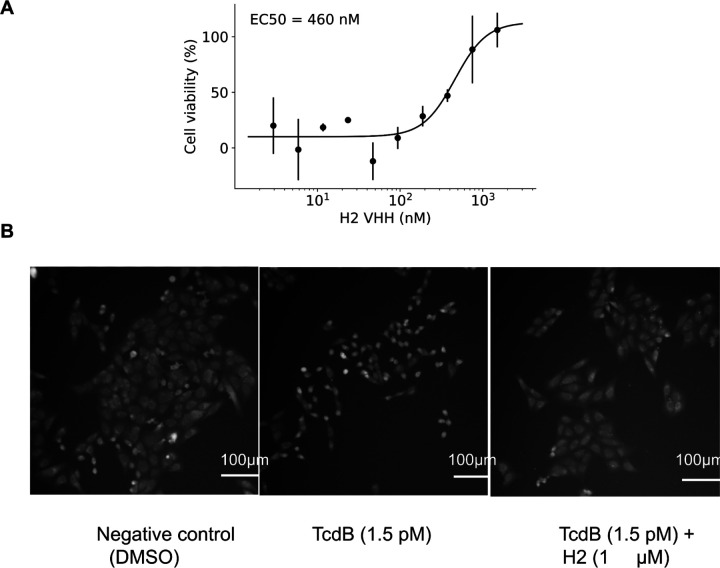
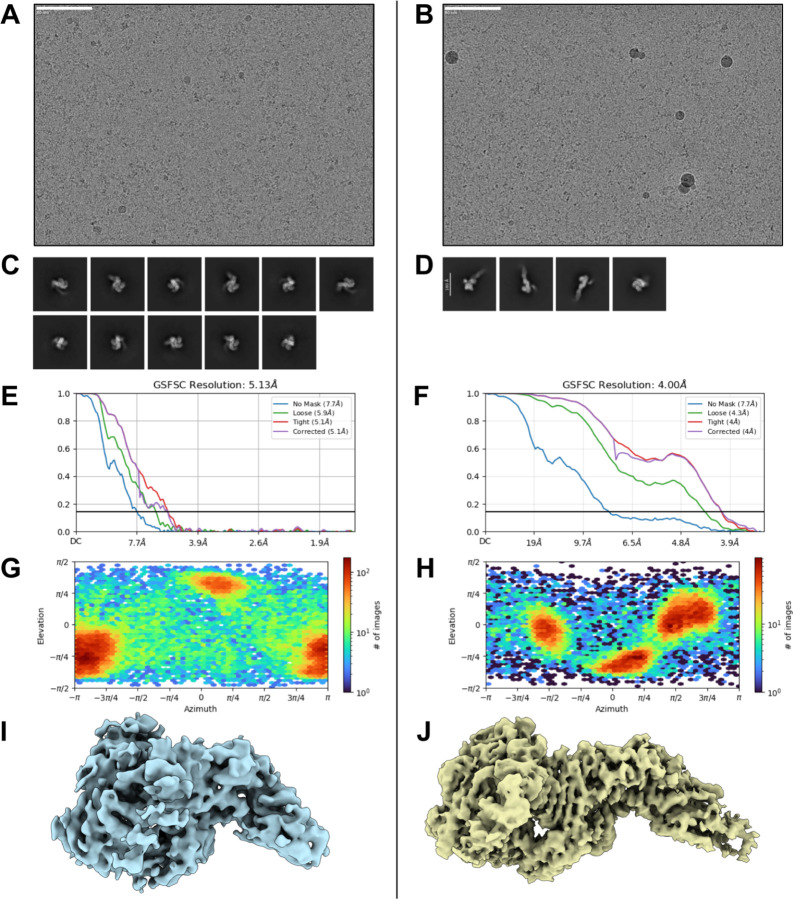
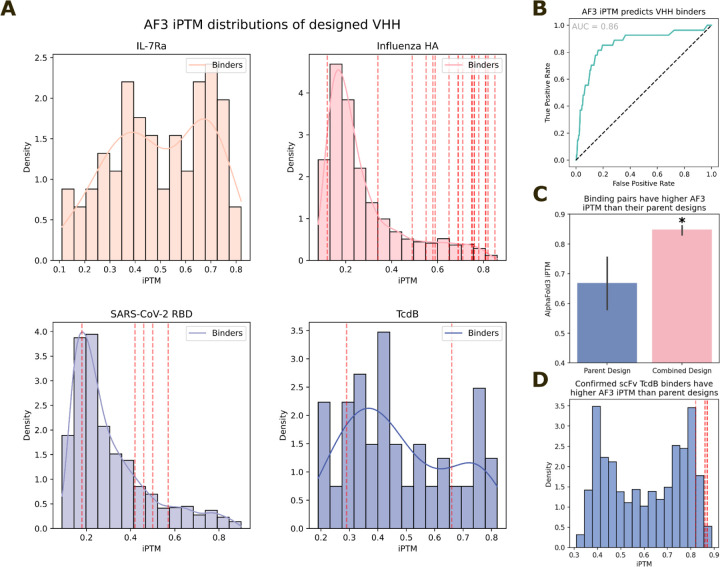
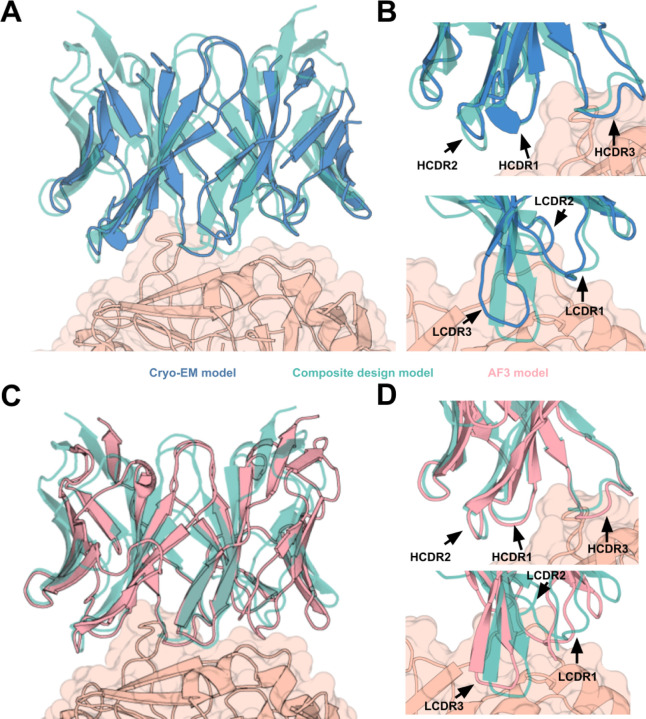
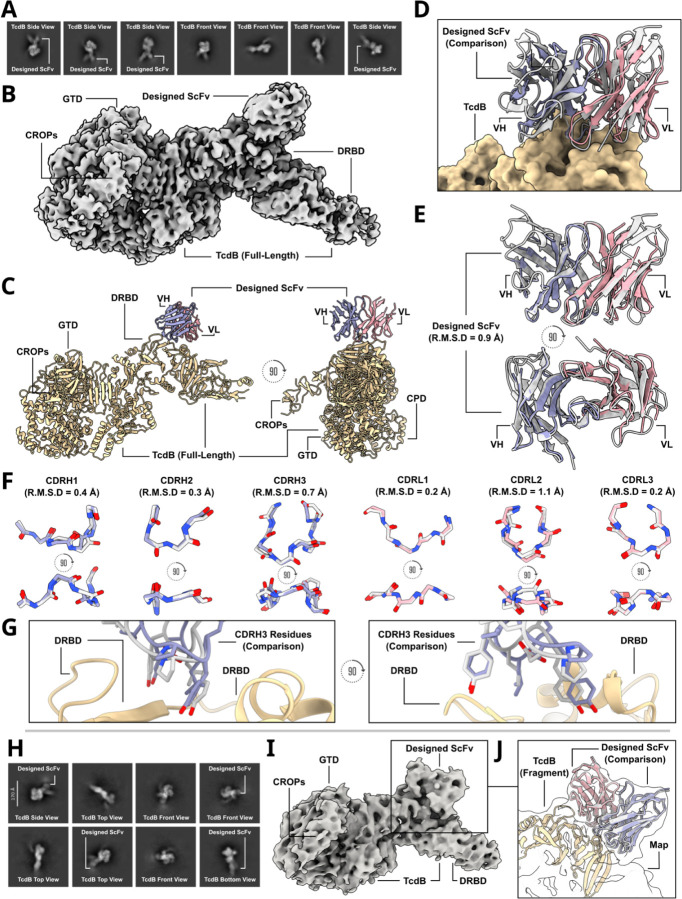
Despite the central role that antibodies play in modern medicine, there is currently no method to design novel antibodies that bind a specific epitope entirely in silico. Instead, antibody discovery currently relies on animal immunization or random library screening approaches. Here, we demonstrate that combining computational protein design using a fine-tuned RFdiffusion network alongside yeast display screening enables the generation of antibody variable heavy chains (VHHs) and single chain variable fragments (scFvs) that bind user-specified epitopes with atomic-level precision. To verify this, we experimentally characterized VHH binders to four disease-relevant epitopes using multiple orthogonal biophysical methods, including cryo-EM, which confirmed the proper Ig fold and binding pose of designed VHHs targeting influenza hemagglutinin and Clostridium difficile toxin B (TcdB). For the influenza-targeting VHH, high-resolution structural data further confirmed the accuracy of CDR loop conformations. While initial computational designs exhibit modest affinity, affinity maturation using OrthoRep enables production of single-digit nanomolar binders that maintain the intended epitope selectivity. We further demonstrate the de novo design of single-chain variable fragments (scFvs), creating binders to TcdB and a Phox2b peptide-MHC complex by combining designed heavy and light chain CDRs. Cryo-EM structural data confirmed the proper Ig fold and binding pose for two distinct TcdB scFvs, with high-resolution data for one design additionally verifying the atomically accurate conformations of all six CDR loops. Our approach establishes a framework for the rational computational design, screening, isolation, and characterization of fully de novo antibodies with atomic-level precision in both structure and epitope targeting.


Conflict of interest statement

Competing Interests N.R.B., J.L.W., R.J.R., A.J.B., C.W., P.J.Y.L., B.H., and D.B. are co-inventors on U.S. provisional patent number 63/607,651 which covers the computational antibody design pipeline described here. N.R.B., J.L.W, P.J.Y.L. and B.H. are currently employed by Xaira Therapeutics. N.R.B., J.L.W, P.J.Y.L., B.H., R.J.R, A.J.B., and C.W. have received payments relating to the licensing of the inventions described here to Xaira Therapeutics. C.C.L. is a co-founder of K2 Therapeutics, which uses OrthoRep in antibody engineering and evolution.

Figures

Extended Data Figure 1:
Fine-tuning is required for antibody design with RFdiffusion A) To test whether existing vanilla RFdiffusion models were capable of designing VHHs/scFvs, we explored means of providing the antibody template. For VHHs (left), we used RFdiffusion variant trained to condition on sequence alone and provided the VHH framework sequence (gray). This version, as compared to the fine-tuned version described in this work (pink), was significantly worse at recapitulating the native VHH framework structure. For scFvs (right), we additionally tried providing fold-level information into the appropriate vanilla RFdiffusion model (dark gray), but found that this was also insufficient to get accurate recapitulation of the scFv framework. Fine-tuning (pink) yields near-perfect recapitulation of the scFv framework structure. B) Although vanilla RFdiffusion is trained to respect “hotspots”, for VHHs (left) and scFvs (right) we find this to be less robust (grays) than after fine-tuning on antibody design (pink). C) Examples depicting the results of (A) and (B). In all cases, the “median” accuracy example (by framework recapitulation) is shown. Left to right: i) without fine-tuning, vanilla RFdiffusion does not target “hotspot” residues (orange) effectively, and does not recapitulate the VHH framework accurately (gray vs yellow). ii) After fine-tuning on antibody design, RFdiffusion targets “hotspots” with accurately recapitulated VHHs (pink vs yellow). iii) Providing only the scFv sequence, vanilla RFdiffusion does not target “hotspots” (orange) accurately nor accurately recapitulates the VHH framework (gray vs yellow). iv) Providing additional fold-level information is insufficient to get perfect framework recapitulation (dark gray vs yellow). v) After fine-tuning on antibody design, RFdiffusion can design scFvs with accurate framework structures (blue/pink vs gray) targeting the input “hotspots” (orange).
Extended Data Figure 2:
Fine-tuned RoseTTAFold2 can distinguish true complexes from decoy complexes A) An example antibody structure from the validation set used in this figure, which shares < 30% sequence similarity on the target (teal) to anything in the RoseTTAFold2 fine-tuning training dataset. B) Fine-tuned RoseTTAFold2 quite reliably predicts its own accuracy. Correlation between RF2 predicted aligned error (pAE) and RMSD to the native structure with 100% (left) or 10% (right) of “hotspot” residues provided. With pAE < 10, 80.3% of structures are within 2 Å when 100% of “hospots” are provided (along with the holo target structure), with this falling to 52.6% when only 10% of hotspots are provided. C-D) Cherry-picked example of RoseTTAFold2 correctly distinguishing a “true” from a “decoy” complex. The sequence of antibody 7Y1B was provided either with the correct (PDB ID: 7Y1B) or decoy (PDB ID: 8CAF) target. Both with 100% (C) or 10% (D) of “hotspots” provided, RF2 near-perfectly predicts binding (top row) or non-binding (bottom row). E) Quantification of the fine-tuned RF2’s ability to distinguish true targets from decoy targets with both pAE (top row) and pBind (bottom row). Note that this ability depends on the proportion of “hotspots” provided. Without any “hotspots” provided, RF2 is hardly predictive, because RF2 without privileged information is quite rarely confident or accurate in its predictions.
Extended Data Figure 3:
Comparison of fine-tuned RoseTTAFold2 to IgFold on antibody monomer prediction A) 104 antibodies released after the RF2 (and IgFold) training dataset date cutoff (January 13th, 2023) that share < 30% target sequence similarity to any antibody complex released prior to this date were predicted as monomers with either fine-tuned RF2 or IgFold (IgFold cannot predict antibody-target complexes). Shown is the median Fv quality prediction (by overall RMSD) of fine-tuned RF2, of (PDB ID: 8GPG), with (right) and without (left) sidechains shown (gray: native; colors: prediction). While the backbone RMSD is close to the true structure, some sidechains are incorrectly positioned. B) Fine-tuned RF2 slightly outperforms IgFold at prediction accuracy. Overall prediction accuracy is slightly improved in fine-tuned RF2 vs IgFold (p=0.015, Wilcoxon Paired Test), with greater improvements in CDR H3 prediction accuracy (p=0.00007, Wilcoxon Paired Test).
Extended Data Figure 4:
Fine-tuned RoseTTAFold2 recapitulates design structures and computationally demonstrates specificity of VHHs for their targets A) Comparison of RF2 pAE and RMSD of the prediction to the design model. A significant fraction of designs are re-predicted by RF2 (given 100% of “hotspots”), and pAE correlates well with accuracy to the design model. B) RF2 can be used to assess quality of designed VHHs. Providing the VHH sequence with the true target structure (used during design) leads to higher rates of high-confidence predictions than predicting the same sequence with a decoy structure (not used in design), as assessed by the fraction of predictions with pAE < 10 (normalized to the fraction of predictions with pAE < 10 for that target with its “correct” VHH partners). In these experiments, the true or decoy target was provided along with 100% of hotspot residues, with those hotspot residues derived from the target with its “true” designed VHH bound. C) Orthogonal assessment of designed VHHs with Rosetta demonstrates that the interfaces of RF2-approved (RMSD < 2 Å to design model, pAE < 10) VHH designs have low change in free energy (ddG) (top; only slightly worse than native VHHs) and slightly higher spatial aggregation propensity (SAP) score as compared to natives (bottom).
Extended Data Figure 5:
Alignment of VHH Design Models to Complexes in the PDB For each of the highest affinity VHHs identified for each target, and the structurally characterized influenza HA VHH, the closest complex in the PDB is shown. Designed VHHs (pink) are shown in complex with their designed target (teal and tan). The closest complex was identified visually (Methods). A) Designed TcdB VHH aligned against 3 VHHs from( PDB ID: 6OQ5) (shades of blue). The designed TcdB VHH binds to a site for which no antibody or VHH structure exists in the PDB. B) Designed RSV Site III VHH aligned against VHH from (PDB ID: 5TOJ) (blue). C) Designed SARS-CoV-2 VHH aligned against VHH from (PDB ID: 8Q94) (blue). D) Designed SARS-CoV-2 VHH aligned against Fab from 7FCP (shades of blue). E) Highest affinity designed influenza HA VHH aligned against Fv from (PDB ID: 8DIU) (shades of blue). F) Highest affinity designed influenza HA VHH aligned against VHH from (PDB ID: 6YFT) (blue). G) Structurally characterized (cryoEM) designed influenza HA VHH aligned against Fv from (PDB ID: 8DIU) (shades of blue). H) Structurally characterized (cryoEM) designed influenza HA VHH aligned against VHH from (PDB ID: 6YFT) (blue).
Extended Data Figure 6:
In silico evaluation of RFdiffusion scFv designs A) RFdiffusion was used to generate scFv designs using the framework from Herceptin (hu4D5–8), which has been used to make scFvs previously. Five targets were chosen (IL10 Receptor-ɑ, TLR4, β-lactamase, TcdB and SARS-CoV-2 (omicron) RBD (PDB IDs: 6X93, 4G8A, 4ZAM, 7ML7, 7WPC). Shown are five examples with close agreement between the design model and the fine-tuned RF2 prediction (RMSD (Å): 0.60, 0.56, 0.46, 0.43, 0.61; pAE: 4.73, 4.10, 4.49, 3.52, 3.65). Gray: designs, Pink: RF2 prediction. B) Against the four targets to which VHHs were successfully designed, fine-tuned RF2 predicts good specificity to the designed target vs decoy targets. C) Against the five targets shown in (A), fine-tuned RF2 similarly predicts high specificity to the designed target vs decoy targets. D) Orthogonal assessment of designed scFvs with Rosetta demonstrates that the interfaces of RF2-approved (RMSD < 2 Å to design model, pAE < 10) scFv designs have low ddG (top; only slightly worse than native Fabs) and lower spatial aggregation propensity (SAP) score as compared to natives (bottom).
Extended Data Figure 7:
Analysis of SPR Competition Assays The average response during VHH injection normalized to the response immediately preceding VHH injection for A) TcdB VHH competition with Fzd48. B) TcdB VHH does not bind to the closely related Clostridium sordellii TcsL toxin, indicating that it is binding through specific interactions. C) SARS-CoV-2 RBD VHH competition with AHB2. For the competition experiments, in the miniprotein binder-only trace, no VHH is injected and the average response over the corresponding period is plotted as a baseline. (A) and (C) are the quantification from the rightmost panels of Fig. 2C–D.
Extended Data Figure 8:
SPR traces of experimentally validated VHHs SPR traces of the experimentally validated VHH hits described in this study. For traces where confident KD estimates could be fit, we display these on the figure panels.
Extended Data Figure 9:
TcdB neutralization by VHH_TcdB_H2 A) Neutralization of TcdB by VHH_TcdB_H2 in CSPG4 KO Vero cells. Cell viability is measured after 48 hours. Points indicate the mean and error bars are the standard deviation across two independent replicates. B) Vero CSPG4 KO cells treated with vehicle, TcdB alone or TcdB + VHH after 24 hours.
Extended Data Figure 10:
Affinity maturation of VHH binders with OrthoRep. A) FACS-plots showing OrthoRep-driven affinity maturation over 15 rounds for a TcdB-targeting VHH where red gates are the population of binders selected for the next round of FACS. The asterisk in the Cycle 14 plot indicates the use of less antibody for detecting expression (Y-axis), explaining why the average expression level of Cycle 14 measures lower than other cycles. FACS plots for OrthoRep-driven affinity maturation campaigns for VHHs targeting SARS-CoV-2 RBD and influenza HA are not shown but follow similar trends. B) KD measurements for VHHs affinity-matured against TcdB (first row), SARS-CoV-2 RBD (second row), and influenza HA (third row) in comparison to the parental designs (left column). Dilution series for parental designs (left column) are 5-fold with an upper concentration of 5 μM. Affinity-matured VHHs (right column) were run as titration series as follows: TcdB (200 nM, 4-fold), RBD (200 nM 2-fold) and HA (50 nM, 2-fold). C-D) Location of mutations in E2.11 (TcdB_H2_ortho), the affinity matured version of TcdB_H2 (C), and cov_19_ortho the affinity matured version of the SARS-CoV-2 RBD nanobody cov_19 (D). E) Multiple sequence alignment of highly enriched TcdB nanobody clones isolated at cycle 15 of the OrthoRep-driven TcdB nanobody affinity maturation campaign.
Extended Data Figure 11:
Negative-stain electron microscopy analysis of influenza HA antigens A) Raw nsEM micrograph, B) 2D class averages showing a predominance of HA monomer species in the sample, and C) a representative predicted 3D model of this commercially produced monomeric HA antigen expressed in insect cells (adapted from PDB ID: 8SK7). This construct was used for screening VHH binders via yeast surface display and surface plasmon resonance. Insect-cell-produced glycoproteins exhibit a truncated glycan shield compared to those produced in mammalian cells. D) Raw nsEM micrograph, E) 2D class averages showing a clear abundance of HA trimers, and F) a representative 3D model of this in-house produced, trimeric Iowa43 HA antigen expressed in mammalian cells (adapted from (PDB ID: 8SK7). This antigen is fully and natively glycosylated, and is the trimeric form of HA. Together these features make Iowa43 suitable for Cryo-EM structural studies of de novo designed VHHs and their capacity to bind to natively glycosylated glycoproteins of therapeutic interest.
Extended Data Figure 12:
Cryo-EM structure determination statistics for a de novo designed VHH bound to an influenza HA trimer A) Representative raw micrograph showing ideal particle distribution and contrast. B) 2D Class averages of Influenza H1+designed VHH with clearly defined secondary structure elements and a full-sampling of particle view angles. C) Cryo-EM local resolution map calculated using an FSC value of 0.143 viewed along two different angles. Local resolution estimates range from ~2.3 Å at the core of H1 to ~3.7 Å along the periphery of the designed VHH. D) Global resolution estimation plot. E) Orientational distribution plot demonstrating complete angular sampling.
Extended Data Figure 13:
CryoEM statistics for the observed apo states of TcdB, VHH_TcdB_H2. Early experiments with pre OrthoRep VHH_TcdB_H2 nanobody resulted in 2 apo state structures with no nanobody bound. Representing two states of TcdB observed from two different cryoEM grids collected on Titan Krios with K3 detector; compressed TcdB/ thick ice (A, C, E, G, I) 2335 movies and extended TcdB/ thin ice (B, D, F, H, J) 3430 movies. A, B) Representative Micrographs. C, D) 2D Class Averages. E, F) Global FSC non uniform refinement. G, H) Orientational distribution plots. I, J) Sharpened maps, non uniform refinement
Extended Data Figure 14:
Cryo-EM structural characterization TcdB in complex with a de novo designed VHH, VHH_TcdB_H2 with glycine added. A) 2D class averages of TcdB in complex with the de novo designed VHH, VHH_Tcdb_H2. B) 3D classification reveals multiple classes lacking bound density, while two classes exhibit clear density near the Frizzled-7 epitope, the intended target of this design.
Extended Data Figure 15:
Preliminary CryoEM structures of OrthoRep Affinity Matured TcdB VHH, VHH_TcdB_H2_ortho; multiple TcdB conformation observed Thin and thick ice was targeted on one grid. 7,546 movies collected on Titan Krios with K3 detector. 4 major classes were observed and sorted with heterogeneous refinement and previously solved apo state structures: compressed TcdB apo unbound 43,943 particles (not shown), compressed TcdB VHH bound 76,997 particles (C, E, G), TcdB extended apo unbound 16,074 particles (not shown), TcdB extended VHH bound 72,014 particles (D, F, H) A) Representative micrographs B) 2D Class Averages. C, D) Global Fourier Shell Correlation plot, Non Uniform Refinement E, F) Orientational distribution plots. G, H) Sharpened maps, non uniform refinement (aggregation from His tag visible).
Extended Data Figure 16:
Final Local Refinement CryoEM statistics for OrthoRep Affinity Matured TcdB VHH, VHH_TcdB_H2_ortho in complex with TcdB Local refinement and masking used to reduce noise from His tag and improve resolution. A) Local Resolution map (Å), calculated using an FSC value of 0.143 viewed along two different angles B) Global Fourier Shell Correlation plot, Local Refinement C) Orientational distribution plot D) Orientational diagnostics data.
Extended Data Figure 17:
Cryo-EM structural characterization of an inaccurately designed VHH against SARS-CoV-2 A) Representative 2D class averages of the designed VHH, cov_19, bound to the SARS-CoV-2 RBD. B) 3D class averages reveal the SARS-CoV-2 spike population adopting conformations with either one or two RBDs in the up position, with additional density corresponding to the designed VHH. C) A globally refined ~3.4 Å cryo-EM reconstruction of the complex highlights substantial flexibility in the RBDs, leading to poor resolution in these regions and preventing direct visualization of the designed VHH. D) Global Fourier shell correlation (FSC) plot of the 3.38 Å cryo-EM map. E) Orientational distribution plot showing complete angular sampling of the SARS-CoV-2/designed VHH complex. F) Symmetry expansion, 3D classification, and local refinement focused on the RBD region improve the resolution of the bound VHH compared to the globally refined map. (G-H) Due to the modest resolution of the local refinement, an initial docking of a SARS-CoV-2 RBD fragment into the cryo-EM density was performed, followed by alignment of the full design model—including both the RBD fragment and the designed VHH—to the pre-fitted RBD. This approach confirmed that the RFdiffusion design closely matches the experimentally determined complex in both structure and epitope targeting; however, the binding angle deviates significantly from the design prediction (G). In contrast, a retrospective analysis revealed that the corresponding AlphaFold3 (AF3) prediction accurately recapitulated the docking within the cryo-EM density, suggesting that AF3 outperforms RFdiffusion as a predictor of successful binding and should be considered as an additional filter in future design efforts (F).
Extended Data Figure 18:
AlphaFold3 retrospectively predicts binders A) iPTM distributions of design VHH libraries against 4 targets. Red lines indicate validated binders. B) ROC curve demonstrating strong retrospective predictive power of AF3 at discriminating designed VHH binders from non-binders (AUC=0.86). Note though that this plot is dominated by influenza HA binders, which are more numerous than confirmed binders to SARS-CoV-2 RBD and TcdB. C-D) Similar retrospective analyses of TcdB scFv binders. These binders were assembled combinatorially from structurally similar “parent” designs. The successfully-binding combined designs have significantly higher AF3 iPTM scores than the parent designs that they emanate from (C, 6 binders from 12 parent designs; two-sided Students t-test; p=0.0025), and from the parental library as a whole (D). These analyses further indicate the utility of AF3 for antibody design filtering.
Extended Data Figure 19:
Assembly of uniquely-paired H-L scFvs from 400 bp oligonucleotides Overview of the assembly strategy for scFvs, uniquely pairing designed heavy chains with their corresponding designed light chain. Note that this strategy permits assembly in either H-L order or L-H order, and for several linkers to be inserted between the chains (see also Extended Data Fig. 15). A) Overview of the synthesized oligos. Each heavy-chain oligonucleotide contains two unique “barcodes”, present also on their unique corresponding light-chain oligonucleotide. B) i) For H-L ordering of the two Fvs, oligonucleotides are amplified such that the 3’ barcode of the heavy chain is amplified (left), and the identical barcode is amplified at the 5’ end of the corresponding light chain. Subpool-specific USER-cleavable primers permit this amplification. ii) The USER-cleavable primers are cleaved, exposing the unique barcodes. iii) A second PCR is performed with only the outer (non-cleavable) primers. PCR assembly brings together the two designed Fvs over the unique barcode. C) i) Golden-Gate Assembly (GGA) with BsaI is used to clone these assembled fragments into custom vectors that provide the N-terminal heavy chain framework (up until the start of CDR1) and the C-terminal light chain framework (from the end of CDR3) fragments. Note that GGA is “scarless”, so no additional base pairs are inserted between framework and CDRs. ii) After amplification of custom linkers, that are flanked by the C-terminal heavy chain framework (from the end of CDR3) and the N-terminal light chain framework (up until the start of CDR1) fragments, cloning with a second GGA step is performed, with the BsmBI enzyme. Note that multiple different linkers can be included in this second step. Note also the presence of a stop codon after GGA-step 1, to ensure that failure of GGA-step 2 does not affect subsequent functional assays.
Extended Data Figure 20:
Assembly of uniquely-paired L-H scFvs from 400 bp oligonucleotides Overview of the assembly strategy for scFvs, uniquely pairing designed heavy chains with their corresponding designed light chain. Note that this strategy permits assembly in either H-L order or L-H order, and for several linkers to be inserted between the chains (see also Extended Data Fig. 14). A) Overview of the synthesized oligos. These are the same oligonucleotides as in Extended Data Fig. 14. B) i) For L-H ordering of the two Fvs, oligonucleotides are amplified such that the 5’ barcode of the heavy chain is amplified (left), and the identical barcode is amplified at the 3’ end of the corresponding light chain. Subpool-specific USER-cleavable primers permit this amplification. ii) The USER-cleavable primers are cleaved, exposing the unique barcodes. iii) A second PCR is performed with only the outer (non-cleavable) primers. PCR assembly brings together the two designed Fvs over the unique barcode, in L-H ordering. C) i) Golden-Gate Assembly (GGA) with BsmBI is used to clone these assembled fragments into custom vectors that provide the N-terminal light chain framework (up until the start of CDR1) and the C-terminal heavy chain framework (from the end of CDR3) fragments. Note that GGA is “scarless”, so no additional base pairs are inserted between framework and CDRs. ii) After amplification of custom linkers, that are flanked by the C-terminal light chain framework (from the end of CDR3) and the N-terminal heavy chain framework (up until the start of CDR1) fragments, cloning with a second GGA step is performed, with the BsaI enzyme. Note that multiple different linkers can be included in this second step. Note also the presence of a stop codon after GGA-step 1, to ensure that failure of GGA-step 2 does not affect subsequent functional assays.
Extended Data Figure 21:
Assembly of structurally-similar clusters of heavy and light chains from 300 bp oligonucleotides Assembly strategy for combinatorial assembly of structurally-similar, TM-clustered heavy and light chains from 300 bp oligonucleotides. A) Schematic of ordered oligonucleotides. Each cluster of designs gets a unique barcode (striped orange). B) This cluster-specific barcode is used both as a PCR primer (i) and as the basis for PCR assembly (ii). These barcodes/primers being unique to each structurally-similar cluster of designs ensures that only “compatible” heavy and light chains assemble. C) in an identical manner to Extended Data Figs. 14 & 15, two rounds of GGA ligate the fragment from (B) into a custom vector (i) and subsequently ligate in a (set of) linker(s) (ii), to yield a library of structurally-compatible heavy and light chain scFvs. Note that due to oligonucleotide constraints, only one Fv-ordering can be achieved in this 300 bp setup.
Extended Data Figure 22:
Computational validation of the structure-based combinatorial assembly strategy Structure-based design permits the rational combinatorial assembly of heavy and light chains, assembling only heavy and light chains from structurally similar pairs. A) Fine-tuned RoseTTAFold (left), and AlphaFold3 (right) validate that pairing heavy and light chains from structurally similar (i.e. high pairwise TM score) designs yields scFvs that are more likely to be predicted to bind with high confidence (RF2 pBind, left; AF3 iPTM, right) than heavy and light chains from structurally-dissimilar (low pairwise TM score) designs. Note that the extremely high pBind distribution of the “designed pairings” (rightmost bar of left plot) is an artifact of those designs being specifically filtered for high pBind scores. B-C) combinatorial assembly leads to dramatically larger library sizes. Plots show the number of clusters (pink) at different TM score thresholds for TcdB (left) and Phox2b (right) scFvs. For the amplification strategy to work, each “cluster” becomes a PCR subpool, requiring independent PCR reactions (3 per subpool). Hence, we limit ourselves to large subpools (>= 100 designs), which maximises the combinatorial amplification for the amount of additional library assembly work. We additionally plot the theoretical library size for each target (blue), calculated as number_of_clusters x cluster_size. Gray lines indicate the TM threshold chosen for library assembly, where library sizes approximately match the transfection efficiency of yeast (107) .
Extended Data Figure 23:
Negative data for TcdB 400 bp library A) Yeast competition data for scFv7 designed against the CSPG4-binding site of TcdB, in HL orientation. The scFv was identified by next-generation sequencing of prior FACS enrichments against TcdB and clonally expressed on EBY100 yeast for competition with a previously-characterized designed minibinder against the intended epitope. Target binding was detected at nanomolar concentrations, but no significant reduction in binding signal was detected over the course of increasing competitor titrations. B) SPR analysis confirmed binding of the target while competition was not observed, suggesting binding at an incorrect site.
Extended Data Figure 24:
Characterization of scFvs that bind TcdB using yeast surface display flow cytometry A) (left) Results of flow cytometry of yeast samples displaying scFv4-C-Myc construct. Each sample was treated with a titration of soluble biotinylated TcdB fragment (1401–1616) (bn-TcdB) concentrations and visualized with anti-C-Myc FITC + SAPE. (right) Percentage of expressing cells which are within the gate increase with bn-TcdB concentration. B) (left) scFvs were designed to bind to the Frizzled-7 epitope and therefore should compete with Frizzled-7. Designed scFvs should not compete with CSPG4, which binds at a different epitope on full-length TcdB. (right) Yeast displaying scFv4-C-Myc were incubated with 1 nM TcdB and either no competitor, 100 nM Frizzled-7, or 100 nM CSPG4. Binding signal decreases when Frizzled-7 is added, supporting that scFv4 binds at the Frizzled-7 epitope. Binding signal does not significantly decrease when CSPG4 is added.
Extended Data Figure 25:
Biochemical characterization of a designed scFv specifically binding a therapeutically-relevant peptide-MHC A) C*07:02/PHOX2B titration results with yeast surface display of anti-C*07:02/PHOX2B scFv B1.2.1, tested in the “HL” orientation with a (G4S)3 linker. For the tetramer condition, the biotinylated C:07:02/PHOX2B pHLA was tetramerized on streptavidin-PE (SAPE) prior to validation. The negative control is yeast incubated in the same concentrations of SAPE and FITC used in the experimental conditions in the absence of target. B) AF3 prediction of construct B1.2.1 docked to C*07:02/PHOX2B. C) Left: Surface plasmon resonance (SPR) data characterizing binding of B1.2.1 in the HL and LH orientations in the 10LH-based framework (“phox” prefix, left column) and the trastuzumab framework (“her” prefix, right column). B1.2.1 binds with approximately 1 μM affinity. Right: SPR data characterizing on-target binding of C*07:02/PHOX2B (“phox2b”) versus the same HLA bound to the R6A mutant of PHOX2B (“phox2b_r6a”). The results indicate specific binding to the intended target. D) Representative ITC titration of HLA-C*07:02/PHOX2B (30 μM) into a sample containing 2 μM herceptin_VLVH-His-Avi binder. Both samples contain 1 mM excess of PHOX2B peptide, to prevent the formation of empty HLA. The black line is the fit of the isotherm. Fitted values for KD, ΔH, and ΔS were determined using a 1-site binding model.
Extended Data Figure 26:
Low affinity designed Phox2B:HLA-C*07:02 scFvs do not show cytotoxicity Cell index (CI) was monitored over time for neuroblastoma cell lines ((A) SK-N-AS, (B) SK-N-SH, (C) NBSD, (D) NB-1691, (E) SK-N-FI) and a colorectal adenocarcinoma cell line ((F) LS123) following the addition of CAR-T cells at total T cell effector-to-target ratio 15:1. CI values, representing cell viability and growth, were measured by the xCELLigence RTCA DP system at hourly intervals and normalized to baseline values to assess cell-mediated cytotoxicity. Mean and SEM are shown with each sample performed in triplicate, and rare outlier CI values were filtered. 10LH (positive control) demonstrated cytotoxicity against most Phox2b+ neuroblastoma lines expressing HLA-A*24:02 or HLA-A*23:01 and no cytotoxicity against Phox2b- LS123, as expected. In contrast, designed scFvs show no cytotoxicity against Phox2b+ neuroblastoma lines expressing HLA-C*07:02 or HLA-C*07:01. RA-7 and RA-8, as well as RA-11 and RA-12 comprise the same scFv with alternate heavy and light chain orderings. G) Transduced CAR T cells were stained with anti-(G4S)3 linker antibody, anti-CD3, anti-CD4 and anti-CD8 to confirm CAR expression. Staining for one example of positive control 10LH is shown.
Extended Data Figure 27:
CryoEM statistics for TcdB in complex with scFv6 10,897 movies were collected on a Glacios with a K3 detector. Thin ice was targeted for imaging, and only extended TcdB were observed. Heterogeneous refinement and apo structure were used to sort scFv bound TcdB (41,837 particles) and unbound apo TcdB (14,384 particles). A) 2D Class Averages. B) Representative micrograph C) Local Resolution map (Å), calculated using an FSC value of 0.143 viewed along two different angles D) Global Fourier Shell Correlation plot, Non Uniform Refinement E) Orientational distribution plots. D) Orientational diagnostics data.
Extended Data Figure 28:
CryoEM statistics for TcdB in complex with scFv5 8,304 movies were collected on a Glacios with a K3 detector. Thin ice was targeted for imaging, and only extended TcdB were observed. Heterogeneous refinement and apo structure were used to sort scFv-bound TcdB (12,540 particles) and unbound apo TcdB (3,667 particles). A) 2D Class Averages. B) Representative micrograph C) Local Resolution map (Å), calculated using an FSC value of 0.143 viewed along two different angles D) Global Fourier Shell Correlation plot, Non Uniform Refinement E) Orientational distribution plots. D) Orientational diagnostics data.
Extended Data Figure 29:
Cryo-EM structure and AF3 prediction of scFv6 overlaid with the parent design models scFv6 is an assembly of heavy and light chains from two different (but near-superimposable) parent design models. A-B) Cryo-EM structure of scFv6 aligned to the “composite design model” (the heavy and light chains from the respective parent designs). The structures were superimposed based on the target protein structure. This highlights that LCDRs and HCDRs from structurally clustered but independent designs retain their intended structure after combinatorial assembly. C-D) AlphaFold3 recapitulates the composite design model structure.
Figure 1:
Figure 1:
Overview of RFdiffusion for antibody design A) RFdiffusion is trained such that at time T, a sample is drawn from the noise distribution (3D Gaussian distribution for translations, and uniform SO3 distribution for rotations), and this sampled noise is then “de-noised” between times T and 0, to generate an (in this case) scFv binding to the target structure through its CDR loops. B) Control over which framework is used is provided through input of a framework “template”, which specifies the pairwise distances and dihedral angles between residues in the framework. The sequence of the framework region is also included. For example, provision of a VHH framework generates a VHH (top row), whereas provision of an scFv framework generates a scFv (bottom row). C) Diversity in the antibody-target dock is achieved through the pairwise framework representation, which, because the framework structure is provided on a separate template to that of the target, does not provide information about the rigid body framework-target relationship. Hence, diverse docking modes are sampled by RFdiffusion. D) The epitope to which the antibody binds can be specified by provision of input “hotspot” residues, which direct the designed antibody (compare orange, left vs pink, right).
Figure 2:
Figure 2:
Biochemical characterization of designed VHHs A-B) 9000 designed VHHs were screened against RSV site III (VHH_RSV_01) and influenza hemagglutinin (VHH_flu_01) with yeast surface display, before soluble expression of the top hits in E. coli. Surface Plasmon Resonance (SPR) demonstrated that the highest affinity VHHs to RSV site III and Influenza Hemagglutinin bound their respective targets with 1.4 μM and 78 nM respectively. C) 9000 VHH designs were tested against SARS-CoV-2 receptor binding domain (RBD), and after soluble expression, SPR confirmed an affinity of 5.5 μM to the target for design VHH_RBD_D4. Binding was to the expected epitope, confirmed by competition with a structurally confirmed de novo binder (AHB2, PDB ID: 7UHB). D) 95 VHH designs were tested against the C. difficile toxin TcdB. The highest affinity VHH, VHH_TcdB_H2, bound with 262 nM affinity, and also competed with a structurally confirmed de novo binder to the same epitope (right). See also Extended Data Fig. 7 for quantification of the competition shown in C and D. E) Designed VHHs were distinct from the training dataset. Blastp was used to find hits against the SAbDab, and the similarity of the CDR loops in the top blast hit were reported for all VHHs experimentally tested in this study. Note also that the 28 VHHs confirmed to bind their targets by SPR do not show enhanced similarity to the training set (red lines).
Figure 3:
Figure 3:
Cryo-EM structural characterization of two de novo designed VHH binding to influenza hemagglutinin and TcdB A) Labeled cryo-EM 2D class averages of a designed VHH, VHH_flu_01, bound to influenza HA, strain A/USA:Iowa/1943 H1N1. B) A 3.0 Å cryo-EM 3D reconstruction of the complex shows VHH_flu_01 bound to H1 along the stem in two of the three protomers. C) Cryo-EM structure of VHH_flu_01 bound to influenza HA. D) The cryo-EM structure of VHH_flu_01 in complex with HA closes matches the design model. E) cryo-EM reveals the accurate design of VHH_flu_01 using RFdiffusion (RMSD to the RFdiffusion design of the VHH is 1.45 Å). F) Superposition of the designed VHH CDR3 predicted structure as compared to the built cryo-EM structure (RMSD = 0.84 Å). G) Comparison of predicted CDR3 rotamers compared to the built 3.0 Å cryo-EM structure. H) Examination of apo HA protomers juxtaposed with those bound to the designed VHH unveils a notable repositioning and accommodation of glycan N296 to allow for binding of the designed VHH to the HA stem. In each structural depiction panel, the designed VHH predicted structure is showcased in gray, while the cryo-EM solved structure of the designed VHH is depicted in purple. Additionally, the HA glycoprotein is represented in tan, and the HA glycan shield is illustrated in green. I) Labeled cryo-EM 2D class averages of the designed and affinity-matured VHH, VHH_TcdB_H2_ortho, bound to full-length TcdB. J) A 5.7 Å cryo-EM 3D reconstruction of the complex shows VHH_TcdB_H2_ortho bound to the target epitope as predicted. K) Due to the modest resolution, a fragment of TcdB was first docked into the cryo-EM density map, and the full design model—including both the TcdB fragment and the designed VHH—was then aligned to the pre-fitted TcdB fragment. This approach demonstrates that the predicted design closely matches the experimentally determined complex in structure, epitope targeting, and overall conformation. (Yellow = HA; purple = VHH (cryo-EM); gray = VHH (computational design prediction)
Figure 4:
Figure 4:
Biochemical characterization of combinatorially-assembled scFvs with six designed CDRs. A) Multiple sequence alignment of 6 scFvs that bind TcdB. The first five scFvs originate from the same structural cluster, which scFv6 originates from a distinct cluster. B) AlphaFold3 predictions of scFv5 and scFv6 in complex with TcdB receptor binding domain. Both scFv5 and scFv6 are predicted to bind a similar but not identical epitope. The predicted orientation of scFv6 relative to TcdB is rotated in comparison to scFv5 (left). CDRH3 of both scFvs are predicted to make several polar contacts with the target (right). VL of scFv6 is also predicted to make several polar contacts via all 3 CDR loops. VL of scFv5 exhibits more hydrophobic packing to the target. C) SPR analysis of scFv binding to the receptor binding domain of TcdB. Each scFv was conjugated to a CM5 chip and TcdB RBD was titrated across a 6-step 4-fold dilution curve with an upper concentration of 1 μM D) scFv was conjugated to a CM5 chip and then TcdB RBD was flowed over at 50 nM either alone or mixed with 1 μM of Frizzled-7, CSPG4 or the same scFv as was conjugated to the chip. E) SPR comparative analysis of B1.2.1 binding C*07:02/PHOX2B versus C*07:02/PHOX2BR6A. scFv was immobilized to a CM5 chip and then on- and off-target binding was measured across an 8-step 2-fold titration with an upper concentration of 5 μM. Steady state kinetic analysis (top) and raw SPR trace of on- and off-target binding (lower) indicate specific binding to the intended target. F) AlphaFold3 predictions of HLA-C*07:02 with peptide PHOX2B (left) and PHOX2BR6A (right). R6 of PHOX2B is predicted to be solvent-exposed. G) AlphaFold3 prediction of scFv B1.2.1 in complex with C*07:02/PHOX2B (left). Predicted polar contacts with R6 of the PHOX2B peptide (right), mediated by CDRH3, CDRL1, and CDRL2. Polar contacts were visualized in PyMOL.
Figure 5:
Figure 5:
Cryo-EM structural characterization of two TcdB-binding scFvs. A) Labeled cryo-EM 2D class averages of a designed scFv, scFv6, bound to TcdB. B) A 3.6 Å cryo-EM 3D reconstruction of the complex shows scFv6 bound to TcdB along the Frizzled-7 epitope. C) Cryo-EM structure of scFv6 bound to TcdB. D) The cryo-EM structure of scFv6 in complex with TcdB closes matches the design model. E) Cryo-EM reveals the accurate design of scFv6 using RFdiffusion (RMSD to the RFdiffusion design of the scFV is 0.9 Å). F) Superposition of each of the six designed scFv6 CDR loop predicted structures as compared to the built cryo-EM structure (RMSD values: CDRH1 = 0.4 Å; CDRH2 = 0.3 Å; CDRH3 = 0.7 Å; CDRL1 = 0.2 Å; CDRL2 = 1.1 Å; CDRL3 = 0.2 Å). G) Comparison of predicted CDRH3 rotamers compared to the built 3.6 Å cryo-EM structure. H) Labeled cryo-EM 2D class averages of the designed scFv, scFv5, bound to full-length TcdB. I) A 6.1 Å cryo-EM 3D reconstruction of the complex shows the scFv5 bound to the target epitope as predicted. J) Due to the modest resolution, a fragment of TcdB was first docked into the cryo-EM density map, and the full design model—including both the TcdB fragment and the designed scFv—was then aligned to the pre-fitted TcdB fragment. This approach demonstrates that the predicted design closely matches the experimentally determined complex in structure, epitope targeting, and overall conformation. (Yellow = TcdB; purple = variable heavy chain fragment (cryo-EM); pink = variable light chain fragment (cryo-EM); gray = computational design prediction)

References

    1. Lyu X. et al. The global landscape of approved antibody therapies. Antib. Ther. 5, 233–257 (2022). - PMC - PubMed
    1. Wilson P. C. & Andrews S. F. Tools to therapeutically harness the human antibody response. Nat. Rev. Immunol. 12, 709–719 (2012). - PMC - PubMed
    1. Sormanni P., Aprile F. A. & Vendruscolo M. Rational design of antibodies targeting specific epitopes within intrinsically disordered proteins. Proc. Natl. Acad. Sci. U. S. A. 112, 9902–9907 (2015). - PMC - PubMed
    1. Liu X. et al. Computational design of an epitope-specific Keap1 binding antibody using hotspot residues grafting and CDR loop swapping. Sci. Rep. 7, 41306 (2017). - PMC - PubMed
    1. Leaver-Fay A. et al. ROSETTA3: an object-oriented software suite for the simulation and design of macromolecules. Methods Enzymol. 487, 545–574 (2011). - PMC - PubMed

Publication types