[Preprint]. 2024 Oct 16:2024.03.18.585604.
doi: 10.1101/2024.03.18.585604.

The PRC2.1 Subcomplex Opposes G1 Progression through Regulation of CCND1 and CCND2

Affiliations

The PRC2.1 Subcomplex Opposes G1 Progression through Regulation of CCND1 and CCND2

Adam D Longhurst et al. bioRxiv. .

Update in

Abstract

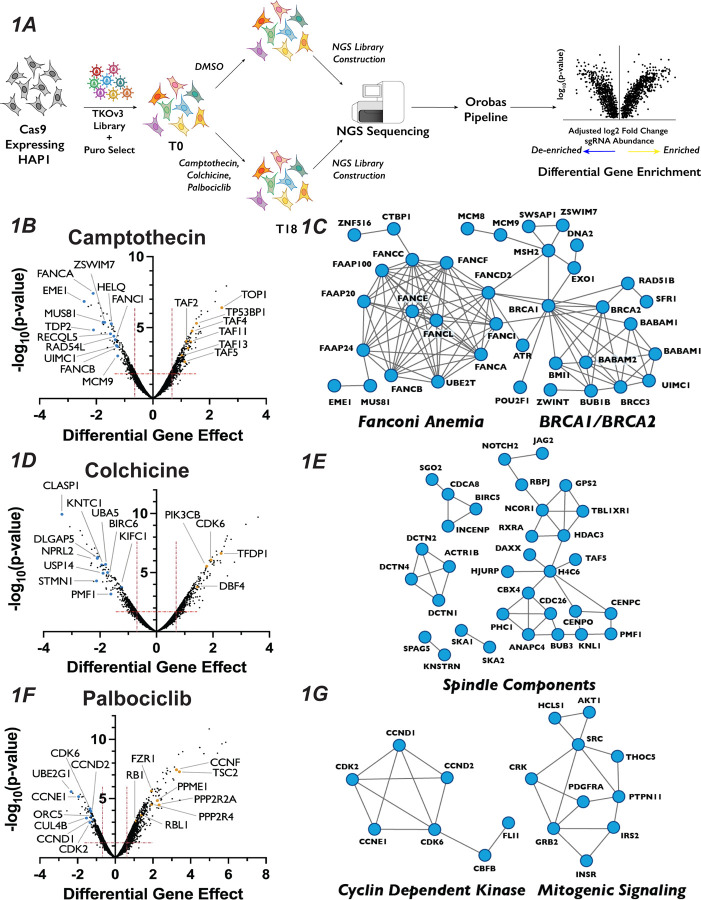
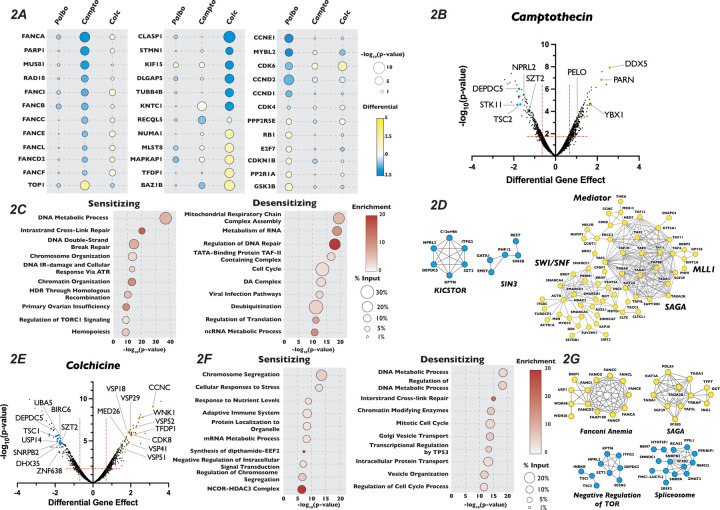
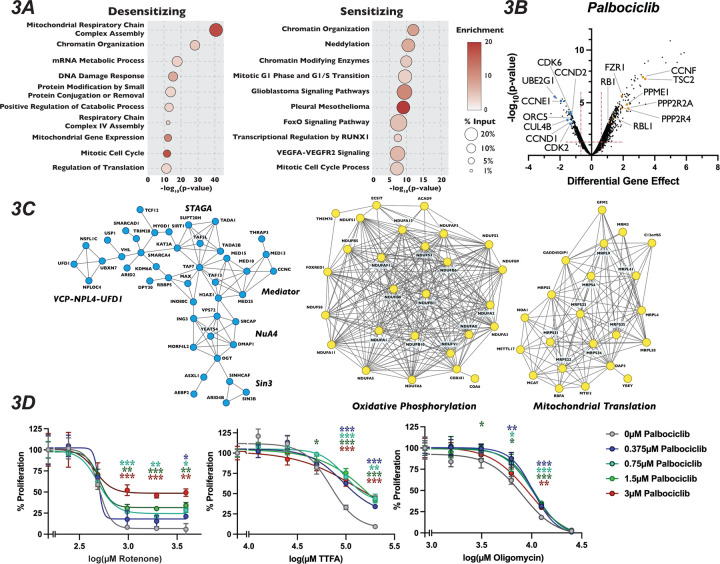
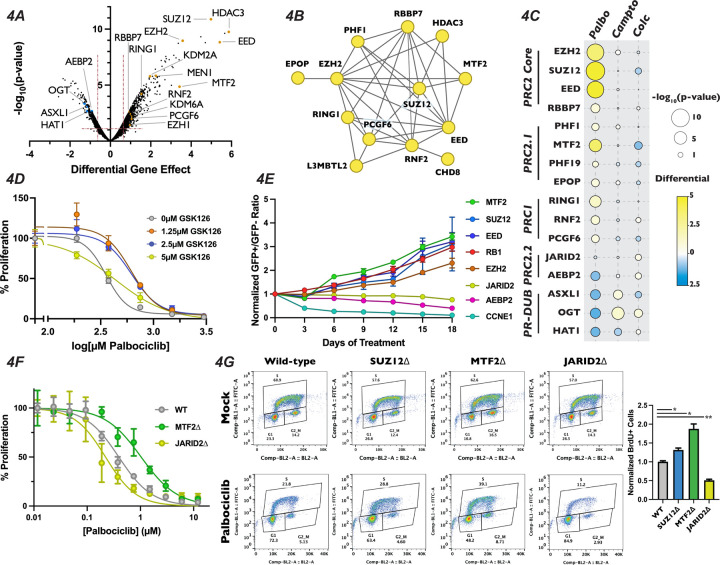
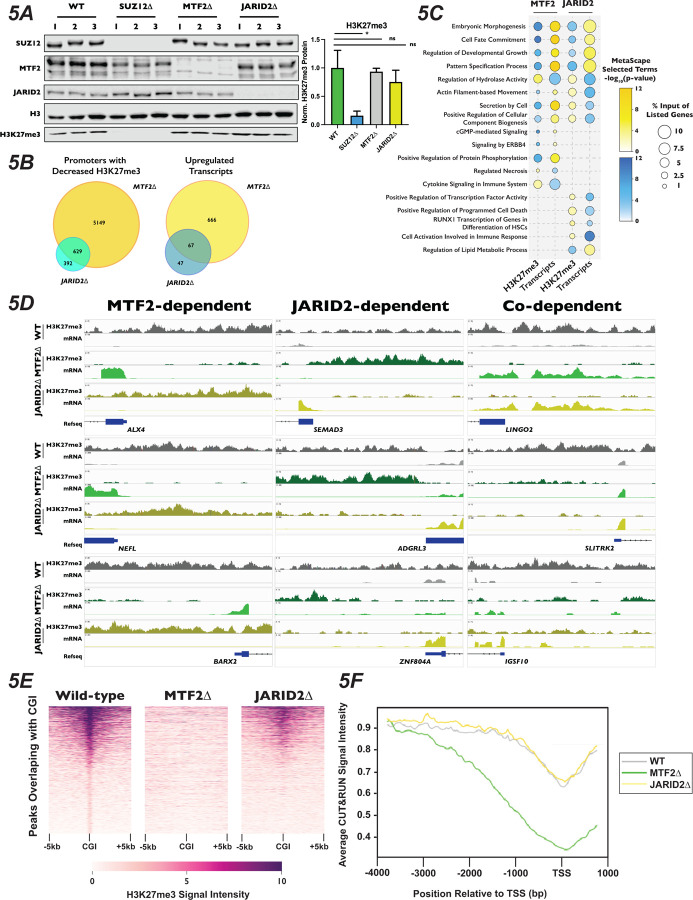
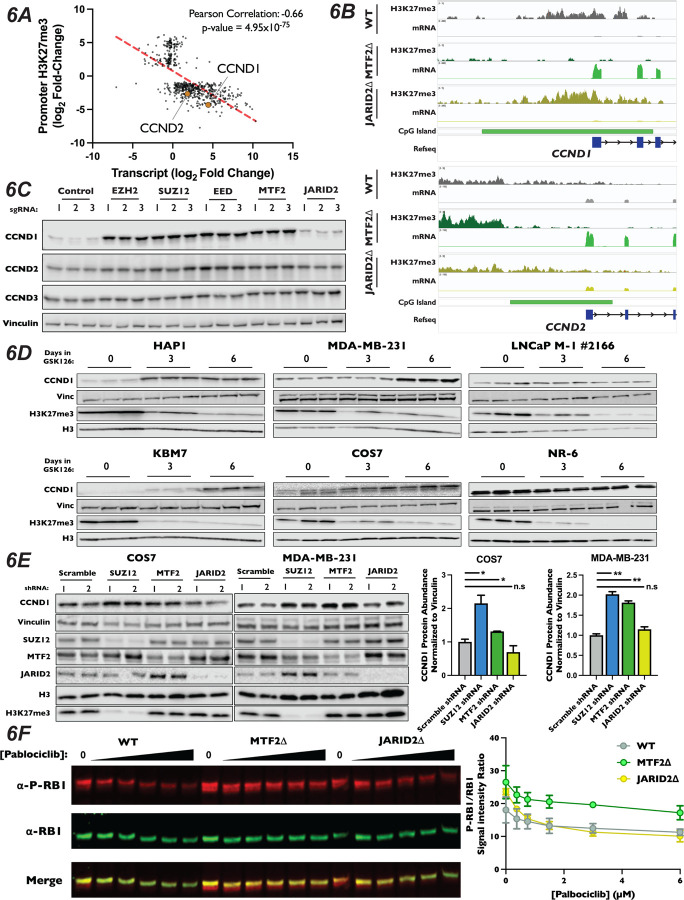
Progression through the G1 phase of the cell cycle is the most highly regulated step in cellular division. We employed a chemogenetic approach to discover novel cellular networks that regulate cell cycle progression. This approach uncovered functional clusters of genes that altered sensitivity of cells to inhibitors of the G1/S transition. Mutation of components of the Polycomb Repressor Complex 2 rescued proliferation inhibition caused by the CDK4/6 inhibitor palbociclib, but not to inhibitors of S phase or mitosis. In addition to its core catalytic subunits, mutation of the PRC2.1 accessory protein MTF2, but not the PRC2.2 protein JARID2, rendered cells resistant to palbociclib treatment. We found that PRC2.1 (MTF2), but not PRC2.2 (JARID2), was critical for promoting H3K27me3 deposition at CpG islands genome-wide and in promoters. This included the CpG islands in the promoter of the CDK4/6 cyclins CCND1 and CCND2, and loss of MTF2 lead to upregulation of both CCND1 and CCND2. Our results demonstrate a role for PRC2.1, but not PRC2.2, in antagonizing G1 progression in a diversity of cell linages, including CML, breast cancer and immortalized cell lines.


Figures

Figure 1:
Figure 1:. Chemogenetic CRISPR-Cas9 Screen to Study Cell Cycle Progression
(A): Schematic of chemogenetic CRISPR-Cas9 screen. (B): Volcano plots of camptothecin chemogenetic screen results. The “Differential Gene Effect” was plotted against the -log10(p-value) for this effect for each gene targeted in the screen, as calculated by the Orobas pipeline. Red dotted line indicates the established cut-off. Highlighted dots are genes with known roles in response to each treatment, with blue or yellow dots indicate genes that when inactivated resulted in sensitivity or resistance, respectively, to camptothecin. (C): Representative STRING analysis networks for protein complexes with known roles in pathways that we identified as sensitive in the camptothecin chemogenetic screen. Blue dots in the STRING network indicate genes that when inactivated resulted in sensitivity to camptothecin. (D): Same as in (B) but for colchicine chemogenetic screen results. (E): Same as in (C) but for colchicine screen results. (F): Same as in (B) but for palbociclib chemogenetic screen results. (G): Same as in (C) but for palbociclib screen results.
Figure 2:
Figure 2:. Analysis of Camptothecin and Colchicine Chemogenetic Screen Reveals Novel Players in Cell Cycle Regulation
(A): Dot plot comparison of the effect of gene mutation across three different screen conditions. Circle color indicates the strength of the positive or negative differential gene effect, circle size indicates the -log10(p-value) of the sgRNA enrichment. (B): Volcano plot of genes identified in the camptothecin chemogenetic screen, plotted as in Figure 1B with highlighted dots representing novel genes identified in the camptothecin screen. (C): Dot plot of Metascape analysis of significant genes that sensitized or de-sensitized cells to camptothecin. The-log10(p-value) of each term was plotted the enrichment was indicated by color of circle and the percentage of the input of genes associated with a given term is indicated by the size of the circle. (D): STRING analysis of genes identified from the analysis of the camptothecin screen. (E), (F) and (G) Same as in (B), (C) and (D) except for the colchicine screen.
Figure 3:
Figure 3:. Mutation of Mitochondria Genes Attenuates the Sensitivity to Palbociclib
(A): Dot plot of the -log10(p-value) Metascape analysis of significant genes in the palbociclib chemogenetic screen. The enrichment of a given term is indicated by color of circle and the percentage of the input is indicated by the size of the circle. (B): Volcano plot of genes identified from our analysis of the palbociclib screen, plotted as in Figure 1D, with highlighted dots representing novel genes. (C): STRING networks of novel protein complexes identified in palbociclib screen. Dots in the STRING network indicate genes that when inactivated resulted in sensitivity (blue) or resistance (yellow) to palbociclib. (D): Dose-response curve of palbociclib-induced proliferation rescue in combination with oxidative phosphorylation inhibitors by PrestoBlue assay. Cells were grown in palbociclib with or without increasing concentrations of rotenone, TTFA or oligomycin. Data represents mean of three technical replicates, normalized to the initial dose of each inhibitor in indicated concentration of palbociclib, ±StdDev. *: p-value<0.05, **: p-value<0.005, ***: p-value<0.0005, n.s.: not significant, two tailed unpaired Student’s t-test.
Figure 4:
Figure 4:. Loss of Polycomb Repressive Complex Components Display Specific Resistance to Palbociclib
(A): Volcano plot as in Figure 3B except with members of PR-DUB, PRC1 and PRC2 highlighted. (B): STRING analysis network of PRC components. Yellow dots indicate that inactivation of these genes conferred resistance to palbociclib. (C) Dot plot of comparison of the effect of PRC2 complex member gene mutation across three different screen conditions, as in Figure 2B. (D): Dose-response curve of palbociclib-induced proliferation inhibition rescue with GSK126 by Crystal Violet assay. Data was normalized to untreated cells and represents the mean of three technical replicates, ±StdDev. (E): Results of competitive proliferation assay for each indicated time point, normalized to the initial GFP+/GFP ratio of the pool. The performance of each sgRNA in 1.5μM palbociclib vs Mock is shown, after normalizing to control sgRNAs, ±SEM of the GFP+/GFP ratios of three independent sgRNAs. (F): Dose-response curve of palbociclib-induced proliferation inhibition in MTF2∆ and JARID2∆ cells by Crystal Violet assay. Data represents mean staining of three monoclonal knockout cell lines, ±StdDev. (G): BrdU incorporation assay for wild-type, SUZ12∆, MTF2∆ and JARID2∆ cell lines. Left – Representative BrdU incorporation vs propidium iodide flow cytometry traces. Right – Quantification of BrdU incorporation assay, mean of S-phase cells in three knockout lines ±StDev. *: p-value<0.05, n.s.: not significant, two-tailed unpaired Student’s t-test.
Figure 5:
Figure 5:. Polycomb 2.1 and PRC2.2 are Differentially Recruited to Promoters with CpG Island in HAP1
(A): Left - Western blots of wild-type, SUZ12∆, MTF2∆ and JARID2∆ cell extracts probed with the indicated antibodies. Right - Quantification of H3K27me3 signal intensity, normalized to H3, ±StDev. *: p-value<0.05, n.s.: not significant, two-tailed unpaired Student’s t-test. (B): Venn diagrams of MTF2∆ or JARID2∆ compared to wild-type cells of left - promoters with decreased H3K27me3 signal in CUT&RUN experiment or right - increased transcript levels in RNA-Seq (C): Dot-plot of selected Metascape terms of protein coding genes displaying significantly increased or decreased levels of H3K27me3 or transcripts. Color of the circle indicates the -log10(p-value) of the term and the size of circle indicates the percentage of the genes from the input list were represented in that term. (D): Genome browser traces of promoters with decreased H3K27me3 and increased mRNAs that were dependent on MTF2 (left), JARID2 (center) or on the presence either MTF2 or JARID2 (right). Tracks represent combined BED files from two clonal biological replicates. (E): Representative heat map of H3K27me3 signal for 1,877 peaks overlapping with CGI. Genomic regions are ordered by the H3K27me3 read density intensity in wild-type cells then plotted for the same loci in MTF2∆ and JARID2∆ cells. Plots are of one of two biological replicate. (F): H3K27me3 signal averaged for all CGI-containing promoters for wild-type, MTF2∆, and JARID2∆ cells.
Figure 6:
Figure 6:. CCND1 and CCND2 Expression is Increased in MTF2∆ Mutants
(A): Scatterplot of genes whose log2 fold-changes for MTF2∆/wild-type ratio of mRNA expression (x-axis) versus promoter H3K27me3 signal (y-axis) had an adjusted p-value of <0.05 and an adjusted p-value <0.1 where plotted. (B): Genome browser traces of H3K27me3 signal, transcript abundance and CGIs in the CCND1 and CCND2 promoters. Annotated CGIs indicated by green bar. (C): Top – Western blots of Cas9-expressing pools of cells transduced three independent sgRNAs targeting the indicated genes, probed with the indicated antibodies. (D): Western blots of whole-cell lysates from a panel of cell lines treated with 10μM GSK126 for the indicated time points, with listed antibodies. (E): Left – Western blots of whole-cell lysates from MDA-MB-231 and COS7 cells transduced with shRNA constructs shRNAs targeting SUZ12, MTF2, JARID2 or a scrambled control. Probed with indicated antibodies. Right – Quantification of western blots, CCND1 signal normalized to Vinculin. Each bar is the mean for two different shRNA expressing pools, error bars ±range. *: p-value<0.05, **: p-value<0.005, n.s.: not significant, two tailed unpaired Student’s t-test. (F): Left – Representative western blot of total RB1 and P-S807/8111-RB1 with increasing [palbociclib] in WT, MTF2∆ and JARID2∆ cells, probed with indicated antibodies. Right – Quantification of the ratio of P-S807/8111-RB1 to total RB1 signal plotted against [palbociclib], two biological replicates, error bars ±range.

Similar articles

References

    1. Ginzberg MB, Kafri R, Kirschner M. On being the right (cell) size. Science (80- ). 2015;348(6236). doi:10.1126/science.1245075 - DOI - PMC - PubMed
    1. Massagué J. G1 cell-cycle control and cancer. Nature. 2004;432(7015):298–306. doi:10.1038/nature03094 - DOI - PubMed
    1. Bertoli C, Skotheim JM, De Bruin RAM. Control of cell cycle transcription during G1 and S phases. Nat Rev Mol Cell Biol. 2013;14(8):518–528. doi:10.1038/nrm3629 - DOI - PMC - PubMed
    1. Rubin SM, Sage J, Skotheim JM. Integrating Old and New Paradigms of G1/S Control. Mol Cell. 2020;80(2):183–192. doi:10.1016/j.molcel.2020.08.020 - DOI - PMC - PubMed
    1. Malumbres M, Barbacid M. Mammalian cyclin-dependent kinases. Trends Biochem Sci. 2005;30(11):630–641. doi:10.1016/j.tibs.2005.09.005 - DOI - PubMed

Publication types