[Preprint]. 2024 Jul 10:2024.03.18.585561.
doi: 10.1101/2024.03.18.585561.

A Developmental Mechanism to Regulate Alternative Polyadenylation in an Adult Stem Cell Lineage

Affiliations

A Developmental Mechanism to Regulate Alternative Polyadenylation in an Adult Stem Cell Lineage

Lorenzo Gallicchio et al. bioRxiv. .

Update in

Abstract

Alternative Cleavage and Polyadenylation (APA) often results in production of mRNA isoforms with either longer or shorter 3'UTRs from the same genetic locus, potentially impacting mRNA translation, localization and stability. Developmentally regulated APA can thus make major contributions to cell-type-specific gene expression programs as cells differentiate. During Drosophila spermatogenesis, approximately 500 genes undergo APA when proliferating spermatogonia differentiate into spermatocytes, producing transcripts with shortened 3' UTRs, leading to profound stage-specific changes in the proteins expressed. The molecular mechanisms that specify usage of upstream polyadenylation sites in spermatocytes are thus key to understanding the changes in cell state. Here, we show that upregulation of PCF11 and Cbc, the two components of Cleavage Factor II (CFII), orchestrates APA during Drosophila spermatogenesis. Knock down of PCF11 or cbc in spermatocytes caused dysregulation of APA, with many transcripts normally cleaved at a proximal site in spermatocytes now cleaved at their distal site, as in spermatogonia. Forced overexpression of CFII components in spermatogonia switched cleavage of some transcripts to the proximal site normally used in spermatocytes. Our findings reveal a developmental mechanism where changes in expression of specific cleavage factors can direct cell-type-specific APA at selected genes.

Keywords: Alternative Polyadenylation; Cellular Differentiation; Cleavage factor Complex II; Development; Drosophila; Spermatogenesis; mRNA processing.


Figures
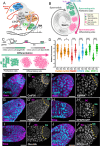
Figure 1.
Figure 1.. Expression of Cleavage Factors during Drosophila spermatogenesis.
(A) Schematic representation of the cleavage machinery, adapted from Gallicchio et al. (2023). Grey: CPSF = Cleavage and Polyadenylation Factor complex. Orange: CstF = Cleavage and Stimulation Factor complex. Blue: CFI = Cleavage Factor I. Green: CFII = Cleavage Factor II. PAS = Polyadenylation signal. (B) Diagram of a wild-type Drosophila testes showing key stages of germ cell differentiation. (C) Diagram of developmentally regulated APA in the Drosophila testis resulting in expression of transcripts with long 3’UTRs in spermatogonia but short 3’UTRs in spermatocytes from ~500 genes. (D) Quantification of relative immunofluorescence signal per nuclear area from (E-J). Each dot corresponds to a single nucleus. For each testis, 20 spermatogonial nuclei and 20 spermatocyte nuclei were quantified and N=5 testes were quantified per staining, for a total of 100 spermatogonia and 100 spermatocytes. Statistical significance calculated using the Kolmogorov-Smirnov t-test: (****) p-value < 0.0001; (*) p = 0.0366. (E-J) Example immunofluorescence images of testis apical regions from samples quantified in D. (Magenta) anti-Vasa marks germ cells. (Cyan) cleavage factor proteins: (E-G, J) Apical region of wild-type (w1118) testis stained with anti- (E) CstF50, (F) CstF64, (G) PABP2 and (J) PCF11. (H) Apical regions of testes from CPSF6:GFP transgenic fly stained with anti-GFP, (I) Apical region of testes from HA:cbc/HA:cbc fly stained with anti-HA. Dotted yellow line: border between proliferating spermatogonia (SG) and differentiating spermatocytes (SC). Scale bars = 50 uM.
Figure 2.
Figure 2.. Knock down of PCF11 and cbc in spermatocytes.
(A-C) Apical tips of testes stained with anti-PCF11. (A) Control: bamGal4, (B) PCF11-RNAi-VDRC-103710;bamGal4, (C) PCF11-RNAi NIG-10228R-4;bamGal4. (D-E-F) Phase contrast microscope images of whole mount live testes from Drosophila lines in (A, B, C) respectively. (G-I) Apical tips of testes stained with anti-HA. (G) Control HA:cbc/Cyo;bamGal4, (H) HA:cbc/+,cbc-RNAi-BL-77426;bamGal4 and (I) HA:cbc/+,cbc-RNAi-VDRC-100686;bamGal4. (J-L) Phase contrast microscope images of whole mount live testes. (J) Control: bamGal4, (K) cbc-RNAi-BL-77426;bamGal4 and (L) cbc-RNAi-VDRC-100686;bamGal4. Arrow heads indicate somatic cyst cell nuclei. Scale bars are 50 uM (A-C, G-I) and 200 uM (D-F, J-L). Note that in all the immunofluorescence experiments on HA:cbc/+ flies, the level of immunofluorescence signal with anti-HA in spermatogonia was below the detection limit for the experimental conditions. In contrast, for the testes quantified in Fig. 1-I, which were from homozygous HA:cbc/HA:cbc flies, the level of HA:Cbc in nuclei of spermatogonia was high enough to be detected (for comparison between homozygous and heterozygous testes see SOM Figure 1).
Figure 3.
Figure 3.. Knock down of either PCF11 or cbc reduces cleavage at the proximal PAS in spermatocytes.
(A) Diagram illustrating the design of the two probe sets. Light blue: probe against the protein coding sequence (CDS), orange: probe against the 3’UTR extension. (B-D’’) Confocal microscope images of (B, B’’) bamGal4 (control), (C, C’’) PCF11-RNAi-VDRC-103710;bamGal4 and (D, D’’) cbc-RNAi-BL-77426;bamGal4 testes hybridized with probes recognizing the CDS of the Kpc2 transcripts (cyan) and DAPI (B, C, D), and with probes recognizing the 3’UTR extension of the Kpc2 transcripts (in orange) (B’’, C’’, D’’). (B’-D’, B’’’-D’’’) Zooms in spermatocytes of corresponding regions from (B-D, B’’-D’’) respectively. (E) IGV plots of 3’seq pile up of reads for the gene Kpc2 from a sample enriched for SG = spermatogonia (16H PHS = post heat shock, Kim et al. 2017; Berry et al. 2022) and a sample enriched for spermatocytes (SC = spermatocytes, 72H PHS), to show the APA switch from the distal PAS (dPAS) used in spermatogonia and the proximal PAS (pPAS) used in spermatocytes. (F) Quantification of fluorescence ratio from probes recognizing the Kpc2 3’UTR extension (orange) compared to probes recognizing the Kpc2 CDS (cyan) in spermatocytes. For each genotype N=3 testes were quantified. For each image 5 measurements were taken in different spermatocytes areas, which are plotted on the graph. (G-K) Analogous to (A-F) for the Red gene. Scale bars are 150 uM (B, B’’, C, C’’, D, D’’, G, G’’, H, H’’, I, I’’) and 50 uM (B’, B’’’, C’, C’’’, D’, D’’’, G’, G’’’, H’, H’’’, I’, I’’’). p values are (****) = p<0.0001 and (***) = p = 0.0001. For statistical analysis we used the Welch’s t-test.
Figure 4.
Figure 4.. 3’ end RNAseq comparing effects on APA of knock downs in spermatocytes of different components of the cleavage machinery.
(A, B) Integrative Genomics Viewer (IGV) plots of 3’ end RNA sequencing reads for regions encoding the 3’UTR for the (A) Kpc2 and (B) Red genes. Regions of peaks that change in color show mismatches between the PolyA tail and the genome to highlight the 3’ end of the mRNA. (C) Heatmap of PolyA index quantified with PolyA Miner across 3’seq libraries. Orange indicates increased cleavage at the distal PAS in knock downs compared to controls, and blue indicates increased cleavage at the proximal PAS in knock downs compared to control. Each row represents one of the >500 genes that switch to a proximal PAS in wild-type spermatocytes compared to spermatogonia from Berry et al. (2022). Each column represents a component of the cleavage machinery that was knocked down in spermatocytes. The interval chosen to plot the PolyA index (−3,3) does not represent the maximum and minimum PolyA index observed. In this heatmap genes that showed a statistically non-significant PolyA index in all the samples or a negative PolyA index in all the samples were removed, and in all other cases PolyA indexes that were non-significant were put equal to zero (another heatmap with these genes showed is reported in SOM Figure 2) (D, E) Integrative Genomics Viewer (IGV) plots of 3’ end RNA sequencing libraries for the genes (D) oaf and (E) nudE. (F-H) Venn diagrams representing number of genes with polyA index > 0.5 in cbc knock down libraries (dark green), PCF11 VDRC knock down libraries (light green), PABP2 knock down libraries (red) and components of CstF complex (orange).
Figure 5.
Figure 5.. PCF11 and cbc transcripts are both upregulated in spermatocytes with cbc particularly highly expressed in testis compared to other tissues.
(A) Diagram adapted from FlyBase of PCF11 and cbc loci. Light blue boxes represent 5’UTRs, green and grey boxes represent exons and pink boxes represent 3’UTRs. Introns represented with a straight black line. In yellow are represented the transcripts regions targeted by HCR-FISH probes for RNA in situs. Green and dotted-dark green boxes above the PCF11 locus represent respectively the CID domain and a region in which the Cbc binding domain could be located. (B-G) Scope diagrams of Fly Cell Atlas single nuclear RNAseq data (Li et al. 2023) showing: (B) PCF11 and (C) cbc expression across all the analyzed adult tissues, (D) Purple marking nuclei from the testis plus seminal vesicle sample across all analyzed adult tissues, (E-G) Umap plots showing (E) PCF11 and (F) cbc expression in the testis plus semnal vesicle sample, (G) orange marking nuclei from the male germ-line clusters. (H-J) Confocal microscope images of apical tips of wild-type (w1118) testes hybridized with (H) probes against PCF11 long isoforms (white) and DAPI (blue), (I) probes against PCF11-RB isoform (white) and DAPI (blue), (J) probes against cbc (white) and DAPI (blue). In (H, I, J) the boxes highlight a region of spermatogonia (SG) zoomed in (H’, I’, J’) and a region of spermatocytes (SC) zoomed in (H’’, I’’, J’’). (K, L) Umap from Fly Cell Atlas single nuclear data from testis plus seminal vesicle sample showing PCF11-long (K) and PCF11-RB (L) expression across the different clusters. Scalebars are 50 uM in (H, I, J) and 20 uM in (H’, H’’, I’, I’’, J’, J’’).
Figure 6.
Figure 6.. knock down of PCF11 caused decrease of Cbc protein.
(A) Western Blots of wild-type (w1118) testis lysate probes with anti-PCF11. (B) Western Blots of HA:cbc homozygous testes lysate probed with anti-HA. (C) Immunoprecipitation (IP) of HA:cbc in wild-type (w1118) and HA:cbc homozygous testes followed by PAGE and western blots probed with anti-PCF11 or anti-HA. Input = 20% of lysate before IP. (D, E) IGV plots of (D) cbc and (E) PCF11 loci of RNAseq data from bamGal4 (control) samples (in grey), PCF11-RNAi-VDRC-103710;bamGal4 samples (magenta) and cbc-RNAi-BL-77426;bamGal4 samples (teal). (F-J) Immunofluorescence images showing apical tips of testes stained with anti-Vasa to mark germ cells, anti-HA, and anti-PCF11. (F-F’’) HA:cbc/CyO;bamGal4 (control), (G-G’’) HA:cbc/+,PCF11-RNAi-VDRC-103710;bamGal4, (H895 H’’) HA:cbc/+,PCF11-RNAi-NIG-10228R-4;bamGal4, (I-I’’) HA:cbc/+,cbc-RNAi-BL-77426;bamGal4 and (J-J’’) HA:cbc/+,cbc-RNAi-VDRC-100686;bamGal4. (K, L) Quantification of Fluorescence/Area from (K) HA antibodies (teal) and (L) PCF11 antibodies (magenta). For each testis 10 spermatogonial and 10 spermatocyte nuclei were quantified for both anti-PCF11 and anti-HA fluorescence and then averaged. For each genotype N=3 testes were quantified. Statistical analysis performed using the Welch’s t-test. p-values: bamGal4_PCF11 = 0.0011 (**), bamGal4_cbc = 0.0005 (***), PCF11-RNAi-NIG10228R-4_PCF11 = 0.0341 (*), cbc-RNAi-BL77427_PCF11 < 0.0001 (****), cbc-RNAi-VDRC100686_PCF11 = 0.0303 (*). Scalebars are 50 uM (F-J’’). Entire gels for western blots and co-IP are reported in SOM Figure 11.
Figure 7.
Figure 7.. Overexpression of PCF11 and Cbc in spermatogonia shifted cleavage towards the more proximal site for some transcripts.
(A-D) bam−/− testes stained with anti-Vasa, anti-HA and anti-V5. (A-A’’) bam mutant control lacking overexpression constructs (nosGal4/Y; +/CyO; bam86,bamGal4/bam1), (B-B’’) bam mutant testes overexpressing PCF11-RF-HA (nosGal4/Y; UAS>PCF11-RF-HA/+; bam86,bamGal4/bam1), (C-C’’) bam mutant testes overexpressing cbc-V5 (nosGal4/Y; UAS>cbc-V5/+; bam86,bamGal4/bam1), (D-D’’) bam mutant testes overexpressing both PCF11-RF-HA and cbc-V5 (nosGal4/Y; UAS>PCF11-RF-HA, UAS>cbc-V5/+; bam86,bamGal4/bam1). (E) Pink: quantification of nuclear/cytoplasmic ratio of PCF11-RF-HA in bam−/− testes overexpressing PCF11-RF-HA alone or PCF11-RF-HA plus cbc-V5. Blue: quantification of nuclear/cytoplasmic ratio of cbc-V5 in bam−/− testes overexpressing cbc-V5 alone or PCF11-RF-HA plus cbc-V5. For each sample N=5 testes were quantified. Statistical analysis was performed using the Welch’s t-test. p-values are 0.8103 (ns) and <0.0001 (****). (F) Immunoprecipitation (IP) of cbc-V5 from lysates of bam−/− testes in which either PCF11-RF-HA plus cbc-V5 or PCF11-RF-HA alone (control) were overexpressed, followed by PAGE and western blot probed with anti-HA and anti-V5 antibodies. Input = 20% of lysate before IP. (G) Venn diagram showing the number of genes that are affected in opposite APA directions by CFII knock downs (in green) or CFII overexpression (in red). The green circle represents all the genes that had a polyA index > 0.5 (lengthening) in either PCF11 or cbc knock downs, while the red circle all the genes that had a polyA index < −0.5 (shortening) in either PCF11-RF-HA overexpression, or cbc-V5 overexpression, or PCF11-RF-HA plus cbc-V5 overexpression. (H-K) IGV plots showing 3’ end seq reads from libraries for overexpression and knock down samples for the (H) Rop, (I) orb, (J) Mitofilin and (K) bor loci. OE=overexpression, SG=spermatogonia. (CTRL) = nosGal4/Y; +/+; bam86,bamGal4/bam1, (cbc OE) = nosGal4/Y; UAS>cbc-V5/+; bam86,bamGal4/bam1, (PCF11 OE) = NosGal4/Y; UAS>PCF11-RF-HA/+; bam86,bamGal4/bam1, (cbc + PCF11 OE) = nosGal4/Y; UAS>PCF11-RF-HA, UAS>cbc-V5/+; bam86,bamGal4/bam1.

Similar articles

References

    1. An J. J., Gharami K., Liao G. Y., Woo N. H., Lau A. G. et al., 2008. Distinct Role of Long 3` UTR BDNF mRNA in Spine Morphology and Synaptic Plasticity in Hippocampal Neurons. Cell. - PMC - PubMed
    1. Baker C. C., Gallicchio L., Matias N. R., Porter D. F., Parsanian L. et al., 2023. Cell-type-specific interacting proteins collaborate to regulate the timing of Cyclin B protein expression in male meiotic prophase. Development dev. 201709. - PMC - PubMed
    1. Bedbrook C. N., Nath R. D., Nagvekar R., Deisseroth K., and Brunet A., 2023. Rapid and precise genome engineering in a naturally short-lived vertebrate (Moons L., Stainier D. Y. R., Moons L., & Abitua P., Eds.). Elife 12: e80639. - PMC - PubMed
    1. Benoit B., Simonelig M., Nemeth A., Aulner N., Kuhn U. et al., 1999. The Drosophila poly(A)-binding protein II is ubiquitous throughout Drosophila development and has the same function in mRNA polyadenylation as its bovine homolog in vitro. Nucleic Acids Res. 27: 3771–3778. - PMC - PubMed
    1. Berry C. W., Olivares G. H., Gallicchio L., Ramaswami G., Glavic A. et al., 2022. Developmentally regulated alternate 3` end cleavage of nascent transcripts controls dynamic changes in protein expression in an adult stem cell lineage. Genes Dev. 36: 916–935. - PMC - PubMed

Publication types