[Preprint]. 2025 Sep 25:2024.03.20.585922.
doi: 10.1101/2024.03.20.585922.

Ether lipids influence cancer cell fate by modulating iron uptake

Affiliations

Ether lipids influence cancer cell fate by modulating iron uptake

Ryan P Mansell et al. bioRxiv. .

Abstract

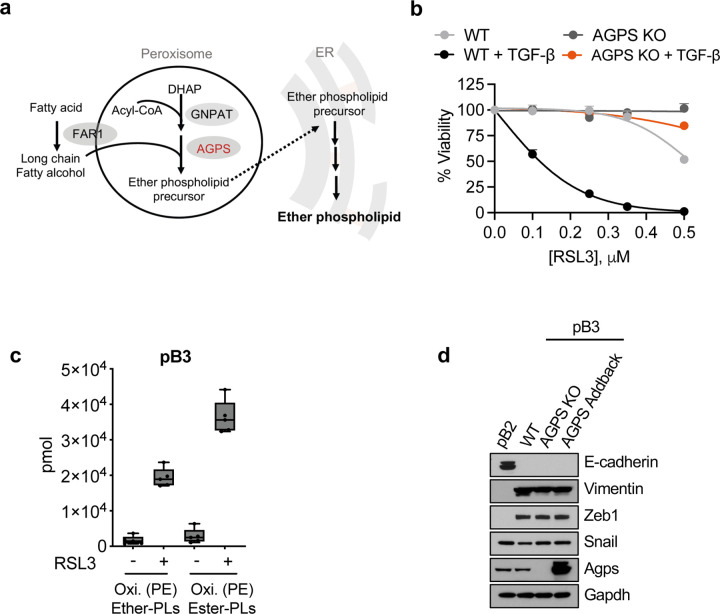
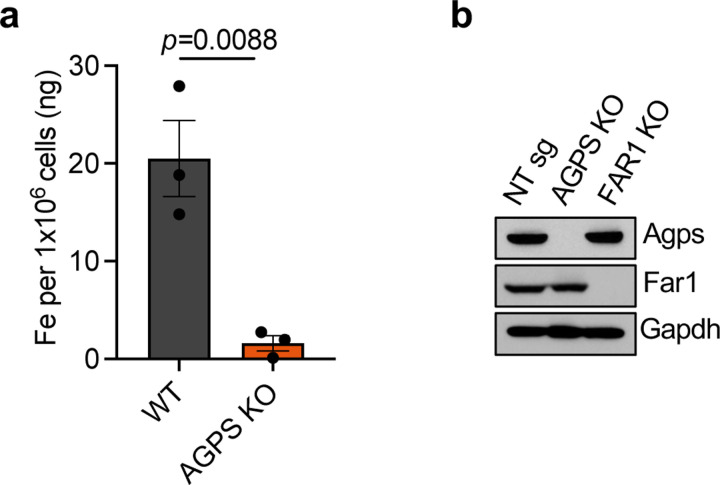
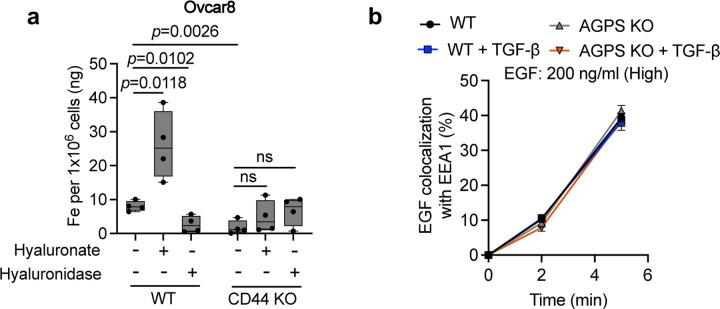
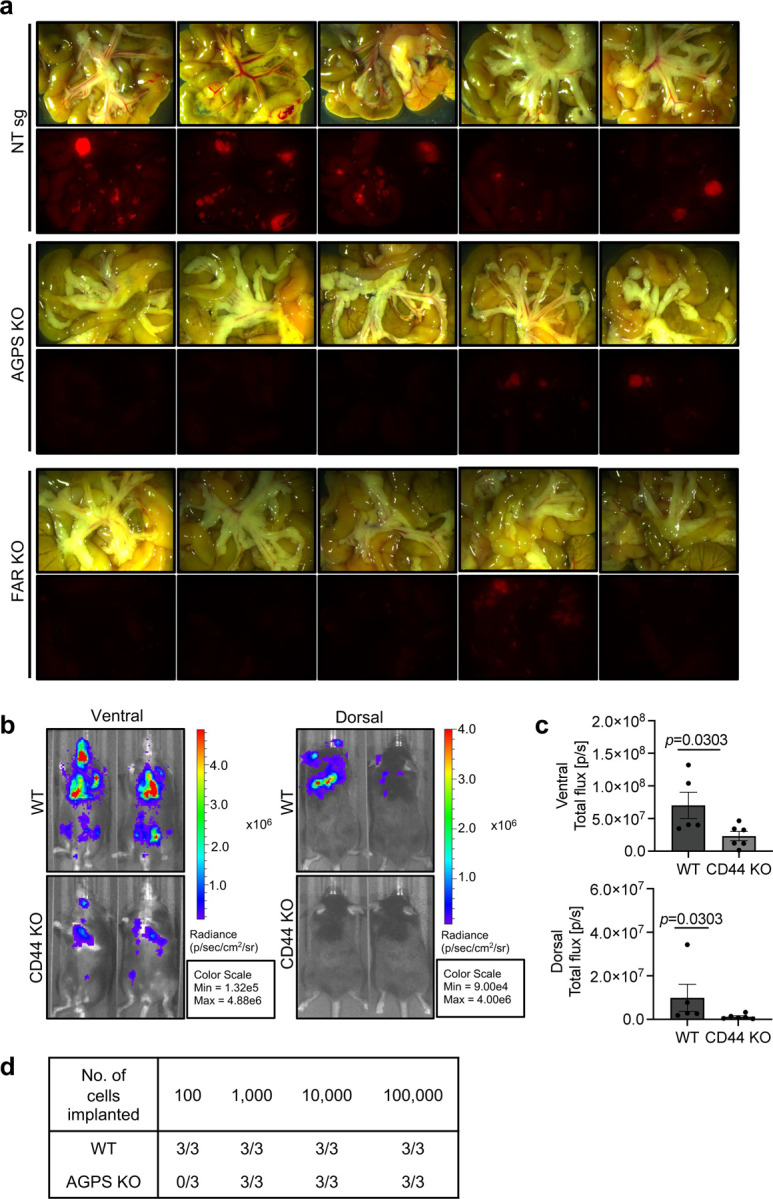
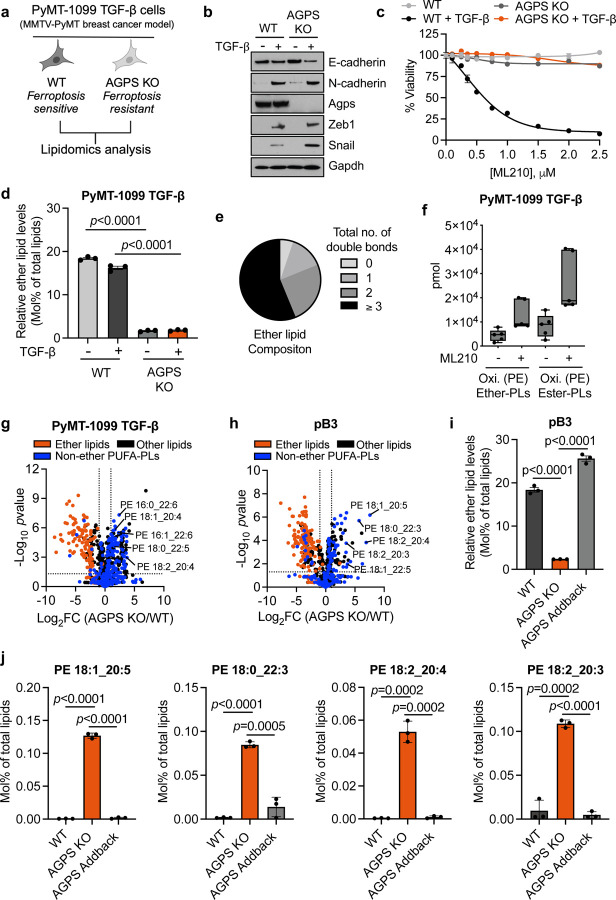
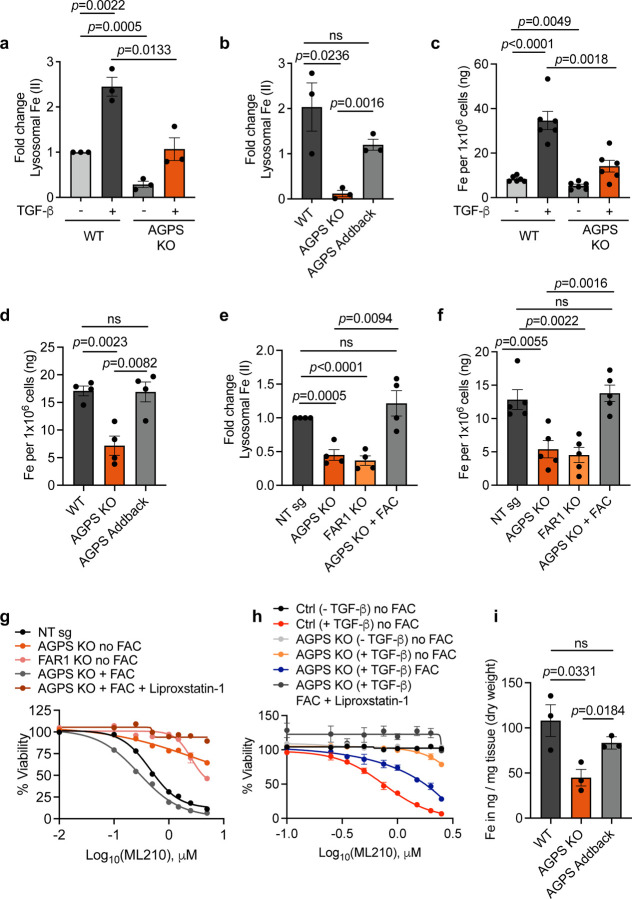
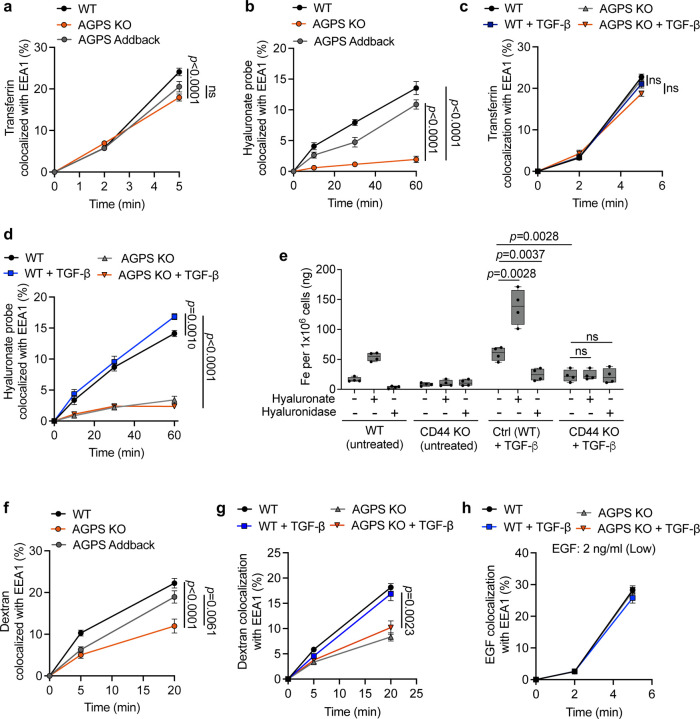
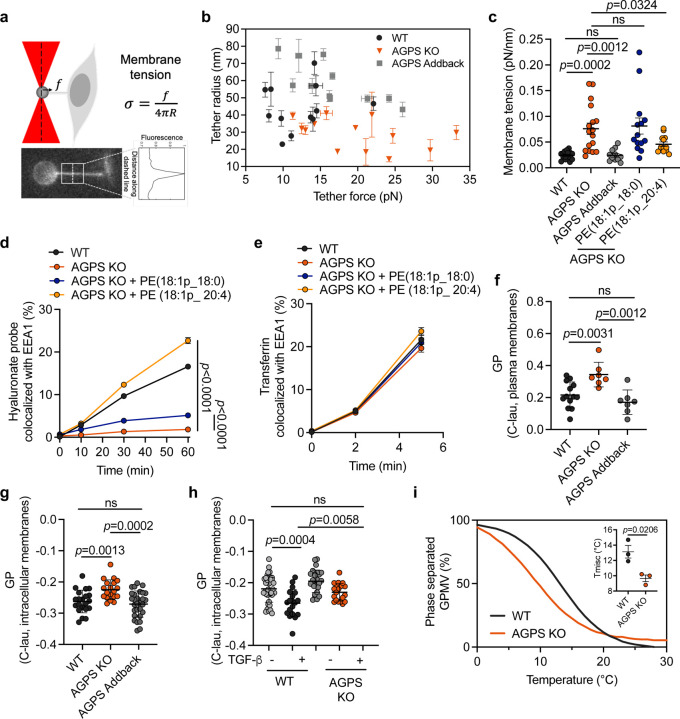
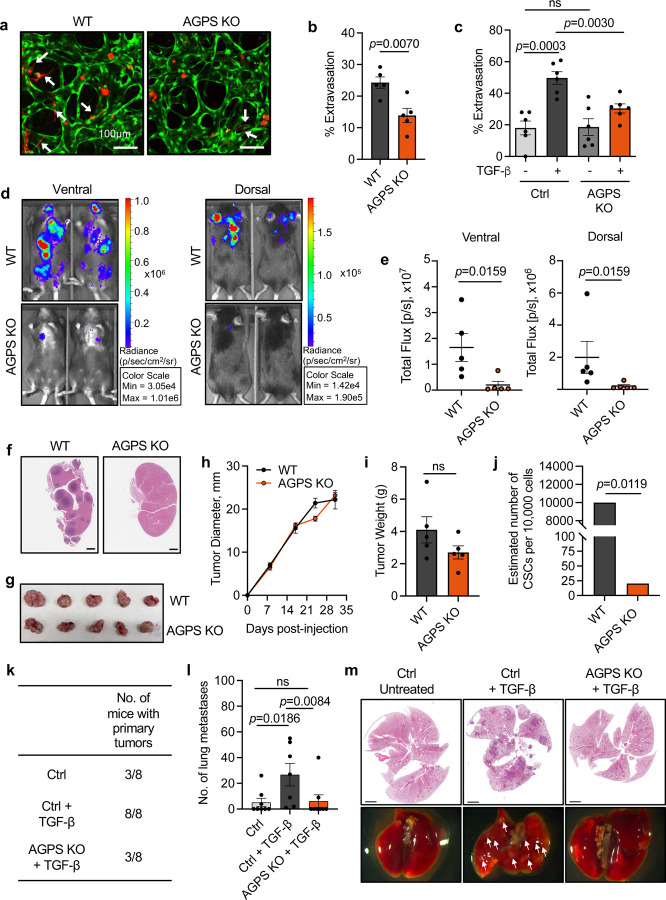
Cancer cell fate has been widely ascribed to mutational changes within protein-coding genes associated with tumor suppressors and oncogenes. In contrast, the mechanisms through which the biophysical properties of membrane lipids influence cancer cell survival, dedifferentiation and metastasis have received little scrutiny. Here, we report that cancer cells endowed with high metastatic ability and cancer stem cell-like traits employ ether lipids to maintain low membrane tension and high membrane fluidity. Using genetic approaches and lipid reconstitution assays, we show that these ether lipid-regulated biophysical properties permit non-clathrin-mediated iron endocytosis via CD44, resulting in significant increases in intracellular redox-active iron and enhanced ferroptosis susceptibility. Using a combination of in vitro three-dimensional microvascular network systems and in vivo animal models, we show that loss of ether lipids from plasma membranes also strongly attenuates extravasation, metastatic burden and cancer stemness. These findings illuminate a mechanism whereby ether lipids in carcinoma cells serve as key regulators of malignant progression while conferring a unique vulnerability that can be exploited for therapeutic intervention.

Keywords: CD44; Ether lipids; endocytosis; ferroptosis; iron; membrane tension; metastasis.


Conflict of interest statement

COMPETING INTERESTS The authors declare no competing interests.

Figures

Extended Data Fig. 1
a. Immunoblot analysis for EMT markers and TGF-β signaling in PyMT-1099 WT or AGPS KO cells. Where indicated cells were treated with TGF-β (2 ng/ml) for 10 d. b. Cell viability following treatment with the GPX4 inhibitor ML210 for 72 h. PyMT-1099 WT or AGPS KO cells were pretreated with TGF-β (2 ng/ml) for 10 d prior to assay. Graph is representative of three independent biological replicates. Data shown as mean +/− SEM. c. Amount in pmol of oxidized phosphatidylethanolamine (Oxi. PE) ether and ester phospholipids in pB3 cells treated with RSL3 or vehicle control for 24 hours. Five biological replicates per condition. 100,000 cells were used for lipid extraction in each condition. Data shown as mean +/− SEM. Statistical significance was calculated using unpaired, two-tailed t-test. d. Immunoblot analysis for AGPS expression in mesenchymal-enriched pB3 WT, AGPS KO, and AGPS addback cells. pB2 cells served as a control for expression of epithelial-like markers. For panel a: PyMT-1099 WT and AGPS KO cells were transduced with the respective vector control plasmids. For panel d: pB3 WT and AGPS KO cells were transduced with the respective vector control plasmids.
Extended Data Fig. 2
a. Relative abundance of lipid classes in PyMT-1099 WT and AGPS KO cells treated with TGF-β (2 ng/ml, 10 d). Lipid classes include triacylglycerol (TAG), sphingomyelin (SM), phosphatidylserine (PS), phosphatidylinositol (PI), phosphatidylglycerol (PG), phosphatidylethanolamine (PE), ether phosphatidylethanolamine (PE O-), phosphatidylcholine (PC), ether phosphatidylcholine (PC O-), phosphatidic acid (PA), lysophosphatidylserine (LPS), lysophosphatidylinositol (LPI), lysophosphatidylglycerol (LPG), lysophosphatidylethanolamine (LPE), lysophosphatidylcholine (LPC), ether lysophosphatidylethanolamine (LPEO-), ether lysophosphatidylcholine (LPCO-), lysophosphatidic acid (LPA), hexosylceramide (HexCer), diacylglycerol (DAG), cardiolipin (CL), ceramide (Cer), and cholesteryl ester (CE). b. Bar plot showing the distribution of saturation levels (total number of double bonds) among membrane lipid species present in PyMT-1099 WT and AGPS KO cells treated with TGF-β (2 ng/ml, 10 d). c. Quantification of the relative abundance of non-ether polyunsaturated phosphatidylethanolamine (PUFA PE) species in PyMT-1099 WT and AGPS KO cells treated with TGF-β (2 ng/ml, 10 d). d. Quantification of the relative abundance of non-ether polyunsaturated phosphatidylcholine (PUFA PC) species in PyMT-1099 WT and AGPS KO cells treated with TGF-β (2 ng/ml, 10 d). All data shown as the mean +/− SEM of 3 replicates. Statistical significance was calculated using unpaired, two-tailed t-test.
Extended Data Fig. 3
a. Relative abundance of lipid classes in WT, AGPS KO, and AGPS addback pB3 cells. Lipid classes include triacylglycerol (TAG), sphingomyelin (SM), phosphatidylserine (PS), phosphatidylinositol (PI), phosphatidylglycerol (PG), phosphatidylethanolamine (PE), ether phosphatidylethanolamine (PE O-), phosphatidylcholine (PC), ether phosphatidylcholine (PC O-), phosphatidic acid (PA), lysophosphatidylserine (LPS), lysophosphatidylinositol (LPI), lysophosphatidylglycerol (LPG), lysophosphatidylethanolamine (LPE), lysophosphatidylcholine (LPC), ether lysophosphatidylethanolamine (LPEO-), ether lysophosphatidylcholine (LPCO-), lysophosphatidic acid (LPA), hexosylceramide (HexCer), diacylglycerol (DAG), cardiolipin (CL), ceramide (Cer), and cholesteryl ester (CE). b. Hierarchical clustering heatmap of polyunsaturated phosphatidylethanolamine (PUFA PE) species based on abundance (mol% of total lipids) in WT, AGPS KO, and AGPS addback pB3 cells. A sample variance of greater than 10 was used as a filter for representing species within the heatmap. c. Hierarchical clustering heatmap of polyunsaturated phosphatidylcholine (PUFA PC) species based on abundance (mol% of total lipids) in WT, AGPS KO, and AGPS addback pB3 cells. A sample variance of greater than 10 was used as a filter for representing species within the heatmap. d. Bar plot quantifying the relative abundance of non-ether PUFA PC species in WT, AGPS KO, and AGPS addback pB3 cells. e. Bar plot quantifying the relative abundance of non-ether PUFA PE species in WT, AGPS KO, and AGPS addback pB3 cells. f. Bar plot showing the distribution of saturation levels (total number of double bonds) among membrane lipid species present in WT, AGPS KO, and AGPS addback pB3 cells. All samples were analyzed with 3 biological replicates and represented as the mean +/− SEM. Statistical significance was calculated using one-way ANOVA with Tukey’s multiple comparisons test; ns, not significant. pB3 WT and AGPS KO cells were transduced with the respective vector control plasmids.
Extended Data Fig. 4
a. ICP-MS of cellular iron in the mesenchymal-enriched 687g WT and AGPS KO murine breast cancer cell line. All shown as the mean +/− SEM of 3 replicates. Statistical significance was calculated using unpaired, two-tailed t-test. b. Immunoblot analysis of OVCAR8 AGPS KO, FAR1 KO or nontargeting sg (WT) cells.
Extended Data Fig. 5
a. Representative confocal images showing internalization of transferrin (red) and colocalization with the early endosome marker EEA1 (green) at 0, 2, and 5 minutes in WT, AGPS KO, and AGPS addback pB3 cells. Scale bar: 10 μm. b. Representative confocal images showing internalization of fluorescently labeled hyaluronate probe (red) and colocalization with EEA1 (green) at 0, 10, 30, and 60 minutes in WT, AGPS KO, and AGPS addback pB3 cells. Scale bar: 10 μm. c. Representative confocal images of transferrin (red) and EEA1 (green) colocalization at 0, 2, and 5 minutes in WT and AGPS KO PyMT-1099 cells +/− TGF-β pre-treatment (2 ng/ml; 10 d). Scale bar: 10 μm. d. Representative confocal images showing internalization of fluorescently labeled hyaluronate probe (red) and EEA1 (green) at 0, 10, 30, and 60 minutes in WT and AGPS KO PyMT-1099 cells +/− TGF-β pre-treatment (2 ng/ml; 10 d). Scale bar: 10 μm. e. Representative confocal images showing dextran (red) internalization and colocalization with EEA1 (green) at 0, 2, and 5 minutes in WT, AGPS KO, and AGPS addback pB3 cells. Scale bar: 10 μm. f. Representative confocal images of dextran (red) and EEA1 (green) at 0, 5, and 20 minutes in WT and AGPS KO PyMT-1099 cells +/− TGF-β pre-treatment (2 ng/ml; 10 d). Scale bar: 10 μm. For panels a, b & e: pB3 WT and AGPS KO cells were transduced with the respective vector control plasmids. Examined n=10 fields of cells per experimental sample and at least two independent replicates were performed.
Extended Data Fig. 6
a. Representative confocal images showing EGF (red) internalization and colocalization with EEA1 (green) at 0, 2, and 5 minutes in WT and AGPS KO PyMT-1099 cells +/− TGF-β pre-treatment (2 ng/ml; 10 d). Scale bar: 10 μm. Cells were treated with 2 ng/ml Alexa 555-conjugated EGF. b. Representative confocal images of hyaluronate layered nanoparticle (red) and EEA1 (green) colocalization at 0, 10, 30, and 60 minutes in pB3 WT, AGPS KO, and AGPS KO supplemented with polyunsaturated fatty acid (PUFA) BSA conjugate (C22:6). Scale bar: 10 μm. c. Representative confocal images of hyaluronate layered nanoparticle (red) and EEA1 (green) colocalization at 0, 10, 30, and 60 minutes in WT, AGPS KO, and AGPS KO pB3 cells pre-treated with the indicated liposome supplementations PE (18:0_20:4), PE (18:1p_20:4), and PC (18:1p_20:4) for 16–18 hr. Scale bar: 10 μm. d. Representative confocal images of fluorescently labeled hyaluronate probe (red) and EEA1 (green) colocalization at 0, 10, 30, and 60 minutes in WT, AGPS KO, and AGPS KO pB3 cells supplemented with liposomes composed of ether PE species 18:1p_18:1 and 18:1p_20:4. Scale bar: 10 μm. e. Representative confocal images showing transferrin (red) and EEA1 (green) colocalization at 0, 2, and 5 minutes in WT, AGPS KO, and AGPS KO pB3 cells supplemented with defined ether PE species (18:1p_18:1 and 18:1p_20:4). Scale bar: 10 μm. Examined n=10 fields of cells per experimental sample for all experiments and at least two independent replicates were performed.
Extended Data Fig. 7
a. Representative confocal images of EGF colocalization with an early endosomal marker (EEA1) in PyMT-1099 WT or AGPS KO cells pretreated with 2 ng/ml TGF-β for 10 days. Cells were treated with 200 ng/ml EGF. b. Quantification of co-localization EGF as assessed displayed in panel a. All data shown as mean +/− SEM. c. Representative confocal images of giant plasma membrane vesicles GPMVs budding from WT, AGPS KO, and AGPS addback pB3 cells stained with FAST DiO dye. Scale bars: 10 μm. d. Quantification of membrane tension in pB3 WT and CD44 KO. All data shown as mean +/− SEM. Statistical significance was calculated using unpaired, two-tailed t-test. e. Graph showing tether radius (R) and tether force measurements (f) in pB3 WT and CD44 KO cells. All data shown as mean +/− SD. f. Boxplots quantifying total iron content via ICP-MS (ng Fe per 1×10 cells) in WT and CD44 KO OVCAR8 cells treated with hyaluronic acid or hyaluronidase as indicated. Data shown as mean +/− SEM. As this experiment serves as validation of a prior findings, we tested the shown comparisons using one-sided Welch’s t-tests without multiple-testing correction. Examined n=10 fields of cells per experimental sample for endocytosis-related experiments. Four independent replicates were measured for ICP-MS data. For panel c: pB3 WT and AGPS KO cells were transduced with the respective vector control plasmids.
Extended Data Fig. 8
a. Immunoblot analysis of CtBP1 and PICK1 protein expression following siRNA-mediated knockdown (siCtBP1, siPICK1) or control siRNA (siCtrl) in pB3 cells. γ-Tubulin serves as a loading control. b. Scatter plots quantifying lysosomal iron (measured as mean fluorescence intensity, MFI, of HRhoNox-M) in pB3 cells transfected with siCtrl, siCtBP1, or siPICK1 for 72 hr. Each point represents an independent replicate. c. Scatter plots quantifying lysosomal iron (measured as mean fluorescence intensity, MFI, of HRhoNox-M) in pB3 cells treated with vehicle, cytochalasin D, or 7-keto-cholesterol for 30 minutes. Each point represents an independent replicate. d. Representative confocal images showing hyaluronate-layered nanoparticle (red) internalization and colocalization with early endosome marker EEA1 (green) at 0, 10, 30, and 60 minutes in WT pB3 cells under the following treatments: no treatment, siCtBP1, and cytochalasin D. Data is representative of at least 2 independent experiments. Scale bar: 10 μm. e. Representative confocal images showing hyaluronate-layered nanoparticle (red) internalization and colocalization with early endosome marker EEA1 (green) in pB3 cells at 0, 10, 30, and 60 minutes in WT pB3 cells under the following treatments: no treatment, siPICK1, and 7-keto-cholesterol. Data is representative of at least 2 independent experiments. Scale bar: 10 μm. f. Quantification of the percentage of hyaluronate-layered nanoparticle labeled endosomes colocalized with EEA1 in pB3 cells over time (0–60 min) in the indicated treatment groups: No treatment, siCtBP1, or cytochalasin D. Examined n=10 fields of cells per experimental sample. Data is representative of at least 2 independent experiments. g. Quantification of the percentage of hyaluronate-layered nanoparticle labeled endosomes colocalized with EEA1 in pB3 cells over time (0–60 min) in the indicated treatment groups: No treatment, siPICK1, or 7-keto-cholesterol. Examined n=10 fields of cells per experimental sample. Data is representative of at least 2 independent experiments. h. Total iron content (ng Fe per 1×10⁶ cells) in pB3 cells transfected with siCtrl, siCtBP1, or siPICK1 as quantified by ICM-MS. Each point represents an independent replicate. All data shown as mean +/− SEM and statistical significance was calculated using one-way ANOVA with Dunnett’s multiple comparisons test; ns, not significant. In some cases, error bars may be obscured by data points.
Extended Data Fig. 9
a. Bar plot showing the abundance (mol% of total lipids) of each major lipid class in isolated giant plasma membrane vesicles (GPMVs) from WT, AGPS KO and AGPS addback pB3 cells. Lipid classes include diacylglycerol (DAG), sphingomyelin (SM), phosphatidylserine (PS), phosphatidylinositol (PI), phosphatidylglycerol (PG), phosphatidylethanolamine (PE), ether phosphatidylethanolamine (PEO-), phosphatidylcholine (PC), ether phosphatidylcholine (PCO-), phosphatidic acid (PA), lysophosphatidylserine (LPS), lysophosphatidylinositol (LPI), lysophosphatidylethanolamine (LPE), lysophosphatidylcholine (LPC), ether lysophosphatidylethanolamine (LPEO-), ether lysophosphatidylcholine (LPCO-), hexosylceramide (HexCer), cardiolipin (CL), ceramide (Cer), cholesteryl ester (CE), cholesterol (Chol) and triacylglycerol (TAG). b. Enrichment PS and SM lipid abundance (mol% of total lipids) in WT, AGPS KO, and AGPS addback pB3 derived GPMVs compared to whole cell extracts. c. Bar plot showing the distribution of relative phospholipid levels according to the total number of double bonds per lipid species in GPMVs derived from WT, AGPS KO, and AGPS addback pB3 cells. d. Quantification of total ether lipid levels (mol% of total lipids) in WT, AGPS KO, and AGPS addback pB3 derived GPMVs. e. Volcano plot showing the log2(fold change) in the relative abundance of various lipid species present in GPMVs upon knockout of AGPS in pB3 cells. Blue indicates non-ether linked polyunsaturated phospholipids; red indicates all ether lipids identified in lipidomic analysis and black denotes all other lipids identified. f. Quantification of the relative levels (mol% of total lipids) of non-ether polyunsaturated phosphatidylethanolamine or phosphatidylcholine lipids (PC or PE) in WT, AGPS KO, and AGPS addback pB3 cells. All data shown as mean +/− SEM and statistical significance was calculated using one-way ANOVA with Tukey’s multiple comparisons test; ns, not significant. pB3 WT and AGPS KO cells were transduced with the respective vector control plasmids.
Extended Data Fig. 10
a. Bright-field (top) and fluorescence images (bottom) showing mesenteric metastases from athymic nude mice injected with tdTomato-labeled OVCAR8 NT sg, AGPS KO and FAR1 KO cells via the intraperitoneal route. b. Representative in vivo imaging system (IVIS) images of overall metastatic burden in C57BL/6 female mice following intracardiac injection of GFP-luciferized pB3 WT (n=5) and CD44 KO (n=6) cells. c. Quantification of overall metastatic burden in C57BL/6 female mice following intracardiac injection of GFP-luciferized pB3 WT (n=5) and CD44 KO (n=6) cells. Data shown as mean +/− SEM. Statistical significance was calculated using the Mann-Whitney test. d. Bar plot showing the in vitro mammosphere formation efficiency of pB3 WT and AGPS KO cells over three passages. Data is representative of three independent biological replicates. Data shown as mean +/− SEM. Statistical significance was calculated using unpaired, two-tailed t-test. e. Table showing number of pB3 WT or AGPS KO cells implanted per mouse and number of mice with tumors after 39 days.
Extended Data Fig. 11
a. Immunoblot showing the expression of various EMT markers in MCF7 cells treated with vehicle control or oncostatin M (OSM, 100 ng/mL) for 72 hr. γ-Tubulin serves as a loading control. b. Representative flow cytometry plots of CD44 (AF647) and CD24 (BV605) staining in MCF7 cells treated with vehicle control or OSM (100 ng/mL) for 72 hr. Percentage of CD44lo/CD24hi cells and CD44hi/CD24lo is indicated. Data is representative of at least two independent experiments. c. Scatter plot quantifying total iron (ng Fe per 1×10 cells) in vehicle control or OSM (100 ng/mL; 72 hr) treated MCF7 cells. Each point represents a biological replicate. d. Bar plot showing the mol% of total lipids for each major lipid class in vehicle control and OSM treated MCF7 cells. Lipid classes include triacylglycerol (TAG), sphingomyelin (SM), phosphatidylserine (PS), phosphatidylinositol (PI), phosphatidylglycerol (PG), phosphatidylethanolamine (PE), ether phosphatidylethanolamine (PEO-), phosphatidylcholine (PC), ether phosphatidylcholine (PCO-), phosphatidic acid (PA), lysophosphatidylserine (LPS), lysophosphatidylinositol (LPI), lysophosphatidylethanolamine (LPE), lysophosphatidylglycerol (LPG), lysophosphatidylcholine (LPC), ether lysophosphatidylethanolamine (LPEO-), ether lysophosphatidylcholine (LPCO-), lysophosphatidic acid (LPA), hexosylceramide (HexCer), diacylglycerol (DAG), cardiolipin (CL), ceramide (Cer), and cholesteryl ester (CE). Inset shows low abundance lipid species. e. Relative abundance (mol% of membrane lipids) of individual ether lipid species in vehicle control and OSM treated MCF7 cells (100 ng/mL; 72 hr). f. Quantification of saturation levels (total number of double bonds) among membrane ether lipid species in vehicle and OSM treated MCF7 cells. g. Quantification of the levels (mol% of membrane lipids) of ether polyunsaturated fatty acid (PUFA) PE and PC species in vehicle control and OSM treated MCF7 cells (100 ng/mL; 72 hr). All data shown as mean +/− SEM and unless otherwise noted, statistical significance was calculated using unpaired, two-tailed t-test.
Extended Data Fig. 12
a. Relative abundance of lipid classes in TGF-β-treated (2 ng/ml; 10 d) PyMT-1099 WT cells compared to untreated control. Lipid classes include: triacylglycerol (TAG), sphingomyelin (SM), phosphatidylserine (PS), phosphatidylinositol (PI), phosphatidylglycerol (PG), phosphatidylethanolamine (PE), ether phosphatidylethanolamine (PE O-), phosphatidylcholine (PC), ether phosphatidylcholine (PC O-), phosphatidic acid (PA), lysophosphatidylserine (LPS), lysophosphatidylinositol (LPI), lysophosphatidylethanolamine (LPE), lysophosphatidylcholine (LPC), ether lysophosphatidylethanolamine (LPEO-), ether lysophosphatidylcholine (LPCO-), lysophosphatidylglycerol (LPG), lysophosphatidic acid (LPA), hexosylceramide (HexCer), diacylglycerol (DAG), cardiolipin (CL), ceramide (Cer), and cholesteryl ester (CE). Data shown as mean +/− SEM. Inset shows low abundance lipid species. b. Bar plot showing the distribution of ether phospholipids +/− SEM according to the number of double bonds per species (mol% of membrane lipids) in WT and TGFβ-treated WT cells. Data shown as mean +/− SEM. c. Dot plot showing the calculated Log2(fold change) of ether phospholipids with an adjusted p value less than or equal to 0.02 in PyMT-1099 TGF-β-treated (2 ng/ml; 10 d) cells relative to untreated (Ctrl) cells. Red dots indicate ether phospholipids containing polyunsaturated fatty acids (PUFA) at both sn-1 and sn-2 positions. Blue dot indicates ether phospholipids containing only saturated (SA) or monounsaturated (MUFA) fatty acids at both sn-1 and sn-2 positions. Black dot indicates all other ether phospholipids.
Fig. 1:
Fig. 1:. Ether lipids play a key role in maintaining a ferroptosis susceptible cell state.
a. Schematic of peroxisomal-ether lipid biosynthetic pathway. b. Cell viability following treatment with the GPX4 inhibitor RSL3 for 72 h. PyMT-1099 WT, AGPS KO, or AGPS addback cells were pretreated with TGF-β (2 ng/ml) for 10 d prior to assay. Data shown as mean +/− SEM. Graph is representative of three independent biological replicates. c. Bar graph showing percent of total lipids constituted by ether lipids following AGPS KO in untreated wildtype (WT) or TGF-β-treated (2 ng/ml;10 d) PyMT-1099 cells. d. Pie chart showing the relative proportion of ether lipids with various total numbers of double bonds. e. Amount in pmol of oxidized phosphatidylethanolamine (Oxi. PE) ether and ester phospholipids in PyMT-1099 TGF-β cells treated with ML210 or vehicle control for 24 h. Five biological replicates per condition. 100,000 cells were used for lipid extraction in each condition. Statistical significance was calculated by unpaired, two-tailed t-test; ns, not significant. f. Volcano plot showing the log2 fold change in the relative abundance of various lipid species upon knockout of AGPS in PyMT-1099 TGF-β-treated cells. Blue indicates non-ether linked polyunsaturated phospholipids (PUFA-PLs), red indicates all ether lipids identified in lipidomic analysis and black denotes all other lipids identified. g. Volcano plot showing the log2 fold change in the relative abundance of various lipid species upon knockout of AGPS in pB3 cells. Blue indicates non-ether linked polyunsaturated phospholipids (PUFA-PLs), red indicates all ether lipids identified in lipidomic analysis and black denotes all other lipids identified. h. Bar graph showing the percent of total lipids constituted by ether lipids in pB3 WT, pB3 AGPS KO and pB3 AGPS addback cells. i. Bar graphs showing the effects of ether lipids on the relative abundance of selected polyunsaturated diacyl phospholipids in pB3 cells. All lipidomic data were analyzed in triplicate and shown as the mean +/− SEM. Unless otherwise stated statistical significance was calculated by one-way ANOVA with Tukey’s multiple comparisons test; ns, not significant. For panel b: PyMT-1099 WT and AGPS KO cells were transduced with the respective vector control plasmids. For panels h-i: pB3 WT and AGPS KO cells were transduced with the respective vector control plasmids.
Fig. 2:
Fig. 2:. Ether lipids regulate cellular redox-active iron levels in cancer cells.
a. Relative lysosomal iron levels based on HRhoNox-M fluorescence intensity normalized to the fluorescence intensity of lysotracker. Fold change is calculated relative to the average of untreated PyMT-1099 wild-type (WT) cells. Statistical significance was calculated by one-way ANOVA with Holm-Šídák multiple comparisons test; ns, not significant. b. Relative lysosomal iron levels based on HRhoNox-M fluorescence intensity normalized to the fluorescence intensity of lysotracker. Fold change is calculated relative to the average of pB3 WT cells. Statistical significance was calculated by one-way ANOVA with Holm-Šídák multiple comparisons test; ns, not significant. c. Inductively coupled plasma-mass spectrometry (ICP-MS) of cellular iron in PyMT-1099 WT or AGPS KO cells pretreated with 2 ng/ml TGF-β for 10 d. Statistical significance was calculated by one-way ANOVA with Tukey’s multiple comparisons test; ns, not significant. d. Inductively coupled plasma-mass spectrometry (ICP-MS) of cellular iron in pB3 cell line derivatives. Statistical significance was calculated by one-way ANOVA with Tukey’s multiple comparisons test; ns, not significant. e. Relative lysosomal iron levels in OVCAR8 NT sg, FAR1 KO or AGPS KO cells pretreated with ferric ammonium citrate FAC (50 μg/ml) for 24 h. Data shown are based on HRhoNox-M fluorescence intensity normalized to lysotracker fluorescence intensity. Fold change is calculated relative to the average of NT sg cells. Statistical significance was calculated by one-way ANOVA with Holm-Šídák multiple comparisons test; ns, not significant. f. ICP-MS of cellular iron in OVCAR8 NT sg, FAR1 KO or AGPS KO cells pretreated with FAC (50 μg/ml) for 24 h. Statistical significance was calculated by one-way ANOVA with Tukey’s multiple comparisons test; ns, not significant. g. Cell viability of OVCAR8 NT sg, FAR1 KO or AGPS KO cells pretreated with or without FAC (50 μg/ml) for 24 h followed by ML210 treatment for 72 h. Liproxstatin-1 (0.2 μM) was added at the time of ML210. Data representative of 3 independent experiments. h. Cell viability in response to ML210 treatment. PyMT-1099 WT or AGPS KO cells were pretreated with or without TGF-β (2 ng/ml) for 10 days followed by FAC treatment (100 μg/ml) for an additional 24 h. Cells were then treated with ML210 in the presence or absence of liproxstatin-1 (0.2μM) and cell viability was assessed after 72 h. Data representative of 3 independent experiments. i. ICP-MS of cellular iron from primary tumors derived from pB3 WT, pB3 AGPS KO, and pB3 AGPS addback cells. Mean +/− SEM from 3 independent tumor samples per condition. Each datapoint represents iron levels from independent tumor samples. Group differences were tested by permutation ANOVA followed by one tailed Welch’s t-tests with Holm correction for multiple comparisons. Unless otherwise noted, all samples were analyzed with 3–6 independent biological replicates and shown as the mean +/− SEM. For panels b, d & i: pB3 WT and AGPS KO cells were transduced with the respective vector control plasmids. Abbreviation: NT – nontargeting.
Fig. 3:
Fig. 3:. Ether lipids facilitate CD44-mediated iron endocytosis.
a. Endocytic transport of fluorescently labeled transferrin as assessed by quantitative colocalization with an early endosomal marker (EEA1) in pB3 WT, AGPS KO, and AGPS addback cells. b. Endocytic transport of fluorescently labeled hyaluronate probe as assessed by quantitative colocalization with an early endosomal marker (EEA1) in pB3 WT, AGPS KO, and AGPS addback cells. c. Endocytic transport of fluorescently labeled transferrin as assessed by quantitative colocalization with an early endosomal marker (EEA1) in PyMT-1099 WT or AGPS KO cells pretreated with or without 2 ng/ml TGF-β for 10 d. d. Endocytic transport of fluorescently labeled hyaluronate probe as assessed by quantitative colocalization with an early endosomal marker (EEA1) in PyMT-1099 WT or AGPS KO cells pretreated with or without 2 ng/ml TGF-β for 10 d. e. Inductively coupled plasma-mass spectrometry ICP-MS of cellular iron following treatment with either hyaluronic acid or hyaluronidase in PyMT-1099 WT or CD44 KO cells pretreated with or without 2 ng/ml TGF-β for 10 d. f. Endocytic transport of dextran as assessed by quantitative colocalization with the early endosomal marker EEA1 in pB3 WT, AGPS KO, and AGPS addback cells. g. Endocytic transport of dextran as assessed by quantitative colocalization with the early endosomal marker EEA1 in PyMT-1099 WT or AGPS KO cells pretreated with or without 2 ng/ml TGF-β for 10 d. h. Endocytosis of EGFR as assessed by quantitative colocalization of internalized fluorescently labeled EGF with an early endosomal marker (EEA1) in PyMT-1099 WT or AGPS KO cells pretreated with or without 2 ng/ml TGF-β for 10 days. Cells were treated with 2 ng/ml Alexa 555-conjugated EGF. i. Endocytic transport of hyaluronate-layered nanoparticle assessed by quantitative colocalization of internalized nanoparticles with an early endosomal marker (EEA1) in pB3 WT or AGPS KO cells with or without pre-treatment with polyunsaturated fatty acid (PUFA) BSA conjugate (C22:6). j. Endocytic transport of hyaluronate-layered nanoparticle assessed by quantitative colocalization of internalized nanoparticles with an early endosomal marker (EEA1) in pB3 WT or AGPS KO cells pre-treated (16–18 hr) with liposomes composed of the following: PE (18:0_20:4), PE (18:1p_20:4), and PC (18:1p_20:4). All data shown as mean +/− SEM and statistical significance was calculated by one-way ANOVA with Tukey’s multiple comparisons test; ns, not significant. Examined n=10 fields of cells per experimental sample for all endocytosis-related experiments and at least two independent replicates were performed. In some cases, error bars are smaller than the symbol size and not visible. ICP-MS experiments were performed with n=4. For panels a, b & f: pB3 WT and AGPS KO cells were transduced with the respective vector control plasmids.
Fig. 4:
Fig. 4:. Ether lipid deficiency impairs membrane biophysical properties.
a. Schematic of membrane tether pulling assay and fluorescence image showing a tether pulled from the plasma membrane of a pB3 cell using an optically trapped 4 μm anti-Digoxigenin coated polystyrene bead. b. Graph showing tether radius (R) and tether force measurements (f) in pB3 WT, AGPS KO, and AGPS addback cells. All data shown as mean +/− SD. c. Membrane tension measurements in pB3 WT, AGPS KO pretreated with 20μM of the indicated ether phospholipid liposomes, and AGPS addback cells. All data shown as mean +/− SEM. d. Endocytic transport of fluorescently labeled hyaluronate probe as assessed by quantitative colocalization with an early endosomal marker (EEA1) in pB3 WT or AGPS KO cells pretreated with 20μM of the indicated ether phospholipid liposomes. All data shown as mean +/− SEM. e. Endocytic transport of fluorescently labeled transferrin as assessed by quantitative colocalization with an early endosomal marker (EEA1) in pB3 WT or AGPS KO cells pretreated with 20μM of the indicated ether phospholipid liposomes. All data shown as mean +/− SEM. f. Generalized polarization (GP) values of C-laurdan-labeled plasma membranes from pB3 WT, AGPS KO and AGPS addback cells. Data is shown as mean GP +/− SD. g. GP values of C-laurdan-labeled intracellular membranes from pB3 WT, AGPS KO and AGPS addback cells. Data is shown as mean GP +/− SD. h. GP values of C-laurdan-labeled intracellular membranes from PyMT-1099 WT or AGPS KO cells treated with or without 2 ng/ml TGF-β for 10 d. Data shown as mean GP +/− SD. i. Representative curves showing giant plasma membrane vesicle (GPMV) phase separation from AGPS KO versus WT pB3 cells. Curves were generated by counting ≥ 20 vesicles/temperature/condition at >4 temperature. The data was fit to a sigmoidal curve to determine the temperature at which 50% of the vesicles were phase-separated (Tmisc). Data shown as the average fits of 3 independent experiments. Graph shows the mean +/− SD of 3 independent experiments. Inset shows the mean miscibility transition temperatures (Tmisc) +/− SD upon loss of AGPS in pB3 cells. Statistical significance was calculated using unpaired, two-tailed t-test. Unless otherwise noted, all data is shown as mean +/− SEM and statistical significance was calculated by one-way ANOVA with Tukey’s multiple comparisons test; ns, not significant. Examined n=10 fields of cells per experimental sample for all endocytosis-related experiments and at least two independent replicates were performed. For panels b, c, f & g: pB3 WT and AGPS KO cells were transduced with the respective vector control plasmids.
Fig. 5:
Fig. 5:. Loss of ether lipids decreases metastasis and cancer cell stemness.
a. Representative confocal images of extravasated tdTomato-labeled pB3 WT and AGPS KO cells from an in vitro microvascular network established using HUVEC (green) and normal human lung fibroblasts (unlabeled), over a time period of 24 h. b. Quantification of extravasated tdTomato-labeled pB3 WT and AGPS KO cells from an in vitro microvascular network established using HUVEC (green) and normal human lung fibroblasts (unlabeled), over a time period of 24 h. Each datapoint represents number of extravasated cells per device. Data is representative of two independent biological replicates. Graph shows the mean +/− SEM and statistical significance was calculated using unpaired, two-tailed t-test. c. Quantification of extravasated tdTomato-labeled PyMT-1099 cell line derivatives from an in vitro microvascular network established using HUVEC (green) and normal human lung fibroblasts (unlabeled), over a time period of 24 h. Each datapoint represents number of extravasated cells per device. Data is representative of two independent biological replicates. Graph shows the mean +/− SEM and statistical significance was calculated by one-way ANOVA with Tukey’s multiple comparisons test; ns, not significant. d. Representative in vivo imaging system (IVIS) images of overall metastatic burden in C57BL/6 female mice following intracardiac injection of GFP-luciferized pB3 WT (n=5) and AGPS KO (n=5) cells. e. Quantification of overall metastatic burden in C57BL/6 female mice following intracardiac injection of GFP-luciferized pB3 WT (n=5) and AGPS KO (n=5) cells. Graph shows the mean +/− SEM and statistical significance was calculated using Mann-Whitney test. f. Representative images of H&E-stained sections of harvested kidneys from C57BL/6 female mice following intracardiac injection of pB3 WT or pB3 AGPS KO cells. g. Gross images of primary tumors derived from pB3 WT control cells and pB3 AGPS KO cells. h. Tumor growth kinetics of primary tumors derived from pB3 WT control cells and pB3 AGPS KO cells. (n=5 mice per group). Data shown as mean +/− SEM. i. Bar graph showing the average weight from primary tumors derived from pB3 WT control cells and pB3 AGPS KO cells. Graph shows the mean +/− SEM and statistical significance was calculated using Mann-Whitney test; ns, not significant. j. Estimated number of cancer stem cells (CSCs) per 10,000 cells as calculated by extreme limiting dilution analysis (ELDA) software. Tumor-initiating capacity was assessed following implantation of indicated amounts of pB3 WT or pB3 AGPS KO cells into the mammary fat pad of C57BL/6 mice. P values, χ2 pairwise test. k. Table showing the number of mice with palpable primary tumors at 121 d post orthotopic implantation of PyMT-1099 WT or AGPS KO cells pretreated with or without 2 ng/ml TGF-β for 10 d into NSG female mice. l. Quantification of lung metastases for aforementioned experiment. Data shows the mean number of lung metastases +/− SEM. Statistical significance was calculated by one-way ANOVA with Tukey’s multiple comparisons test; ns, not significant. m. Representative images of H&E-stained lungs harvested from female NSG mice following orthotopic injection of PyMT-1099 WT or AGPS KO cells pretreated with or without 2 ng/ml TGF-β for 10 d. Lungs were harvested after 121 d post-injection. Arrows indicate metastases.

References

    1. Levental I. & Lyman E. Regulation of membrane protein structure and function by their lipid nano-environment. Nat Rev Mol Cell Biol 24, 107–122 (2023). - PMC - PubMed
    1. Viswanathan V.S. et al. Dependency of a therapy-resistant state of cancer cells on a lipid peroxidase pathway. Nature 547, 453–457 (2017). - PMC - PubMed
    1. Hangauer M.J. et al. Drug-tolerant persister cancer cells are vulnerable to GPX4 inhibition. Nature 551, 247–250 (2017). - PMC - PubMed
    1. Mai T.T. et al. Salinomycin kills cancer stem cells by sequestering iron in lysosomes. Nat Chem 9, 1025–1033 (2017). - PMC - PubMed
    1. Stockwell B.R. et al. Ferroptosis: A Regulated Cell Death Nexus Linking Metabolism, Redox Biology, and Disease. Cell 171, 273–285 (2017). - PMC - PubMed

Publication types