[Preprint]. 2024 Jun 26:2024.03.19.585719.
doi: 10.1101/2024.03.19.585719.

Dysregulated Ca2+ signaling, fluid secretion, and mitochondrial function in a mouse model of early Sjögren's syndrome

Affiliations

Dysregulated Ca2+ signaling, fluid secretion, and mitochondrial function in a mouse model of early Sjögren's syndrome

Kai-Ting Huang et al. bioRxiv. .

Update in

Abstract

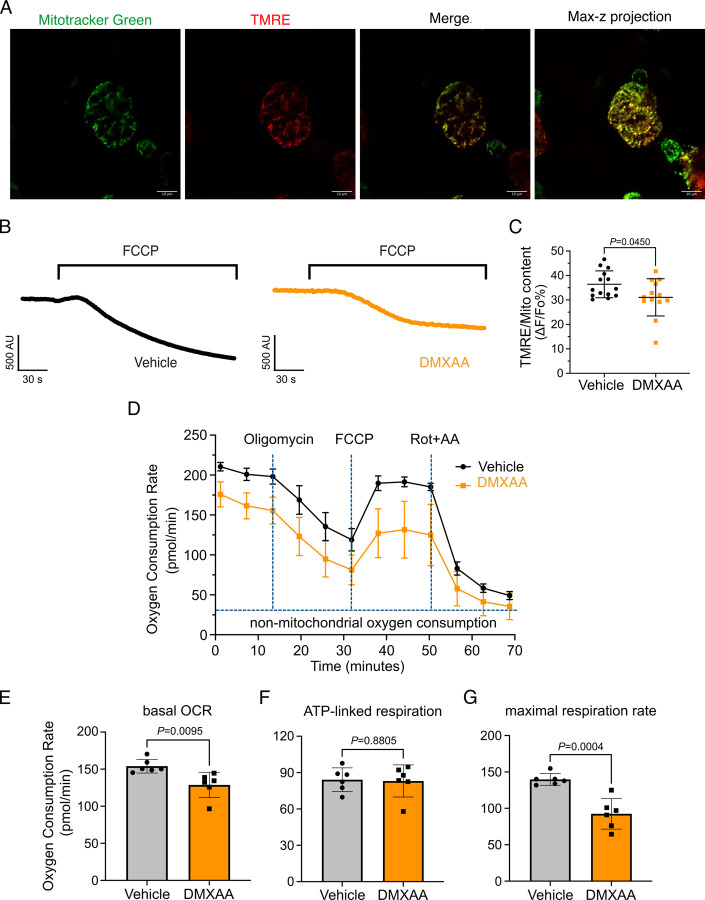
Saliva is essential for oral health. The molecular mechanisms leading to physiological fluid secretion are largely established, but factors that underlie secretory hypofunction, specifically related to the autoimmune disease Sjögren's syndrome (SS) are not fully understood. A major conundrum is the lack of association between the severity of inflammatory immune cell infiltration within the salivary glands and glandular hypofunction. In this study, we investigated in a mouse model system, mechanisms of glandular hypofunction caused by the activation of the stimulator of interferon genes (STING) pathway. Glandular hypofunction and SS-like disease were induced by treatment with 5,6-Dimethyl-9-oxo-9H-xanthene-4-acetic acid (DMXAA), a small molecule agonist of murine STING. Contrary to our expectations, despite a significant reduction in fluid secretion in DMXAA-treated mice, in vivo imaging demonstrated that neural stimulation resulted in greatly enhanced spatially averaged cytosolic Ca2+ levels. Notably, however, the spatiotemporal characteristics of the Ca2+ signals were altered to signals that propagated throughout the entire cytoplasm as opposed to largely apically confined Ca2+ rises observed without treatment. Despite the augmented Ca2+ signals, muscarinic stimulation resulted in reduced activation of TMEM16a, although there were no changes in channel abundance or absolute sensitivity to Ca2+. However, super-resolution microscopy revealed a disruption in the intimate colocalization of Inositol 1,4,5-trisphosphate receptor Ca2+ release channels in relation to TMEM16a. TMEM16a channel activation was also reduced when intracellular Ca2+ buffering was increased. These data are consistent with altered local coupling between the channels contributing to the reduced activation of TMEM16a. Appropriate Ca2+ signaling is also pivotal for mitochondrial morphology and bioenergetics and secretion is an energetically expensive process. Disrupted mitochondrial morphology, a depolarized mitochondrial membrane potential, and reduced oxygen consumption rate were observed in DMXAA-treated animals compared to control animals. We report that early in SS disease, dysregulated Ca2+ signals lead to decreased fluid secretion and disrupted mitochondrial function contributing to salivary gland hypofunction and likely the progression of SS disease.

Keywords: Ca2+ signaling; DMXAA-induced SS mouse model; Salivary gland hypo-function; Sjögren’s syndrome; TMEM16a channel; Xerostomia; mitochondrial dysfunction.


Figures

Figure 1.
Figure 1.. Deficiency in salivary secretion in DMXAA-induced SS mouse model.
(A) Schematic timeline for the generation of the SS mouse model. Female wild-type (WT) mice were administered two subcutaneous doses of DMXAA on Day 0 and Day 21. Salivary gland function was assessed on day 28. (B-C) Saliva, stimulated by pilocarpine, was collected over 15 minutes. (B) The amount of saliva secretion was determined by measuring the saliva weight. Vehicle: N= 30 mice, SS mouse model: N= 32 mice. Mean ± SD. (C) The weight of collected saliva was normalized to each mouse’s body weight. Vehicle: N= 26 mice, SS mouse model: N= 29 mice. Mean ± SD. Unpaired two-tailed t-test. (D) H&E stained sections from the vehicle or DMXAA-treated animals. Treated animals showed minor lymphocyte infiltration and inflammation as focal peri-vascular/peri-ductal lymphocytic sialoadenitis adjacent to normal-looking acini. (E) The glandular damage was assessed by normalizing the weight of the SMG to the mouse’s body weight. Each dot represents the weight of one SMG. N=10 from 5 mice for both vehicle-treated and DMXAA-treated mice. (F-G) A comparison of total saliva secretion following 1 min stimulations at the indicated frequency (F) from the SMG of mice (Vehicle: N= 8 mice, SS mouse model: N= 6) and (G) from the PG (Vehicle: N= 7 mice, SS mouse model: N= 5 mice). Mean ± SD. Two-way ANOVA with multiple comparisons.
Figure 2.
Figure 2.. Augmented global Ca2+ signals in vivo in SS mouse model.
(A) Representative standard deviation images of Ca2+ signals during the 10 s of stimulation. Scale bar: 26 μm (B) The time-course of pseudo-color images of Ca2+ in response to 7Hz stimulation. Scale bar: 26 μm (C) Representative cellular responses to stimulation at the indicated frequencies averaged from the entire cell. N = 10 cells, one animal. (D) A comparison of peak Ca2+, (E) area under curve, and (F) latency during each stimulation in SMG. Each symbol represented the average response of ten cells from one view. Vehicle: N= 3–6 from three mice; SS mouse model: N= 8–10 from four mice. Mean ± SD. Two-way ANOVA with multiple comparisons.
Figure 3.
Figure 3.. Disrupted spatial localization of Ca2+ signals in vivo in SS mouse model.
(A-B) A representative standard deviation image during the 7Hz stimulation in (A) vehicle condition and (B) in the SS mouse model. Scale bar: 26 μm. An acini is outlined by the white broken line and a line from apical to basal is shown in red in each SD image. (C-D) A representative “kymograph“ image of consecutive lines stacked in space over time for 7Hz stimulation in (C) vehicle condition and (D) SS mouse model. Time is encoded along the X-axis from left to right. Space is encoded along the Y-axis from the apical side (bottom) to the basolateral side (top). Scale bar: 3 μm. (E) Representative trace of Ca2+ signals at 7Hz nerve stimulation in an apical ROI generated as the initial 2 μm of the scanned line over time (yellow line) in vehicle-treated (black) and DMXAA-treated (orange) mice. The changes in apical ROI fluorescence at the indicated frequencies were quantified as the maximal Ca2+ changes normalized to the basal intensity. (F) Representative trace of Ca2+ signals following 7Hz nerve stimulation in a basolateral ROI generated as the final 2 μm of the scanned line (yellow line) over time in vehicle-treated (black) and DMXAA-treated (orange) mice. The changes in basolateral Ca2+ signals at the indicated frequencies were quantified by the maximal Ca2+ changes normalized to the basal intensity. (G) The ratio of the magnitude of Ca2+ signal on the apical vs. the basolateral ROI upon stimulation at the indicated frequencies. Vehicle: N= 5–6 replicates from three mice; SS mouse model: N=5–8 replicates from four mice. Mean ± SD. Two-way ANOVA with multiple comparisons.
Figure 4.
Figure 4.. Attenuated whole-cell macroscopic Cl– currents induced by CCh stimulation in SS mouse model.
(A) Western blotting showing the protein expression level of TMEM16a in the vehicle condition and the DMXAA-treated SS mouse model. Actin is the internal control. (B) The quantification of TMEM16a protein expression normalized to the internal control, Actin. Vehicle, N= 4 mice; SS mouse model: N= 6 mice. (C) Immunofluorescent staining in SMG tissue for TMEM16a (green), Na+/K+ ATPase (red), and DAPI for nucleus (blue). The upper panel is from the vehicle-treated control and the bottom panel is from DMXAA-treated animals. Scale bar: 30 μm. Unpaired two-tailed t-test. (D) Cl-currents when cells were held at −50 mV and stepped from −80 to 120 mV in 20 mV increments. (E) Time-dependent Cl current density changes in response to the CCh in the isolated acinar cells in vehicle conditions and SS mouse model. (F) Current-voltage relationships were measured before and after the addition of CCh in vehicle conditions (N=three mice, 3–4 cells per mouse) and SS mouse model (N=three mice, 3–4 cells per mouse). TMEM16a currents in the treated mice were markedly reduced compared to the control mice. Black dots represent the vehicle-treated cells and orange squares represent DMXAA-treated cells. The open symbols represent no stimulation; the solid symbols represent CCh stimulation.
Figure 5.
Figure 5.. Increased [Ca2+]i is capable of restoring TMEM16a functionality to DMXAA-treated mice.
(A) Cl- currents when cells were held at −50 mV and stepped from −80 to 120 mV in 20 mV increments. Either 0.5, 1 or 5 μM [Ca2+]i in the patch pipette elicited a similar magnitude of Cl currents for both the treated (N= 3 mice, 3–4 cells per mouse) and control mice (N= 3 mice, 3–4 cells per mouse). (B) Current-voltage relationships for both populations were essentially identical. Vehicle and SS mouse model: N=3 mice, 3–4 cells per mouse.
Figure 6.
Figure 6.. EGTA abolishes TMEM16a currents in DMXAA-treated mice.
(A) Cl currents in cells held at −80 mV and stepped to 80 mV with CCh addition in EGTA (slow) and BAPTA (fast) buffered cells, respectively. (B) Current-voltage relationships were measured after the addition of CCh in 5 mM EGTA and 5m M BAPTA loaded isolated acinar cells from vehicle conditions (N= 3 mice, 3–4 cells per mouse) and SS mouse model (N= 3 mice, 3–4 cells per mouse). No TMEM16a currents in acini in either vehicle or DMXAA-treated mice in cells buffered with BAPTA. Triangles represent the 5 mM EGTA condition; squares represent the 5 mM BAPTA condition. The solid black symbols represent the vehicle-treated cells and hollow orange symbols represent DMXAA-treated cells.
Figure 7.
Figure 7.. Disrupted proximity between TMEM16a and IP3R3 in the DMXAA-treated SS mouse model.
(A) Maximum projection of a STED z stack (1 μm) showing TMEM16a (green) and IP3R3 (red) in SMG tissue following Huygens deconvolution. The top panel represents the vehicle-treated control, and the bottom panel represents the SS mouse model. Scale bar: 2 μm. Zoomed images highlight the localization of TMEM16a and IP3R3 from the white square on the merged images. (B) Diagram illustrating the positioning of apical PM TMEM16a and apical IP3R3 in acinar cells. To analyze the proximity, a 1 μm reference line was drawn across the two parallel TMEM16a over two adjacent acinar cells with IP3R3 aligned vertically in the cytoplasm. (C-D) The representative traces of changes in fluorescence of TMEM16a (green) and IP3R3 (red) over the 1μm distance. (E) Analysis of distance between TMEM16a and IP3R3 within cells. (F) Analysis of the distance between parallel TMEM16a on adjacent acinar cells. (G) Distance measurement of apical IP3R3 between two cells. Each symbol represents the mean of 5 examinations per image. Vehicle: N= 8 replicates from 3 mice; SS mouse model: N= 9 replicates from 3 mice. Mean ± SD. Unpaired two-tailed t-test.
Figure 8.
Figure 8.. Mitochondrial alterations in acinar cells from the DMXAA-treated SS mouse model.
(A) Immunofluorescent staining in SMG tissue for ATP5A (green), Na+/K+ ATPase (red), and DAPI for nucleus (blue). The upper panel is the vehicle, and the bottom panel is the SS mouse model. Scale bar: 12 μm. The mitochondrial content was quantified by (B) the mitochondrial number per acinar cell and (C) the percentage of area occupied by mitochondria per acinar cell. The mitochondrial morphology was analyzed by the (D) AR for the degree of mitochondrial tubular shape and (E) FF for the degree of mitochondrial branching (complexity). In (B) to (E), black dots represent the vehicle condition, and orange squares indicate the SS mouse model. Each symbol represents the mean of 10 cells per image. Vehicle: N= 10–15 from 3 mice; SS mouse model: N= 10–11 from 3 mice. Mean ± SD. Unpaired two-tailed t-test.
Figure 9.
Figure 9.. Ultrastructural analysis of mitochondria and ER in SS mouse model.
(A-C’’) Images show mitochondrial cristae and ER structure by an EM at scales of (A-A’) 2μm, (B-B’) 800nm, and (C-C’) 400nm. (D) Mitochondrial perimeter, (E) mitochondrial area and (F) circularity were quantified by the shape description in ImageJ. (G) Quantification of mitochondrial cristae dispersion was evaluated by the percentage of cristae occupied in one mitochondrion. The (H) mean and (I) minimum proximity of ER and mitochondria were quantified by the plugin from http://sites.imagej.net/MitoCare/ in ImageJ. Vehicle: N=38 and SS mouse model: N=36 from 3 mice. Mean ± SD. Unpaired two-tailed t-test.
Figure 10.
Figure 10.. Mitochondrial bioenergetics are compromised in the DMXAA-treated SS model.
(A) Mitochondria in the isolated acinar cells were labeled by the MitoTracker Green and co-stained with mitochondrial membrane potential dye, TMRE (red). The merged image shows the colocalization of both dyes, with maximal z-stack projection throughout the acinar cells. (B) Representative changes in mitochondrial membrane potential following FCCP-induced depolarization. The vehicle is shown in black; SS mouse model is in orange. (C) The quantification was achieved by the difference of TMRE normalized to MitoTracker Green. Each dot is the mean of 10 cells from one experiment. Vehicle: N=14 and SS mouse model: N=13 from 3 mice. (D) Real-time mitochondrial respiration function was assessed in isolated acinar cells from the vehicle (black) and SS mouse model (orange) using the Seahorse XFe96 extracellular flux analyzer, in response to the pharmacological mito stress (oligomycin, FCCP, rotenone, and antimycin). Vehicle: N=59 and SS mouse model: N=32 from 6 mice. (E-G) Mitochondrial respiration function parameters were quantified by OCR substracted the non-mitochondrial OCR for (E) basal respiration rate, (F) ATP-linked respiration rate, and (G) maximal respiration rate. Mean ± SD. Unpaired two-tailed t-test.

References

    1. Williamson S. P. H. a. R. T. (2001) <A review of saliva-Normal composition, flow, and function.pdf>. J Prosthet Dent 85 - PubMed
    1. Carpenter G. H. (2013) The secretion, components, and properties of saliva. Annu Rev Food Sci Technol 4, 267–276 - PubMed
    1. Pedersen A. M. L., Sorensen C. E., Proctor G. B., Carpenter G. H., and Ekstrom J. (2018) Salivary secretion in health and disease. J Oral Rehabil 45, 730–746 - PubMed
    1. de Paula F., Teshima T. H. N., Hsieh R., Souza M. M., Nico M. M. S., and Lourenco S. V. (2017) Overview of Human Salivary Glands: Highlights of Morphology and Developing Processes. Anat Rec (Hoboken) 300, 1180–1188 - PubMed
    1. Futatsugi A., Nakamura T., Yamada M. K., Ebisui E., Nakamura K., Uchida K., Kitaguchi T., Takahashi-Iwanaga H., Noda T., Aruga J., and Mikoshiba K. (2005) IP3 receptor types 2 and 3 mediate exocrine secretion underlying energy metabolism. Science 309, 2232–2234 - PubMed

Publication types