[Preprint]. 2024 Mar 21:2024.03.20.585990.
doi: 10.1101/2024.03.20.585990.

CDK12 Loss Promotes Prostate Cancer Development While Exposing Vulnerabilities to Paralog-Based Synthetic Lethality

Affiliations

CDK12 Loss Promotes Prostate Cancer Development While Exposing Vulnerabilities to Paralog-Based Synthetic Lethality

Jean Ching-Yi Tien et al. bioRxiv. .

Update in

Abstract

Biallelic loss of cyclin-dependent kinase 12 (CDK12) defines a unique molecular subtype of metastatic castration-resistant prostate cancer (mCRPC). It remains unclear, however, whether CDK12 loss per se is sufficient to drive prostate cancer development-either alone, or in the context of other genetic alterations-and whether CDK12-mutant tumors exhibit sensitivity to specific pharmacotherapies. Here, we demonstrate that tissue-specific Cdk12 ablation is sufficient to induce preneoplastic lesions and robust T cell infiltration in the mouse prostate. Allograft-based CRISPR screening demonstrated that Cdk12 loss is positively associated with Trp53 inactivation but negatively associated with Pten inactivation-akin to what is observed in human mCRPC. Consistent with this, ablation of Cdk12 in prostate organoids with concurrent Trp53 loss promotes their proliferation and ability to form tumors in mice, while Cdk12 knockout in the Pten-null prostate cancer mouse model abrogates tumor growth. Bigenic Cdk12 and Trp53 loss allografts represent a new syngeneic model for the study of androgen receptor (AR)-positive, luminal prostate cancer. Notably, Cdk12/Trp53 loss prostate tumors are sensitive to immune checkpoint blockade. Cdk12-null organoids (either with or without Trp53 co-ablation) and patient-derived xenografts from tumors with CDK12 inactivation are highly sensitive to inhibition or degradation of its paralog kinase, CDK13. Together, these data identify CDK12 as a bona fide tumor suppressor gene with impact on tumor progression and lends support to paralog-based synthetic lethality as a promising strategy for treating CDK12-mutant mCRPC.

Keywords: CDK12; CDK13; PTEN; immunotherapy; p53; paralog-based synthetic lethality; prostate cancer; syngeneic model.


Conflict of interest statement

DECLARATION OF INTERESTS A.M.C. is a co-founder and serves on the scientific advisory board of the following: LynxDx, Flamingo Therapeutics, Medsyn Pharma, Oncopia Therapeutics, and Esanik Therapeutics. A.M.C. serves as an advisor to Aurigene Oncology Limited, Proteovant, Tempus, RAPPTA, and Ascentage. C.J.L. makes the following disclosures: receives and/or has received research funding from: AstraZeneca, Merck KGaA, Artios, Neophore. Received consultancy, SAB membership, or honoraria payments from: FoRx, Syncona, Sun Pharma, Gerson Lehrman Group, Merck KGaA, Vertex, AstraZeneca, Tango, 3rd Rock, Ono Pharma, Artios, Abingworth, Tesselate, Dark Blue Therapeutics, Pontifax, Astex, Neophore, Glaxo Smith Kline, Dawn Bioventures. Has stock in: Tango, Ovibio, Hysplex, Tesselate. C.J.L. is also a named inventor on patents describing the use of DNA repair inhibitors and stands to gain from their development and use as part of the ICR “Rewards to Inventors” scheme and also reports benefits from this scheme associated with patents for PARP inhibitors paid into C.J.L.’s personal account and research accounts at the Institute of Cancer Research. J.C. serves in an advisory role to ExaiBio, unrelated to this work. F.Y.F. is currently serving, has served on the advisory boards, or has received consulting fees from Astellas, Bayer, Celgene, Clovis Oncology, Janssen, Genentech Roche, Myovant, Roivant, Sanofi, and Blue Earth Diagnostics; he also is a member of the SAB for Artera, ClearNote Genomics, SerImmune, and BMS (Microenvironment Division). K.D. serves as a scientific advisor of Kinoteck Therapeutics CO., LTD, Shanghai and has received financial support from Livzon Pharmaceutical Group, Zhuhai, China. The University of Michigan and the Shanghai Institute of Organic Chemistry have filed patents on the CDK12/13 degraders and inhibitors mentioned in this manuscript. A.M.C, K.D., Xiaoju W., J.Y., Y.Chang, and J.C.T. have been named as co-inventors on these patents.

Figures
Figure 1.
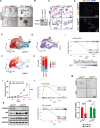
Figure 1.. Cdk12 ablation in the prostate epithelium induces neoplasia.
(A) H&E staining and CDK12 immunohistochemistry (IHC) in representative prostate samples from 52-week-old Cdk12pc−/− mice (pure C57 background) and wild-type (WT) controls. Scale bars in left panel indicate 100μm. Other scale bars indicate 50μm.Bar graphs indicate percent cross-sectional area in each prostate lobe occupied by histologically abnormal tissue. Anterior prostate, AP. Dorsal prostate, DP. Ventral prostate, VP. Lateral prostate, LP. (n=8 mice per group). (B) Pathological scoring (Path score) of prostate tissue from the same animals. Numerical scores assigned to normal tissue (0), hyperplasia (1), focal high grade prostatic intraepithelial neoplasia (HGPIN) (2) and atypical intraductal proliferation (AIP) (3) (as indicated by respective images). Scale bars indicate 50μm. Bar graph shows percentage of prostate cross-sectional area occupied by tissue of each path score (scores 2 and 3 added together). (n=7–8 mice per group). (C) Immunofluorescent staining of cytokeratin-8 (K8) and p63. 52-week-old Cdk12pc−/− image shows an area of focal HGPIN with expansion of p63(+) basal cells. Scale bars in left and right images respectively represent 100μm and 50μm. (D) Ki67 immunohistochemistry from Cdk12pc−/− or WT mice. Scale bars indicate 50μm. Bar graph indicates percentage Ki67(+) cells per high powered field. (n=9 images from 3 mice per group). (E) Immunohistochemistry for immune cell markers, indicative of a T cell predominant infiltrate surrounding neoplastic lesions in Cdk12pc−/− animals. Scale bars indicate 100μm. Data are represented as mean ± SEM. t-test used individual comparisons, one way ANOVA for multiple comparisons, *p<0.05, **p<0.01, ***p<0.001, ****p<0.0001.
Figure 2.
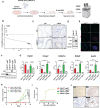
Figure 2.. Organoids derived from the Cdk12pc−/− prostate are morphologically abnormal, with impaired basal-luminal segregation and reduced androgen dependence.
(A) Brightfield images of organoids derived from Pb-Cre;Cdk12f/f;mT/mG prostate basal cells (52-week time point). Tom indicates Td-tomato-expressing cells with wild-type Cdk12 (Cdk12WT). GFP indicates GFP-expressing cells with Cdk12 ablation (Cdk12KO). Scale bars indicate 200μm. (B) Western blot analysis of organoids from each group demonstrating CDK12 loss. Vinculin serves as a loading control. (C) Cdk12KO organoid morphology: H&E staining and CDK12 immunohistochemistry. Scale bars in top and bottom panels respectively indicate 200μm and 100μm. (D) Immunofluorescence for cytokeratin-8 (K8) and p63 indicates basal-luminal disorganization in Cdk12KO organoids. Scale bars indicate 200μm. (E) UMAP of scRNA-seq from Cdk12WT organoids (derived from 3 mice). The streamlines with arrows obtained from RNA velocity analysis indicate directions of cell progression from one state to another. (F) Cells from Cdk12KO organoids colored by pseudo-time; the five identified cell states progress from Basal_1, Basal_2, Basal_3, Lum_1, to Lum_2. (G) Cells from Cdk12KO organoids (derived from 3 mice) projected into the UMAP of Cdk12WT. Pseudocolor indicates presence (yellow) or absence (purple) of Cdk12 transcript. (H) Distributions of different cell states in Cdk12WT and Cdk12KO organoids. Cdk12KO organoids are less differentiated with increased basal cell accumulation. The most differentiated (Lum_2) population is lost in Cdk12KO organoids. (I) Enrichment in Cdk12KO organoids of down-regulated genes from human prostate cancer with CDK12 inactivation [as defined in]. (J) Proliferation of Cdk12WT and Cdk12KO organoids grown in the absence of epidermal growth factor (EGF) and dihydrotestosterone (DHT) as measured by the Cell Titer-Glo (CTG) assay. (n= 3 replicates per group in 2 unique experiments). (K) Protein expression of CDK12, AR, and FOXA1 in multiple monoclonal Cdk12WT and Cdk12KO organoid lines. GAPDH serves as a loading control. (L) Gene set enrichment of AR target genes (activated and repressed) in Cdk12WT and Cdk12KO organoids. (M) Morphology and viability quantification of Cdk12WT and Cdk12KO organoids subjected to enzalutamide (Enza) treatment. (n= 3 replicates per group in 2 unique experiments) Data are represented as mean ± SEM. Two-way ANOVA used for statistical comparisons, ***p<0.001; ****p<0.0001; ns, not significant.
Figure 3.
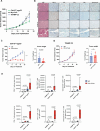
Figure 3.. Cdk12 and Trp53 inactivating mutations interact to promote prostate cancer.
(A) Workflow for CRISPR library screening of Cdk12 interacting genes. Cdk12KO organoid cells transduced with MusCK CRISPR library at multiplicity of infection (MOI) 0.3. Tumor allografts generated from transfected cells grown subcutaneously in immunocompromised mice for six months. Tumors harvested and subjected to sequencing analysis to determine enrichment or depletion of library guide RNAs. (B) Snake plot representing log2 fold change of guide RNAs in sequenced tumor samples described in (A). (C) Immunohistochemistry for p53 (left panels) and DNA damage marker (γH2AX; right panels) in prostates of one-year-old WT and Cdk12pc−/− mice. Scale bars indicate 50μm. (D) Protein expression of p53 and γH2AX in Cdk12WT and Cdk12 KO organoids. GAPDH serves as a loading control. (E) CDK12-p53 co-staining in Cdk12WT and Cdk12KO organoids. Scale bars indicate 50μm. (F) CRISPR-mediated Trp53 ablation in Cdk12WT and Cdk12KO organoids. sgp53 indicates Trp53-specific guide RNA. sgNT indicates control non-targeting guide RNA. Alpha tubulin serves as a loading control. (G) Relative expression (Rel Exp) levels of Trp53 and p53 target genes in samples described in (F). (n= 3 samples per group). (H) Cell proliferation in organoids from groups indicated in (F) as measured by CTG assay. (n= 3–4 samples per group) (I) Kaplan Meier plots indicating tumor formation during the 70 days post implantation (subcutaneous allograft) in Cdk12WT and Cdk12KO organoids with or without Trp53 ablation. Note that only Cdk12KO-sgp53 cells form viable allograft tumors. (n= 5 mice each with 2 tumor injection sites per group). (J) Immunohistochemical staining of AR, p53, CDK12, and γH2AX in Cdk12KO-sgp53 allografts. Scale bars indicate 50μm. Data are represented as mean ± SEM. Two-way ANOVA was used for statistical comparisons. *p<0.05; **p<0.01; ***p<0.001; ****p<0.0001.
Figure 4.
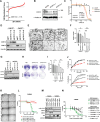
Figure 4.. Cdk12/Trp53 double knockout allografts exhibit lymphocytic immune responses and increased sensitivity to immune checkpoint inhibitor therapy.
(A) Growth of Cdk12KO-sgp53, Myc-CaP, and TRAMP-C2 allografts in immunocompetent wild type mice. (n=10–15 mice, each with 2 tumor injection sites, per group). (B) Immunohistochemical staining of CDK12, T cell markers (CD3, CD4, CD8), and NK cell marker granzyme B in Cdk12KO-sgp53 allografts, Myc-CaP allografts, and TRAMP-C2 allografts, and prostates of the established Ptenpc−/− prostate cancer mouse model. Scale bars indicate 50μm. (C-D) Tumor volume time course and endpoint weights of Cdk12KO-sgp53 (C) and TRAMP-C2 (D) allografts subjected to treatment with anti-PD1/CTLA4 cocktail. (n= 7–8 mice, each with 2 tumor injection sites, per group). (E) Flow cytometry-based quantification of CD4(+) and CD8(+) T cells (total, IFNγ(+), granzyme B(+)) in Cdk12KO-sgp53 and TRAMP-C2 allograft samples +/− treatment with anti-PD1/ CTLA4 cocktail. (n= 7–8 samples per group). Data are represented as mean ± SEM. Two-way ANOVA test was used for statistical comparison of tumor volume for (C) and in (E) and unpaired t test was used for tumor weight in (C) and (D). ****p<0.0001; ns, not significant.
Figure 5.
Figure 5.. Cdk12 ablation impairs tumor progression in the Pten-null mouse model of prostate cancer.
(A) Kaplan-Meier plots demonstrating survival of prostate-specific Pten-null mice (Ptenpc−/−) and Ptenpc−/− with concomitant prostate-specific Cdk12 ablation (Ptenpc−/− Cdk12pc−/−). (B) Genitourinary (GU) tract weights of Ptenpc−/− and Ptenpc−/− Cdk12pc−/− mice at 52 weeks as well as wild-type mice (52 weeks). (C) Representative images of GU tracts from mice indicated in (B). (D) H/E-stained sections of Ptenpc−/− and Ptenpc−/− Cdk12pc−/− prostate. Scale bars indicate 600μm. (E) Weights of whole prostate and individual lobes of Ptenpc−/− and Ptenpc−/− Cdk12pc−/− mice at 24 weeks. (F) Cell proliferation in complete media of epithelial cell organoids derived from Ptenpc−/− and Ptenpc−/− Cdk12pc−/− mice measured by CTG assay. (n= 4 samples per group). (G) Immunohistochemical staining of CDK12, Ki67, and phosphorylated AKT (pAKT) in cross sections of organoids described in (F). Scale bars indicate 200μm. (H) Protein expression of CDK12, pAKT, and pS6 in Ptenpc−/− and Ptenpc−/− Cdk12pc−/− organoids with vinculin serving as a loading control. (I) Cell proliferation of basal cell-derived Cdk12WT and Cdk12KO organoids subjected to CRISPR-mediated Pten ablation (sgPten) as measured by CTG assay. (n= 4 samples per group) (J) Phase contrast images of organoids described in (I). Data are represented as mean ± SEM. Log-rank (Mantel-Cox) test was used to detect significance in (A). One-way ANOVA test was used to detect significance in (B). Unpaired t test was used for tumor weight in (E). Two-way ANOVA test was used for (F) and (I) ****p<0.0001.
Figure 6.
Figure 6.. Cdk12KO organoids and CDK12-mutant tumors are preferentially sensitive to a CDK13/12 degrader.
(A) Snake plot representing data from a siRNA screen to identify CDK12 synthetic lethal effects via 1NM sensitivity in CDK12as cells. Negative Z scores indicate CDK12 synthetic lethal effects, with CDK13 representing the most profound effect. (B) Western blot indicating CDK13 gene silencing with two different siRNAs (siCDK13.1 and siCDK13.2. (C) Survival curve depicting cell survival in 1NM-exposed CDK12as cells transfected with one of two unique CDK13 siRNAs (siCDK13.1 and siCDK13.2) or control siRNA (siCON). (D) CRISPR-mediated Cdk13 (sgCdk13(1+3), or sgCdk13(2+4)) knockout in Cdk12WT and Cdk12KO organoids harvested on Day 5 after lentiviral transduction. Protein expression of CDK12 and CDK13 in organoids with vinculin serving as a loading control. (E) Brightfield images of organoids described in (D). Scale bars indicate 200μm. (F) Quantification of relative growth from images in (D). (n= 3 samples per group). (G) CRISPR ablation of Cdk12 (sgCdk12) and Cdk13 (sgCdk13(1+3), or sgCdk13(2+4)) in Myc-CaP cells. Protein expression of CDK12 and CDK13 in Myc-CaP cells treated with guide RNAs. (H) Colony formation assay showing cell survival in cells treated with indicated sgRNAs or control sgRNA (sgNT). (Representative data from 3 unique experiments) (I) Quantification of relative growth from images in (H). (Analysis of 11 high powered fields per sample over 2 unique experiments). (J) (Top panel) C4-2B prostate cancer cells subjected to CRISPR-based CDK12 ablation (CDK12KO) or control sgRNA (C4-2B CTRL): Percent confluence measurement in the setting of siRNA-based CDK13 knockdown (siCDK13) or treatment with control siRNA (siNTC). (Bottom panel) C4-2B CDK12KO and C4-2B CTRL cells: Percent confluence measurement in the setting of siRNA-based knockdown of CCNK (encoding cyclin K), or control siRNA treatment. (n= 3 samples per group). (K) Images of Cdk12WT and Cdk12KO with or without Trp53 ablation organoids following treatment with CDK12/13 degrader (YJ9069). sgp53 indicates Trp53 ablation, while sgNT indicates intact Trp53. Scale bars indicate 1000μm. (L) Viability curves and IC50 values of YJ9069 for groups described in (K). (n= 4 samples per group) (M) Protein expression of p-Ser RNA Pol-II, CDK12, CDK13, and p53 in Cdk12WT and Cdk12KO organoids with or without Trp53 ablation subjected to YJ9069 degrader or vehicle treatment. (N) IC50 of organoids derived from patient-derived xenograft (PDX) lines with WT CDK12 (MDA153, MDA146-12, LuCaP23.1, LuCaP86.2, LuCaP96, PC295) and inactivating CDK12 mutation (LTL706B, MDA117, MDA328). (n= 3 replicates per line). Data are represented as mean ± SEM. One way ANOVA for multiple comparisons, two way ANOVA for multiple variables, **p<0.01, ****p<0.0001.
Figure 7.
Figure 7.. CDK13/12 degrader inhibits CDK12-mutant tumor growth in vivo.
(A) In vivo treatment of Cdk12KO-sgp53 allografts with YJ9069 or vehicle: line graph indicates tumor volume normalized to baseline. Bar graph indicates tumor weight at endpoint. (n=9–10 mice, each with 2 tumors, per group) (B) In vivo treatment of TRAMP-C2 allografts with YJ9069 or vehicle: graphs as indicated in (A). (n=9–10 mice, each with 2 tumors, per group) (C-D) Unmodified (sgNT-treated) Myc-CaP allografts (C) or sgCdk12-treated Myc-CaP allografts (D) subjected to in vivo YJ9069 treatment: Line graphs indicate tumor volume. Bar graphs indicate tumor weight at end of treatment time course. (n=6–9 mice per group) (E-H) CDK12 immunohistochemistry and TUNEL staining of unmodified (sgNT-treated) Myc-CaP allografts (E) and sgCdk12-treated Myc-CaP allografts (F). Bar graphs (G-H) indicate quantification of TUNEL(+) cells per high powered field. Scale bars indicate 50μm. (I-J) YJ9069 treatment of subcutaneously implanted PDX lines, LTL706B (CDK12-mutant) and MDA146-12 (intact CDK12). Graphs indicate tumor volume over the treatment time course. (n=8–9 mice, each with 2 tumors per group) Two-way ANOVA test was used to detect significance in tumor volume of (A), (D), and (I), and unpaired t test was used for tumor weight in (A)-(D) and (I)-(J) and TUNEL staining (G)-(H). ****p<0.0001; ns, not significant.

References

    1. Chou J., Quigley D.A., Robinson T.M., Feng F.Y., and Ashworth A. (2020). Transcription-Associated Cyclin-Dependent Kinases as Targets and Biomarkers for Cancer Therapy. Cancer Discov 10, 351–370. 10.1158/2159-8290.CD-19-0528. - DOI - PubMed
    1. Zhang T., Kwiatkowski N., Olson C.M., Dixon-Clarke S.E., Abraham B.J., Greifenberg A.K., Ficarro S.B., Elkins J.M., Liang Y., Hannett N.M., et al. (2016). Covalent targeting of remote cysteine residues to develop CDK12 and CDK13 inhibitors. Nat Chem Biol 12, 876–884. 10.1038/nchembio.2166. - DOI - PMC - PubMed
    1. Bartkowiak B., Liu P., Phatnani H.P., Fuda N.J., Cooper J.J., Price D.H., Adelman K., Lis J.T., and Greenleaf A.L. (2010). CDK12 is a transcription elongation-associated CTD kinase, the metazoan ortholog of yeast Ctk1. Genes Dev 24, 2303–2316. 10.1101/gad.1968210. - DOI - PMC - PubMed
    1. Blazek D., Kohoutek J., Bartholomeeusen K., Johansen E., Hulinkova P., Luo Z., Cimermancic P., Ule J., and Peterlin B.M. (2011). The Cyclin K/Cdk12 complex maintains genomic stability via regulation of expression of DNA damage response genes. Genes Dev 25, 2158–2172. 10.1101/gad.16962311. - DOI - PMC - PubMed
    1. Cheng S.W., Kuzyk M.A., Moradian A., Ichu T.A., Chang V.C., Tien J.F., Vollett S.E., Griffith M., Marra M.A., and Morin G.B. (2012). Interaction of cyclin-dependent kinase 12/CrkRS with cyclin K1 is required for the phosphorylation of the C-terminal domain of RNA polymerase II. Mol Cell Biol 32, 4691–4704. 10.1128/MCB.06267-11. - DOI - PMC - PubMed

Publication types