

This is a preprint.
Utilizing multimodal AI to improve genetic analyses of cardiovascular traits
- PMID: 38562791
- PMCID: PMC10984061
- DOI: 10.1101/2024.03.19.24304547
Utilizing multimodal AI to improve genetic analyses of cardiovascular traits
Abstract
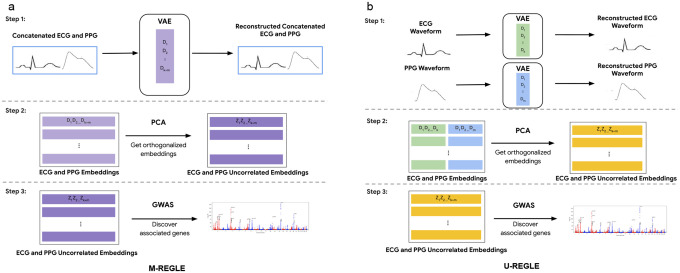
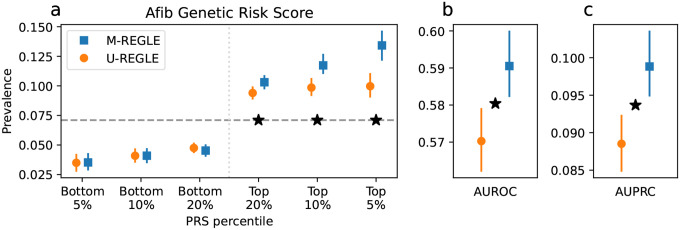
Electronic health records, biobanks, and wearable biosensors contain multiple high-dimensional clinical data (HDCD) modalities (e.g., ECG, Photoplethysmography (PPG), and MRI) for each individual. Access to multimodal HDCD provides a unique opportunity for genetic studies of complex traits because different modalities relevant to a single physiological system (e.g., circulatory system) encode complementary and overlapping information. We propose a novel multimodal deep learning method, M-REGLE, for discovering genetic associations from a joint representation of multiple complementary HDCD modalities. We showcase the effectiveness of this model by applying it to several cardiovascular modalities. M-REGLE jointly learns a lower representation (i.e., latent factors) of multimodal HDCD using a convolutional variational autoencoder, performs genome wide association studies (GWAS) on each latent factor, then combines the results to study the genetics of the underlying system. To validate the advantages of M-REGLE and multimodal learning, we apply it to common cardiovascular modalities (PPG and ECG), and compare its results to unimodal learning methods in which representations are learned from each data modality separately, but the downstream genetic analyses are performed on the combined unimodal representations. M-REGLE identifies 19.3% more loci on the 12-lead ECG dataset, 13.0% more loci on the ECG lead I + PPG dataset, and its genetic risk score significantly outperforms the unimodal risk score at predicting cardiac phenotypes, such as atrial fibrillation (Afib), in multiple biobanks.
Figures
Similar articles
-
Applying multimodal AI to physiological waveforms improves genetic prediction of cardiovascular traits.Am J Hum Genet. 2025 Jul 3;112(7):1562-1579. doi: 10.1016/j.ajhg.2025.05.015. Epub 2025 Jun 20. Am J Hum Genet. 2025. PMID: 40543505 Free PMC article.
-
Unsupervised representation learning on high-dimensional clinical data improves genomic discovery and prediction.Nat Genet. 2024 Aug;56(8):1604-1613. doi: 10.1038/s41588-024-01831-6. Epub 2024 Jul 8. Nat Genet. 2024. PMID: 38977853 Free PMC article.
-
Unsupervised representation learning improves genomic discovery and risk prediction for respiratory and circulatory functions and diseases.medRxiv [Preprint]. 2023 Aug 29:2023.04.28.23289285. doi: 10.1101/2023.04.28.23289285. medRxiv. 2023. Update in: Nat Genet. 2024 Aug;56(8):1604-1613. doi: 10.1038/s41588-024-01831-6. PMID: 37163049 Free PMC article. Updated. Preprint.
-
A multimodal dynamical variational autoencoder for audiovisual speech representation learning.Neural Netw. 2024 Apr;172:106120. doi: 10.1016/j.neunet.2024.106120. Epub 2024 Jan 11. Neural Netw. 2024. PMID: 38266474
-
Use of digital health applications for the detection of atrial fibrillation.Herzschrittmacherther Elektrophysiol. 2022 Dec;33(4):373-379. doi: 10.1007/s00399-022-00888-2. Epub 2022 Aug 12. Herzschrittmacherther Elektrophysiol. 2022. PMID: 35960358 Review. English.
References
-
- Alipanahi Babak, Hormozdiari Farhad, Behsaz Babak, Cosentino Justin, McCaw Zachary R, Schorsch Emanuel, Sculley D, Dorfman Elizabeth H, Foster Paul J, Peng Lily H, Phene Sonia, Hammel Naama, Carroll Andrew, Khawaja Anthony P, and McLean Cory Y. Large-scale machine-learning-based phenotyping significantly improves genomic discovery for optic nerve head morphology. Am. J. Hum. Genet., 108(7):1217–1230, July 2021. - PMC - PubMed
-
- Aung Nay, Vargas Jose D, Yang Chaojie, Fung Kenneth, Sanghvi Mihir M, Piechnik Stefan K, Neubauer Stefan, Manichaikul Ani, Rotter Jerome I, Taylor Kent D, Lima Joao A C, Bluemke David A, Kawut Steven M, Petersen Steffen E, and Munroe Patricia B. Genome-wide association analysis reveals insights into the genetic architecture of right ventricular structure and function. Nat. Genet., pages 1–9, June 2022. - PMC - PubMed
Publication types
Grants and funding
LinkOut - more resources
Full Text Sources