[Preprint]. 2024 Mar 19:2024.03.18.585595.
doi: 10.1101/2024.03.18.585595.

Canopy2: tumor phylogeny inference by bulk DNA and single-cell RNA sequencing

Affiliations

Canopy2: tumor phylogeny inference by bulk DNA and single-cell RNA sequencing

Ann Marie K Weideman et al. bioRxiv. .

Abstract

Tumors are comprised of a mixture of distinct cell populations that differ in terms of genetic makeup and function. Such heterogeneity plays a role in the development of drug resistance and the ineffectiveness of targeted cancer therapies. Insight into this complexity can be obtained through the construction of a phylogenetic tree, which illustrates the evolutionary lineage of tumor cells as they acquire mutations over time. We propose Canopy2, a Bayesian framework that uses single nucleotide variants derived from bulk DNA and single-cell RNA sequencing to infer tumor phylogeny and conduct mutational profiling of tumor subpopulations. Canopy2 uses Markov chain Monte Carlo methods to sample from a joint probability distribution involving a mixture of binomial and beta-binomial distributions, specifically chosen to account for the sparsity and stochasticity of the single-cell data. Canopy2 demystifies the sources of zeros in the single-cell data and separates zeros categorized as non-cancerous (cells without mutations), stochastic (mutations not expressed due to bursting), and technical (expressed mutations not picked up by sequencing). Simulations demonstrate that Canopy2 consistently outperforms competing methods and reconstructs the clonal tree with high fidelity, even in situations involving low sequencing depth, poor single-cell yield, and highly-advanced and polyclonal tumors. We further assess the performance of Canopy2 through application to breast cancer and glioblastoma data, benchmarking against existing methods. Canopy2 is an open-source R package available at https://github.com/annweideman/canopy2.


Figures

Figure 1.
Figure 1.. Illustration of tumor phylogeny inference through separate analysis with bulk DNA-seq and scRNA-seq.
A) Cancer phylogenetic tree representing the ground truth with six single nucleotide variants (SNVs). The leftmost, non-bifurcating branch denotes the population of normal cells, and time runs vertically down the tree from the root to the tips. B) Mutational profiles from the scRNA-seq data where 0 denotes the absence of the mutation and 1 denotes the presence of the mutation. The red 0’s (with dashed boxes) denote false negatives, due to either transcriptional bursting or allelic dropout, and the red 1’s (with dashed boxes) denote false positives, due to sequencing errors. C) The observed and cluster-specific variant allele frequencies (VAFs) associated with the bulk data. D) When considering only the bulk data, the temporal order of the mutations is inferred correctly, but the branching structure is not. SNV1 and SNV2 have similar observed VAFs, so they co-cluster at the top of the tree producing two structures that differ from the truth by one subclone. E) When considering only the single-cell data, the branching structure is inferred correctly, but the temporal order of the mutations is incorrect due to noise in the scRNA-seq data. In particular, SNV6 has two false positives that force its placement closer to the root of the tree, and SNV4 has a false negative that forces its placement closer to the tips of the tree.
Figure 2.
Figure 2.. Relationship between the true mutational status of the single cells and their observed mutational read counts.
One of the overarching goals of Canopy 2 is to infer whether a cell carries a mutation. If cell n carries mutation m (i.e., qmns=1), the observed mutational read count is generated from transcriptional bursting with bursting kinetics αm and βm that are mutation-specific. To decouple the estimation of the bursting kinetics parameters from the estimation of mutational carrier status, we estimate αm and βm from the single-cell gene expression data. If cell n does not carry mutation m (i.e., qmns=0), the observed mutational read count is generally zero but can be non-zero due to sequencing errors. Figure created with BioRender.com.
Figure 3.
Figure 3.. The workflow of the Canopy2 model.
Step 0 is optional in the sense that any method, other than the suggested methods BPSC (Vu et al., 2016) or SCALE (Jiang et al., 2017), can be utilized to estimate the parameters for bursting kinetics. In Step 1, the total read counts are pre-processed according to the pipeline in Figure S1 to obtain the alternative read counts. These counts are then inputs to Canopy 2 with probabilistic graphical representation given in Step 2. The nodes denote variables, and the arrows pointing from one node to another denote conditional dependencies between the nodes. Shaded nodes correspond to observed values (circles) or fixed values (squares), and unshaded nodes correspond to latent variables. Finally, Step 3 provides the sample output from the Canopy2 algorithm that coincides with the truth listed in Figure 1, where Z denotes the clonal configuration matrix, Ps denotes the cell-to-clone assignment matrix, and Pb denotes the sample-to-clone assignment matrix.
Figure 4.
Figure 4.. Benchmarking results assessed by estimating the error in the clonal configuration matrix
Z and cell-to-clone assignment matrix Ps. Performance evaluated over 100 random read count data initializations, varying number of A,C) mutations and B,D) subclones, single cells, and bulk samples, under high αm=1.0,βm=0.1, bursty αm=0.5,βm=0.5, and low αm=0.1,βm=1.0 gene expression levels. In A, C), results are examined at a shallow sequencing depth of 30 – 50x (left panel) and a deeper sequencing depth of 120 – 200x (right panel). In B, D), the bulk sequencing depth is maintained at 30 – 50x for all simulations. Canopy2 outperformed Canopy and Cardelino (with/without guide clonal tree) in inference of Z and Ps. Simulations employed a sequencing error rate of ϵ=0.001, scale parameter s=300 for BPSC, N=50 single cells, K=4 subclones, M=K+2 mutations, T=4 bulk samples, 20 chains, 10,000 iterations for K6 and 50,000 iterations for K>6, and 20% burn-in.
Figure 5.
Figure 5.. Case study of breast cancer and glioblastoma data.
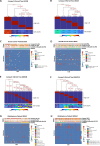
A-B) For breast cancer patients BC03 and BC07 (Chung et al., 2017), Canopy2 returned optimal configurations of four and five subclones, respectively. C-D) Canopy2 demonstrated superior accuracy in cell-to-clone assignments with fewer unassigned cells (BC03: 15.6%; BC07: 0%) compared to Canopy (BC03: 27.3%; BC07: 29.4%) and Cardelino with guide (BC03: 26.0%; BC07: 11.8%). E-F) For glioblastoma patients GBM9 and GBM10 (Lee et al., 2017), Canopy2 returned optimal configurations of eight and six subclones, respectively. G-H) Canopy2 again demonstrated superior accuracy in cell-to-clone assignments with fewer unassigned cells (GBM9: 14.7%; GBM10: 0%) compared to Canopy (GBM9: 36.4%; GBM10: 2.7%) and Cardelino with guide (GBM9: 30.2%; GBM10: 16.2%). In general, sampling was performed using 50,000 iterations, 20 chains, and 20% burn-in across 3–10 possible subclones. Despite attempting to run up to 100,000 iterations, Cardelino faced convergence issues with GBM9 and could only complete 1,000 iterations successfully.

Similar articles

References

    1. Benjamin D, Sato T, Cibulskis K, Getz G, Stewart C, Lichtenstein L. Calling somatic SNVs and indels with Mutect2. BioRxiv. 2019; p. 861054.
    1. Broeckx BJG, Peelman L, Saunders JH, Deforce D, Clement L. Using variant databases for variant prioritization and to detect erroneous genotype-phenotype associations. BMC Bioinformatics. 2017. dec; 18(1). - PMC - PubMed
    1. Carpenter B, Gelman A, Hoffman MD, Lee D, Goodrich B, Betancourt M, Brubaker M, Guo J, Li P, Riddell A. iStan/i: A Probabilistic Programming Language. Journal of Statistical Software. 2017; 76(1). - PMC - PubMed
    1. Chen H, Jiang Y, Maxwell KN, Nathanson KL, Zhang N. Allele-specific copy number estimation by whole exome sequencing. The annals of applied statistics. 2017; 11(2):1169. - PMC - PubMed
    1. Chen Z, Gong F, Wan L, Ma L. iBiTSC/i 2: Bayesian inference of tumor clonal tree by joint analysis of single-cell SNV and CNA data. Briefings in Bioinformatics. 2022. apr; 23(3). - PMC - PubMed

Publication types

LinkOut - more resources