

This is a preprint.
Distinct spatiotemporal atrophy patterns in corticobasal syndrome are associated with different underlying pathologies
- PMID: 38562801
- PMCID: PMC10984071
- DOI: 10.1101/2024.03.14.24304298
Distinct spatiotemporal atrophy patterns in corticobasal syndrome are associated with different underlying pathologies
Update in
-
Distinct spatiotemporal atrophy patterns in corticobasal syndrome are associated with different underlying pathologies.Brain Commun. 2025 Feb 11;7(2):fcaf066. doi: 10.1093/braincomms/fcaf066. eCollection 2025. Brain Commun. 2025. PMID: 40070441 Free PMC article.
Abstract
Objective: To identify imaging subtypes of the cortico-basal syndrome (CBS) based solely on a data-driven assessment of MRI atrophy patterns, and investigate whether these subtypes provide information on the underlying pathology.
Methods: We applied Subtype and Stage Inference (SuStaIn), a machine learning algorithm that identifies groups of individuals with distinct biomarker progression patterns, to a large cohort of 135 CBS cases (52 had a pathological or biomarker defined diagnosis) and 252 controls. The model was fit using volumetric features extracted from baseline T1-weighted MRI scans and validated using follow-up MRI. We compared the clinical phenotypes of each subtype and investigated whether there were differences in associated pathology between the subtypes.
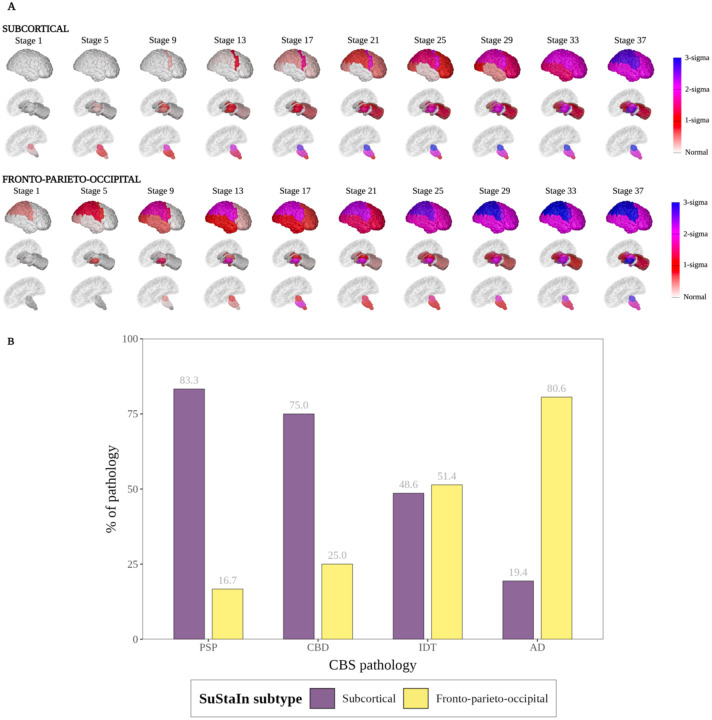
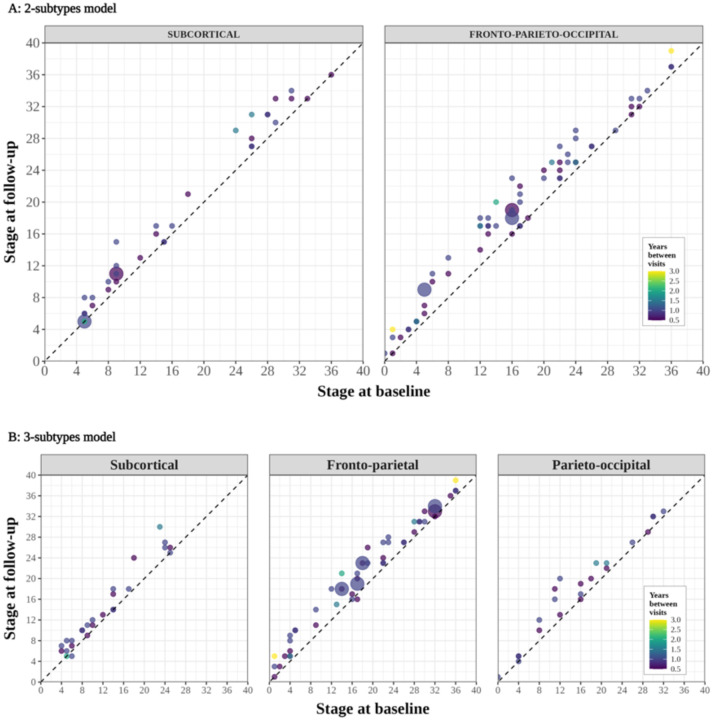
Results: SuStaIn identified two subtypes with distinct sequences of atrophy progression; four-repeat-tauopathy confirmed cases were most commonly assigned to the Subcortical subtype (83% of CBS-PSP and 75% of CBS-CBD), while CBS-AD was most commonly assigned to the Fronto-parieto-occipital subtype (81% of CBS-AD). Subtype assignment was stable at follow-up (98% of cases), and individuals consistently progressed to higher stages (100% stayed at the same stage or progressed), supporting the model's ability to stage progression.
Interpretation: By jointly modelling disease stage and subtype, we provide data-driven evidence for at least two distinct and longitudinally stable spatiotemporal subtypes of atrophy in CBS that are associated with different underlying pathologies. In the absence of sensitive and specific biomarkers, accurately subtyping and staging individuals with CBS at baseline has important implications for screening on entry into clinical trials, as well as for tracking disease progression.
Keywords: Cortico-basal syndrome; Subtype and Stage Inference; biomarkers; disease progression; machine learning.
Conflict of interest statement
Potential Conflicts of Interest The authors report no potential conflict of interests.
Figures

References
Publication types
Grants and funding
LinkOut - more resources
Full Text Sources
Miscellaneous