[Preprint]. 2024 Mar 21:rs.3.rs-3894397.
doi: 10.21203/rs.3.rs-3894397/v1.

A modular platform to generate functional sympathetic neuron-innervated heart assembloids

Affiliations

A modular platform to generate functional sympathetic neuron-innervated heart assembloids

Nadja Zeltner et al. Res Sq. .

Abstract

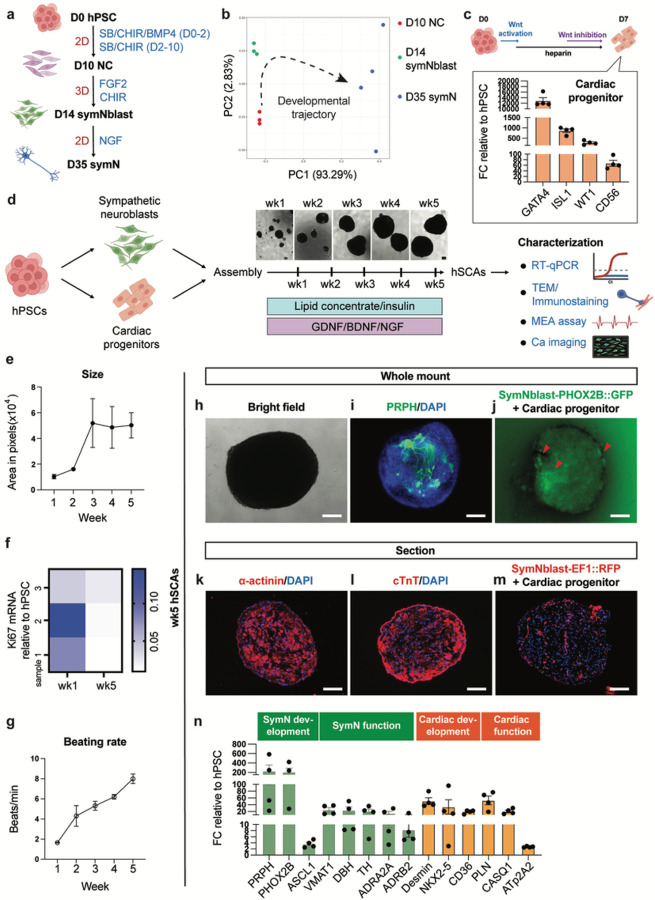
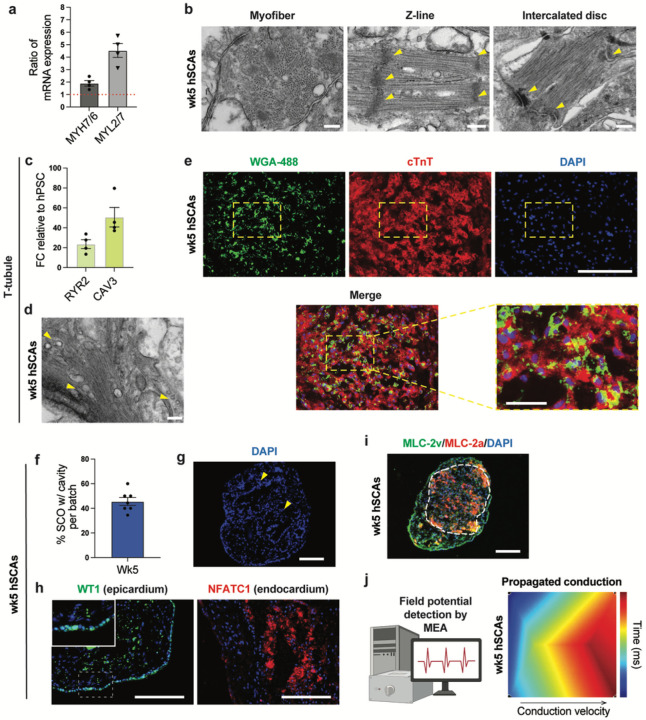
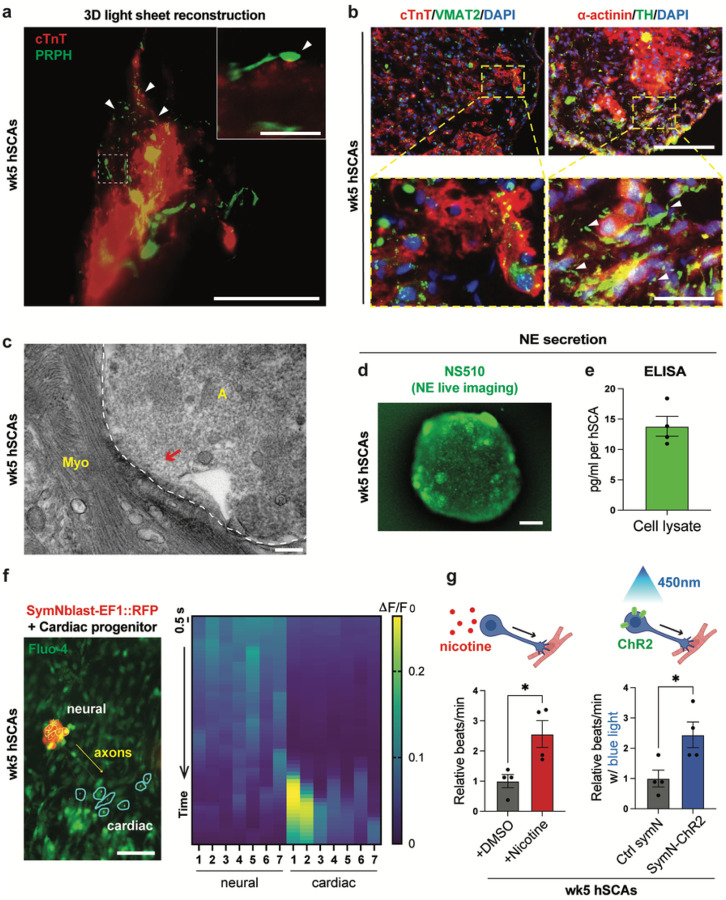
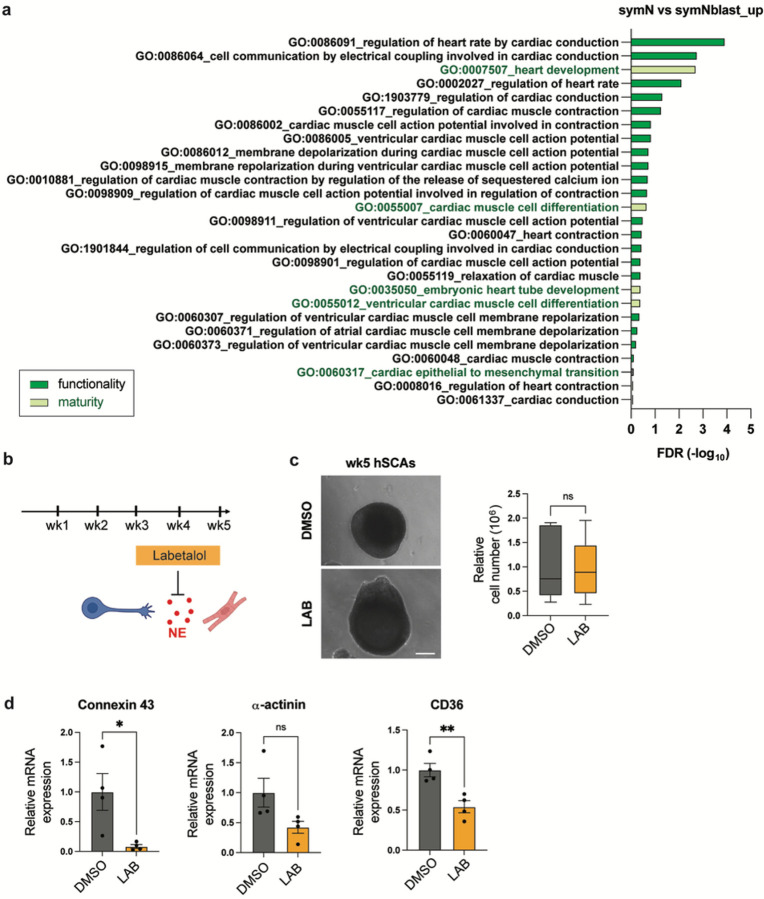
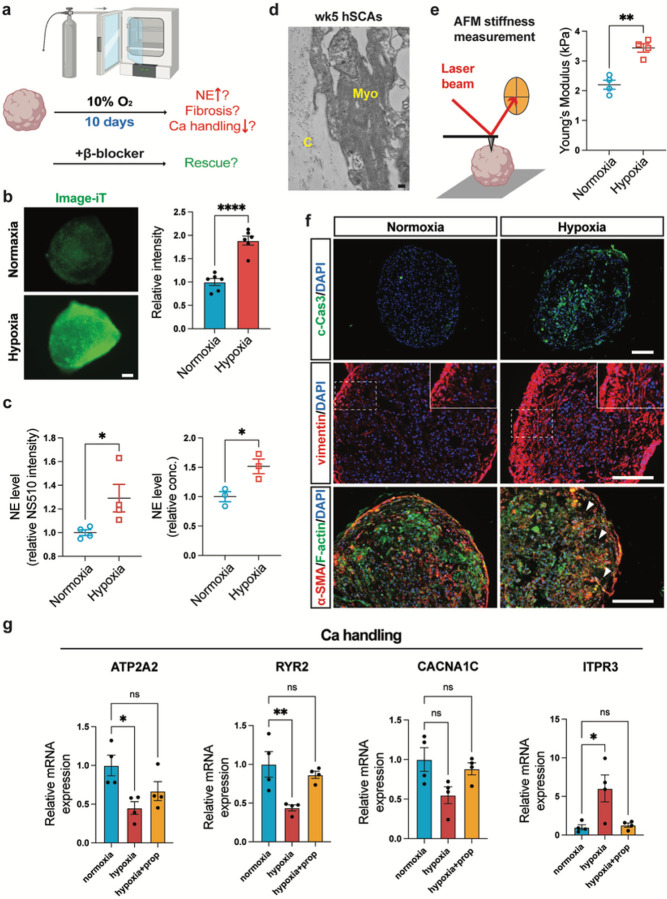
The technology of human pluripotent stem cell (hPSC)-based 3D organoid/assembloid cultures has become a powerful tool for the study of human embryonic development, disease modeling and drug discovery in recent years. The autonomic sympathetic nervous system innervates and regulates almost all organs in the body, including the heart. Yet, most reported organoids to date are not innervated, thus lacking proper neural regulation, and hindering reciprocal tissue maturation. Here, we developed a simple and versatile sympathetic neuron (symN)-innervated cardiac assembloid without the need for bioengineering. Our human sympathetic cardiac assembloids (hSCAs) showed mature muscle structures, atrial to ventricular patterning, and spontaneous beating. hSCA-innervating symNs displayed neurotransmitter synthesis and functional regulation of the cardiac beating rate, which could be manipulated pharmacologically or optogenetically. We modeled symN-mediated cardiac development and myocardial infarction. This hSCAs provides a tool for future neurocardiotoxicity screening approaches and is highly versatile and modular, where the types of neuron (symN or parasympathetic or sensory neuron) and organoid (heart, lung, kidney) to be innervated may be interchanged.


Conflict of interest statement

Confiict of interest We declare that the research was conducted without commercial or financial relationships that could be construed as a potential conflict of interest.

Figures

Figure 1
Figure 1
Assembly of hSCAs. (a) Schematic illustration of symNblast and symN differentiation from hPSCs. 2D: attached cell culture. 3D: suspending spheroid culture. (b) PCA plot showing the differentiation trajectory of symN differentiation. (c) Top: Schematic illustration of cardiac progenitor differentiation. Bottom: RT-qPCR analysis of day 7 cardiac progenitors. n=4 biological replicates. (d) Schematic illustration of hSCA assembly and differentiation. Representative right field images of hSCA growth among time. (e) Quantification of hSCA size overtime. n=3 biological replicates. (f) Heatmap of RT-qPCR analysis of wk1 and wk5 hSCAs for Ki67. n=3 biological replicates. (g) hSCA beating analysis overtime using the ImageJ Time Series Analyzer. n=6 biological replicates. (h) Representative bright field image of wk5 hSCAs. (i) Representative whole mount image of wk5 hSCAs for PRPH. (j) Representative whole mount image of wk5 hSCAs for PHOX2B::GFP reporter. (k) Representative cryosection image of wk5 hSCAs for α-actinin. (l) Representative cryosection image of wk5 hSCAs for cTnT. (m) Representative cryosection image of wk5 hSCAs for EF1::RFP reporter. (n) RT-qPCR analysis of wk5 hSCAs for symN and cardiac development markers. Error bars represent SEM. Scale bars represent 200 μm.
Figure 2
Figure 2
hSCAs are self-organized and display features of maturation. (a) RT-qPCR analysis of wk5 hSCAs for cardiac maturity markers. (b) Representative TEM images with yellow arrows indicating the myofiber, Z-line, and intercalated disc in hSCAs. Scale bars represent 200 nm. (c) RT-qPCR analysis of wk5 hSCAs for cardiac T-tubule markers. (d) Representative TEM images with yellow arrows indicating the T-tubules in hSCAs. Scale bar represents 200 nm. (e) Representative cryosection image of wk5 hSCAs which were stained for WGA-488 and cTnT to label T-tubules. Scale bars represent 200 μm, and 50 μm in the yellow dashed rectangle. (f) Quantification for the percentage of hSCAs with cavity structures. n=7 biological replicates. (g) Representative cryosection image of wk5 hSCAs with DAPI showing the cavity structures. Scale bar represents 200 μm. (h) Representative cryosection image of wk5 hSCAs for epicardial marker WT1 and endocardial marker NFATC1. Scale bars represent 200 μm. (i) Representative cryosection image of wk5 hSCAs for atrial marker MLC-2a and ventricular marker MLC-2v. Scale bar represents 200 μm. (i) Beating pattern of wk5 hSCAs was analyzed using MEA. Heatmap shows representative pattern of propagated conduction. Error bars represent SEM.
Figure 3
Figure 3
Sympathetic regulation in hSCAs. (a) Representative 3D reconstructive image of wk5 hSCAs using light sheet microscopy for cTnT and PRPH. Scale bars represent 100 μm, and 10 μm for the inset. White arrows indicate the nodal structure alone symN axons. (b) Representative cryosection image of wk5 hSCAs for symN axonal labeling using the combinations of cTnT/VMAT2 and TH/α-actinin. White arrows indicate the nodal structure alone symN axons. Scale bars represent 200 μm. (c) Representative TEM images showing the physical contact between symN axon (A) and heart muscles (Myo). White dashed line delineates the border of symN axonal terminal and muscle. Red arrow indicates the synaptic structure. Scale bar represents 200 nm. (d) Representative whole mount image of wk5 hSCAs using NS510. Scale bar represents 200 μm. (e) NE level in hSCA cell lysates was quantified by ELISA. n=4 biological replicates. (f) Left: Ca2+ imaging captured the functional coupling between symNs and cardiac tissues. Right: Quantification of the Ca2+ imaging recording showed the causal effect of symN activity to CM responsiveness. Scale bar represents 200 μm. (g) SymNs in wk5 hSCAs were activated by nicotine (NIC) or blue light. The changes of cardiac beating were quantified using image-based hSCA beating analysis. Unpaired Student’s t test. n=4 biological replicates. Error bars represent SEM. *, P<0.05.
Figure 4
Figure 4
SymNs regulate cardiac development through NE signaling in hSCAs. (a) Selected upregulated GO terms that were involved in cardiac development and regulation during symN differentiation. (b) Schematic illustration of labetalol (LAB) treatment during hSCA development. (c) Left: Representative bright field image of wk5 hSCAs treated with LAB or DMSO. Right: Cell count of wk5 hSCAs treated with LAB or DMSO. Unpaired Student’s t test. n=6 biological replicates. Scale bar represents 200 μm. (d) RT-qPCR analysis of wk5 hSCAs with LAB or DMSO for cardiac maturity markers. Unpaired Student’s t test. n=4 biological replicates. Error bars represent SEM. *, P<0.05. **, P<0.01.
Figure 5
Figure 5
hSCAs model hypoxia-induced infarction. (a) Schematic illustration of hypoxia-induced cardiac infarction model on wk5 hSCAs. (b) Left: Representative whole mount images of wk5+10 days hSCAs labeled with Image-iT hypoxic dye. Right: Quantification of Image-iT intensity. Unpaired Student’s t test. n=6 biological replicates. Scale bar represents 200 μm. (c) NE levels of hSCAs in normoxic or hypoxic environments measured by NS510 staining (n=4 biological replicates) or ELISA (n=3 biological replicates). Unpaired Student’s t test. (d) Representative TEM images showing the extracellular matrix collagen (C) that is associated with the myofibers (myo). Scale bar represents 200 nm. (e) Left: Schematic illustration of stiffness measurement for hSCAs using AFM Right: AFM confirmed the increased stiffness of hypoxic hSCAs. Unpaired Student’s t test. n=4 biological replicates (f) Representative cryosection image of wk5+10 days hSCAs for cell death and fibrosis markers. Scale bars represent 200 μm. (g) RT-qPCR analysis of wk5+10 days hSCAs for calcium handling genes. Ordinary one-way ANOVA. n=4 biological replicates. Error bars represent SEM. *, P<0.05. **, P<0.01. ****, P<0.0001.

Similar articles

References

    1. Makrygianni E.A., and Chrousos G.P. (2021). From Brain Organoids to Networking Assembloids: Implications for Neuroendocrinology and Stress Medicine. Front Physiol 12, 621970. 10.3389/fphys.2021.621970. - DOI - PMC - PubMed
    1. Vogt N. (2021). Assembloids. Nat Methods 18, 27. 10.1038/s41592-020-01026-x. - DOI - PubMed
    1. Kanton S., and Pasca S.P. (2022). Human assembloids. Development 149. 10.1242/dev.201120. - DOI - PubMed
    1. Cala G., Sina B., De Coppi P., Giobbe G.G., and Gerli M.F.M. (2023). Primary human organoids models: Current progress and key milestones. Front Bioeng Biotechnol 11, 1058970. 10.3389/fbioe.2023.1058970. - DOI - PMC - PubMed
    1. Corsini N.S., and Knoblich J.A. (2022). Human organoids: New strategies and methods for analyzing human development and disease. Cell 185, 2756–2769. 10.1016/j.cell.2022.06.051. - DOI - PubMed

Publication types

LinkOut - more resources