[Preprint]. 2024 Mar 18:2024.03.14.585066.
doi: 10.1101/2024.03.14.585066.

Validation of Enhancer Regions in Primary Human Neural Progenitor Cells using Capture STARR-seq

Affiliations

Validation of Enhancer Regions in Primary Human Neural Progenitor Cells using Capture STARR-seq

Sophia C Gaynor-Gillett et al. bioRxiv. .

Update in

Abstract

Genome-wide association studies (GWAS) and expression analyses implicate noncoding regulatory regions as harboring risk factors for psychiatric disease, but functional characterization of these regions remains limited. We performed capture STARR-sequencing of over 78,000 candidate regions to identify active enhancers in primary human neural progenitor cells (phNPCs). We selected candidate regions by integrating data from NPCs, prefrontal cortex, developmental timepoints, and GWAS. Over 8,000 regions demonstrated enhancer activity in the phNPCs, and we linked these regions to over 2,200 predicted target genes. These genes are involved in neuronal and psychiatric disease-associated pathways, including dopaminergic synapse, axon guidance, and schizophrenia. We functionally validated a subset of these enhancers using mutation STARR-sequencing and CRISPR deletions, demonstrating the effects of genetic variation on enhancer activity and enhancer deletion on gene expression. Overall, we identified thousands of highly active enhancers and functionally validated a subset of these enhancers, improving our understanding of regulatory networks underlying brain function and disease.


Conflict of interest statement

Competing interests: Kevin P. White is a shareholder of Tempus Labs, Inc. and Provaxus, Inc. All other authors declare that they have no competing interests.

Figures
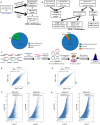
Figure 1.
Figure 1.. Panel design and quality control results.
(A) and (B) show the process for candidate enhancer selection for Panel 1 (A) and Panel 2 (B). See Materials and Methods for a complete description of candidate selection. (C) demonstrates the experimental workflow. Sheared genomic DNA was hybridized to probes specific for the candidate enhancer regions. These regions were then cloned into the STARR-seq plasmid and transfected into phNPCs. (D) and (E) show the fold change correlation between the two technical replicates for Panel 1 (D) and Panel 2 (E). Pearson r2 values are included on the graphs. (F) and (G) are volcano plots representing the tested enhancer regions. Regions that had significant peaks as determined by STARRPeaker are in dark blue while non-significant regions are in light blue. Abbreviations: PFC = prefrontal cortex; PEC = PsychENCODE Consortium; BP = bipolar disorder; SZ = schizophrenia; GWAS = genome-wide association study; NPC = neural progenitor cell; FDR = false discovery rate; FC = fold change.
Figure 2.
Figure 2.. Expression of TFs with enriched binding site motifs.
Expression score is displayed on the X-axis. A higher expression score indicates a more highly expressed gene. For each plot, the solid line represents the median expression score while the “X” represents the mean expression score. Expression scores were compared using a two-tailed t-test. The expression of motif-enriched TFs from Panel 1 did not differ significantly from the expression of random TFs (p = 0.211). The expression of motif-enriched TFs from Panel 2 was significantly higher than the expression of random TFs (p = 0.0052).
Figure 3.
Figure 3.. Pathway analysis results from Enrichr.
(A) and (B) depict results from the gene ontology (GO) knowledgebase - biological process (A) and cellular component (B). (C) depicts results from the KEGG database. (D) depicts results from DisGeNET examining gene-disease associations. The p-values for each category are included on the bars for each category. The asterisks (*) indicate that the adjusted p-value for that category is also significant (<0.05). Enrichr calculates p-values using the Fisher exact test and adjusted p-values using the Benjamini-Hochberg method.
Figure 4.
Figure 4.. MutSTARR-seq results comparing enhancer activity (log2fc) between the reference allele (ref) and alternate allele (alt).
Box plots represent the distribution of activity across four technical replicates. Enhancer activity is defined by log2 fold change, which represents the normalized output/input ratio in log2 space. Variants that had a nominally significant effect on enhancer activity (p < 0.05 before multiple testing correction) are boxed in red. P-values were calculated using a Chi-squared test. The variant that survived correction for multiple testing (p-value adjusted = 0.005) is boxed in green. Correction for multiple testing was done using Bonferroni and Benjamini-Hochberg methods. Abbreviations: log2fc = log2 fold change, NPC = neural progenitor cell, SNV = single nucleotide variant, ref = reference allele, alt = alternate allele.
Figure 5.
Figure 5.. CRISPR/Cas9 enhancer knockout (KO).
(A-D), left: DNA agarose gel image of the genotyping PCR results after KO of candidate enhancers in phNPCs through ribonucleoprotein (RNP)-mediated CRISPR/Cas9 genome editing. Control cells undergoing the same electroporation without any RNPs showed a clear strong WT band. For enhancer KO samples, besides the higher WT band, there is an additional clearly visible lower band in both BR1 and BR2 samples. The sizes of these lower bands are the same as the expected size of genome edited bands after enhancer KO. (A-D), right: TaqMan qPCR Probe assay showed diminished expression level of the target gene after enhancer KO. CT values from triplicates were used to calculate the expression of the target gene relative to control cells using the Pfaffl method. Averages of the BR1 and BR2 and standard deviations are shown as error bars. (A) Left: EH37E1198822 KO genotyping PCR result (WT band: 3375 bp, genome edited band: 850 bp). Right: relative expression level change of the target gene NGEF after enhancer KO. (B) Left: EH37E1000386 genotyping PCR result (WT band: 1938 bp, genome edited band: 809 bp). Right: relative expression level change of the target gene RORB after enhancer KO. (C) Left: EH37E0114246 genotyping PCR result (WT band: 1849 bp, genome edited band: 1205 bp). Right: relative expression level change of the target gene PLEKHO1 after enhancer KO. (D) Left: EH37E0426064 genotyping PCR result (WT band: 3069 bp, genome edited band: 2203 bp). Right: relative expression level change of the target gene TOM1L2 after enhancer KO. Abbreviations: Cells, +e = phNPCs cells without RNPs underwent the same electroporation served as control; NTC = PCR non template control; BR = biological replicate.

Similar articles

References

    1. Substance Abuse and Mental Health Services Administration. (HHS Publication No. PEP21-07-01-003, NSDUH Series H-56, 2021).
    1. Merikangas K. R., He J. P., Burstein M., Swanson S. A., Avenevoli S., Cui L., Benjet C., Georgiades K., Swendsen J., Lifetime prevalence of mental disorders in U.S. adolescents: results from the National Comorbidity Survey Replication--Adolescent Supplement (NCS-A). J Am Acad Child Adolesc Psychiatry 49, 980–989 (2010). - PMC - PubMed
    1. Robinson N., Bergen S. E., Environmental Risk Factors for Schizophrenia and Bipolar Disorder and Their Relationship to Genetic Risk: Current Knowledge and Future Directions. Front Genet 12, 686666 (2021). - PMC - PubMed
    1. Horwitz T., Lam K., Chen Y., Xia Y., Liu C., A decade in psychiatric GWAS research. Mol Psychiatry 24, 378–389 (2019). - PMC - PubMed
    1. Barešić A., Nash A. J., Dahoun T., Howes O., Lenhard B., Understanding the genetics of neuropsychiatric disorders: the potential role of genomic regulatory blocks. Mol Psychiatry 25, 6–18 (2020). - PMC - PubMed

Publication types