[Preprint]. 2024 Mar 22:rs.3.rs-4082064.
doi: 10.21203/rs.3.rs-4082064/v1.

Molecular architecture of primate specific neural circuit formation

Affiliations

Molecular architecture of primate specific neural circuit formation

Tomomi Shimogori et al. Res Sq. .

Abstract

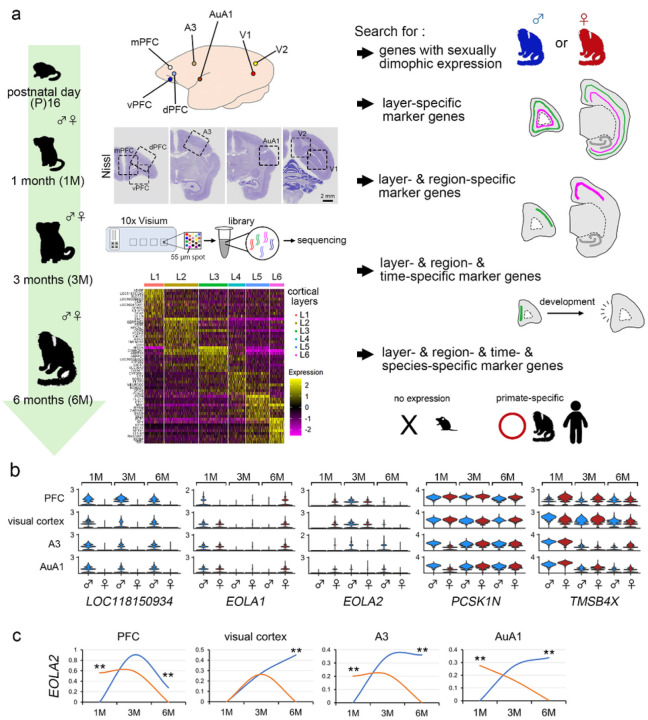
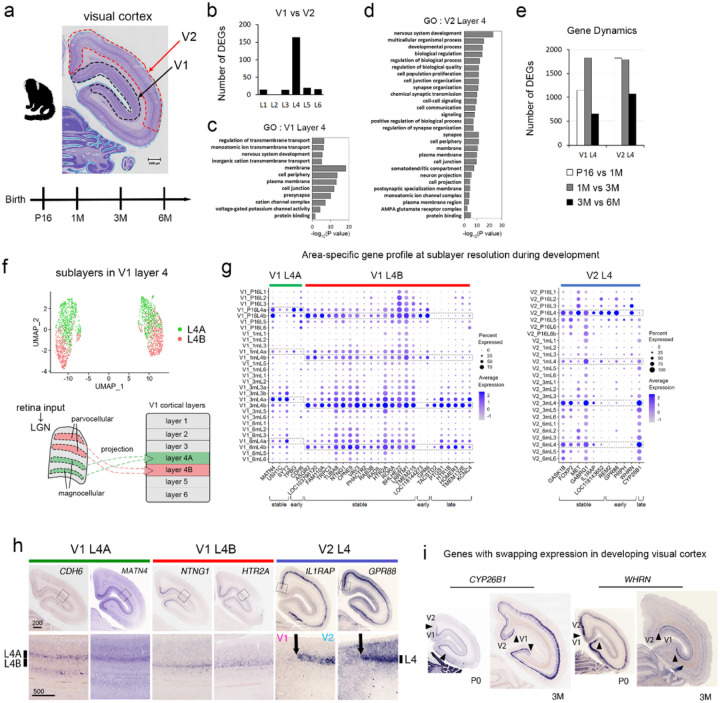
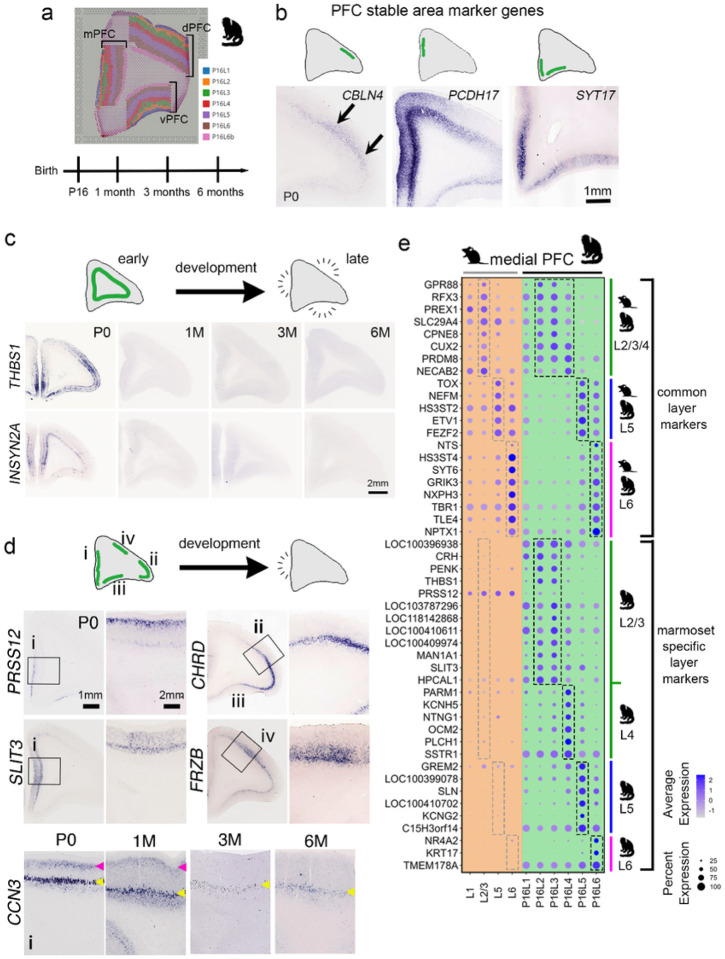
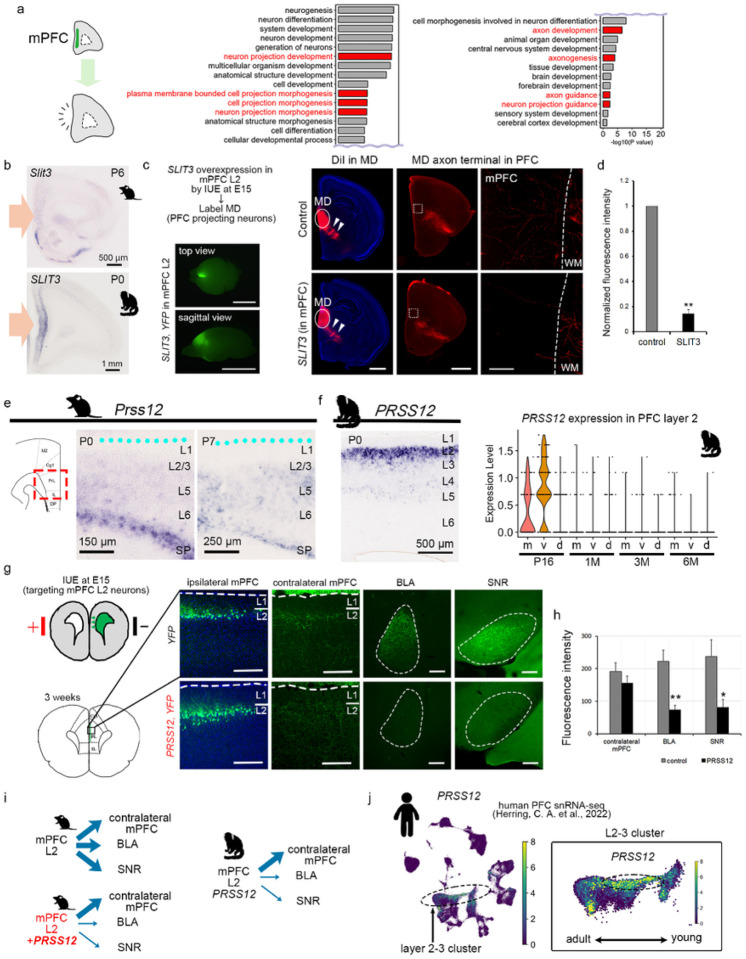
The mammalian cortex is a highly evolved brain region, but we still lack a comprehensive understanding of the molecular mechanisms underlying primate-specific neural circuits formation. In this study, we employed spatial transcriptomics to assess gene expression dynamics in the marmoset cortex during development, focusing on key regions and time points. Spatial transcriptomics identified genes that are sexually, spatially, and temporally differentially expressed in the developing marmoset cortex. Our detailed analysis of the visual cortex unveiled dynamic changes in gene expression across layers with distinct projections and functions. Notably, we discovered numerous axon guidance molecules with spatiotemporal expression patterns unique to the developing marmoset prefrontal cortex (PFC), which control PFC neuronal circuits. Among these molecules, PRSS12 (Protease, Serine, 12 (neurotrypsin, motopsin), when ectopically expressed in the mouse prelimbic cortex, caused similar changes in connectivity as observed in the marmoset A32 area. Furthermore, PRSS12 showed similar expression patterns in both marmoset and human PFC during development, suggesting parallels between marmoset and human brain development. The differential expression of axon guidance molecules in the developing PFC, varying by region, likely contributes to the formation of unique circuits observed in primates.


Conflict of interest statement

Declaration of interests The authors declare no competing financial interests.

Figures

Figure 1
Figure 1
Sexually dimorphic gene expression in the marmoset developing cortex (a) Sample preparation from developing marmosets for 10x Visium analysis. Cortical areas from medial prefrontal cortex (mPFC), ventral PFC (vPFC), dorsal PFC (dPFC), A3, AuA1, V1, and V2 were analyzed. The areas analyzed for mPFC, vPFC, dPFC, A3, AuA1, V1, and V2, enclosed by a black dashed square, were shown in the images of Nissl staining of the 1-month marmoset brain. The brains were collected from postnatal day (P) 16, 1-month (1M), 3-months (3M), and 6-months (6M) marmosets. The target region from a fresh frozen section of the marmoset cortex and placing it on a 6.5 × 6.5 mm 10x Visium platform. The heat map displays markers across cortical layer cell populations, presenting the expression of the top 10 genes in the 1M AuA1 cortical layers. (b) Violin plots indicate gene expression levels for LOC118150934, EOLA1, EOLA2, PCSK1N, and TMSB4X in each region (PFC, visual cortex, A3, and AuA1) for males and females at 1M, 3M, and 6M. (c)Trends in gene expression are depicted as graphs for each region (PFC, visual cortex, A3, and AuA1), with males represented by blue lines and females by orange lines, showing different expression patterns over time. The graph indicates the average expression of EOLA2 in males and females at 1M, 3M, and 6M. Statistical analysis was conducted using the Wilcoxon Rank Sum test with Bonferroni correction (**P < 0.01).
Figure 2
Figure 2
Stable cortical layer marker genes in the developing marmoset cortex (a) The clusters for the P16 PFC and A3 cortical layers (layer 1 (L1), layer 2 (L2), layer 3 (L3), layer 4 (L4), layer 5 (L5), layer 6 (L6)) were displayed in the registered spatial images (upper panels). Additionally, the clusters for 1M AuA1 and visual cortex (V1 and V2) cortical layers (L1, L2, L3, L4, L5, and L6)) were displayed in the registered spatial images (upper panels). Molecularly distinct clusters of cortical layers for PFC, A3, AuA1, and visual cortex were visualized on the UMAP (lower panels). (b) The clusters for cortical layers identified stable cortical layer marker genes in the developing marmoset cortex. The expression of stable cortical layer marker genes in each layer were shown in the dot plots for A3 (left panel) and AuA1 (right panel) during development (P16, 1M, 3M, and 6M). (c) The stable cortical layer marker genes were confirmed in the developing marmoset cortex. In situ hybridization (ISH) confirmed the specific cortical layer expression for NDNF(L1), CALB2 (L2), CPNE8 (L3), PLCH1 (L4), RORB (L4), ETV1 (L5), FEZF2 (L5), TLE4 (L6), and SYT6 (L6) in PFC, A3, AuA1, and V1 at P0. Scale bars: 1 mm.
Figure 3
Figure 3
Spatiotemporal gene expression at sublayer resolution in the developing visual cortex (a) A schematic representation illustrates the time course for 10x Visium analysis of V1 (black dashed line) and V2 (red dashed line), as shown in the Nissl image. (b) The number of conserved differentially expressed genes (DEGs) was extracted from the comparison of each layer of V1 and V2 at same time period. (c, d) Gene ontology (GO) analysis from the comparison between V1 L4 and V2 L4. The graphs show GO terms associated with V1 L4 (c) and V2 L4 (d) for biological process (BP), cellular component (CC), and molecular function (MF). Common GO terms were extracted from the comparison at each time period (P16, 1M, 3M, and 6M). For V2 L4 graph (d), top 15 GO terms for BP were shown in the graph. (e) The comparison of DEGs in L4 at each period was conducted separately for V1 and V2. The graph indicates the number of DEGs between P16 L4 and 1M L4 (white bars), 1M L4 and 3M L4 (gray bars), and 3M L4 and 6M L4 (black bars) in V1 and V2, respectively. (f) A UMAP illustrates molecularly distinct clusters for V1 L4 sublayers during development (V1 L4A; green dots and V1 L4B; red dots). The schema shows that V1 L4A and V1L4B receive input from the magnocellular layers (green) and parvocellular layers (red) of lateral geniculate nucleus (LGN), respectively. (g) Dot plots illustrate stably and transiently enriched genes in V1 L4A, V1 L4B, and V2 L4 during development. (h) ISH confirmed the unique expression patterns of marker genes in visual cortex at P0 (NTNG1 and MATN4in V1 L4A, NTNG1 and HTR2A in V1 L4B, and IL1RAP and GPR88 in V2 L4) (i) Genes with swapping expression in the visual cortex during development were validated by ISH at P0 and 3M, demonstrating dynamic gene expression for CYP26B1 and WHRN in a particular layer of visual cortex.
Figure 4
Figure 4
Identification of genes specific to area, time, and both area and time in the developing marmoset PFC (a) Schema for 10x Visium analysis of developing marmoset PFC. A representative image for the clusters of cortical layers for each region (mPFC, vPFC, dPFC) was presented in the registered spatial image at P16. (b) Confirmation of expression patterns for PFC stable area marker genes within PFC. ISH validated the enriched expression of area marker genes within PFC at P0 (CBLN4 in dPFC, PCDH17 in mPFC, and SYT17 in vmPFC and vPFC). (c) Confirmation of expression patterns for PFC temporal marker genes within PFC. ISH for THBS1 and INSYN2A validated the enriched expression at early developmental stage in the developing PFC (P0, 1M, 3M, and 6M). (d) Confirmation of expression patterns for PFC spatiotemporal marker genes within PFC. ISH for PRSS12, SLIT3, CHRD, FRZB, and CCN3 validated area-, time-, layer-specific expression in developing PFC. Each PFC region is indicated in the schema (i: mPFC, ii: dlPFC, iii: vmPFC, iv: dmPFC). (e) A dot plot showed distinct cortical layer marker genes in mPFC between mice and marmosets. Comparison of mPFC layer marker genes between P7 mice and P16 marmosets identified conserved and marmoset-specific layer marker genes in the developing mPFC. The upper panel displays conserved mPFC layer marker genes between species, while the lower panel displays marmoset-specific mPFC layer marker genes.
Figure 5
Figure 5
Marmoset specific genes control PFC neural circuits. (a) GO analysis from the comparison between P16 mPFC and 3M mPFC. The graphs show GO terms showing similarity to the category of “nervous system development” for biological process (BP). (b) ISH confirmed SLIT3 is highly expressed in marmoset mFPC at P0 not in mice mPFC at P6. (c) Schema of over expression of SLIT3 in mouse mPFC L2 neurons using IUE. Brains were harvested at P6 or 7, then DiI crystal was placed on MD of hemi-dissected brains to label MD neurons. Representative images showed co-electroporated YFP expression in mouse mPFC. Scale bars, 5 mm. Representative images showed Dil-labelled MD axons (white arrows) in MD regions and PFC in control and SLIT3-overexpressed brains. Scale bars, 1 mm. The mPFC regions are shown in the high-magnification images of the white dotted boxes. The white dashed lines indicate the border between white matters and gray matters. Scale bar, 100 mm. (d) Quantitative analysis of fluorescent intensities in mPFC of control and SLIT3-overexpression brains. The values normalized with control indicate the mean ± SEM. Mann-Whitney U test, **P < 0.01. (e) ISH showed Prss12 expression at P0 and P7 mouse mPFC. The surface of this part is marked by the blue dots. (f) ISH validated the layer 2-specific expression for PRSS12 in the mPFC of marmoset at P0. Additionally, a violin plot showed dynamic expression for PRSS12 during development in marmoset PFC from P16 to 6M. (g) Schema of over expression of PRSS12 in mouse mPFC L2 neurons using IUE. Brains were harvested at 3 weeks and co-electroporated YFP expression in cell bodies and fibers are observed in electroporation site, contralateral mPFC, BLA, and SNR. Scale bars, 200 mm. (h) Quantitative analysis of fluorescent intensities in each region. The values indicate the mean ± SEM. Mann-Whitney U test, *P < 0.05 and **P < 0.01. (i) The cartoon depicts the projection patterns from mPFC L2 neurons to contralateral mPFC, BLA, and SNR in mice and marmoset. In mice, mPFC L2 neurons project to the contralateral mPFC, BLA, SNR in control. However, PRSS12 overexpressing mouse mPFC L2 neurons showed decreased projection to BLA and SNR. Similarly, the marmoset A32 exhibits less projection to BLA and SNR compared to contralateral mPFC. (j) The scRNA-seq data from the human PFC exhibited similar expression patterns of PRSS12 compared to marmosets. PRSS12 is predominantly expressed in L2–3 cluster (highlighted by a black dashed circle in the left panel) during early developmental stages (highlighted by a black dashed circle in the right panel).

Similar articles

References

    1. Fuster J. M. The prefrontal cortex. Fifth edition. edn, (Elsevier/AP, Academic Press is an imprint of Elsevier, 2015).
    1. Molnar Z. et al. New insights into the development of the human cerebral cortex. J Anat 235, 432–451, doi:10.1111/joa.13055 (2019). - DOI - PMC - PubMed
    1. Okano H. Current Status of and Perspectives on the Application of Marmosets in Neurobiology. Annu Rev Neurosci 44, 27–48, doi:10.1146/annurev-neuro-030520-101844 (2021). - DOI - PubMed
    1. Okano H. & Mitra P. Brain-mapping projects using the common marmoset. Neurosci Res 93, 3–7, doi:10.1016/j.neures.2014.08.014 (2015). - DOI - PubMed
    1. Okano H. et al. Brain/MINDS: A Japanese National Brain Project for Marmoset Neuroscience. Neuron 92, 582–590, doi:10.1016/j.neuron.2016.10.018 (2016). - DOI - PubMed

Publication types

LinkOut - more resources