[Preprint]. 2024 Mar 20:2024.03.19.24304530.
doi: 10.1101/2024.03.19.24304530.

Genome-wide analyses identify 21 infertility loci and over 400 reproductive hormone loci across the allele frequency spectrum

Samvida S Venkatesh  1   2 Laura B L Wittemans  3   4 Duncan S Palmer  1   5 Nikolas A Baya  1   2 Teresa Ferreira  1 Barney Hill  1   5 Frederik Heymann Lassen  1   2 Melody J Parker  1   6 Saskia Reibe  1   5 Ahmed Elhakeem  7   8 Karina Banasik  9   10 Mie T Bruun  11 Christian Erikstrup  12   13 Bitten A Jensen  14 Anders Juul  15   16 Christina Mikkelsen  17   18 Henriette S Nielsen  19   20 Sisse R Ostrowski  17   20 Ole B Pedersen  20   21 Palle D Rohde  22 Erik Sorensen  17 Henrik Ullum  23 David Westergaard  9   10 Asgeir Haraldsson  24   25 Hilma Holm  26 Ingileif Jonsdottir  24   26 Isleifur Olafsson  27 Thora Steingrimsdottir  24   28 Valgerdur Steinthorsdottir  26 Gudmar Thorleifsson  26 Jessica Figueredo  29 Minna K Karjalainen  30   31   32 Anu Pasanen  33 Benjamin M Jacobs  34 Nikki Hubers  35   36 Genes & Health Research TeamEstonian Biobank Research TeamEstonian Health Informatics Research TeamDBDS Genomic ConsortiumFinnGenMargaret Lippincott  37   38 Abigail Fraser  7   8 Deborah A Lawlor  7   8 Nicholas J Timpson  7   8 Mette Nyegaard  22 Kari Stefansson  24   26 Reedik Magi  29 Hannele Laivuori  30   39   40   41 David A van Heel  42 Dorret I Boomsma  35   36 Ravikumar Balasubramanian  37   38 Stephanie B Seminara  37   38 Yee-Ming Chan  38   43 Triin Laisk  29 Cecilia M Lindgren  1   2   4   44
Affiliations

Genome-wide analyses identify 21 infertility loci and over 400 reproductive hormone loci across the allele frequency spectrum

Samvida S Venkatesh et al. medRxiv. .

Update in

  • Genome-wide analyses identify 25 infertility loci and relationships with reproductive traits across the allele frequency spectrum.
    Venkatesh SS, Wittemans LBL, Palmer DS, Baya NA, Ferreira T, Hill B, Lassen FH, Parker MJ, Reibe S, Elhakeem A, Banasik K, Bruun MT, Erikstrup C, Aagard Jensen B, Juul A, Mikkelsen C, Nielsen HS, Ostrowski SR, Pedersen OB, Rohde PD, Sørensen E, Ullum H, Westergaard D, Haraldsson A, Holm H, Jonsdottir I, Olafsson I, Steingrimsdottir T, Steinthorsdottir V, Thorleifsson G, Figueredo J, Karjalainen MK, Pasanen A, Jacobs BM, Kalantzis G, Hubers N; Genes & Health Research Team; Estonian Biobank Research Team; Estonian Health Informatics Research Team; DBDS Genomic Consortium; FinnGen; Lippincott M, Fraser A, Lawlor DA, Timpson NJ, Nyegaard M, Stefansson K, Magi R, Laivuori H, van Heel DA, Boomsma DI, Balasubramanian R, Seminara SB, Chan YM, Laisk T, Lindgren CM. Venkatesh SS, et al. Nat Genet. 2025 May;57(5):1107-1118. doi: 10.1038/s41588-025-02156-8. Epub 2025 Apr 14. Nat Genet. 2025. PMID: 40229599 Free PMC article.

Abstract

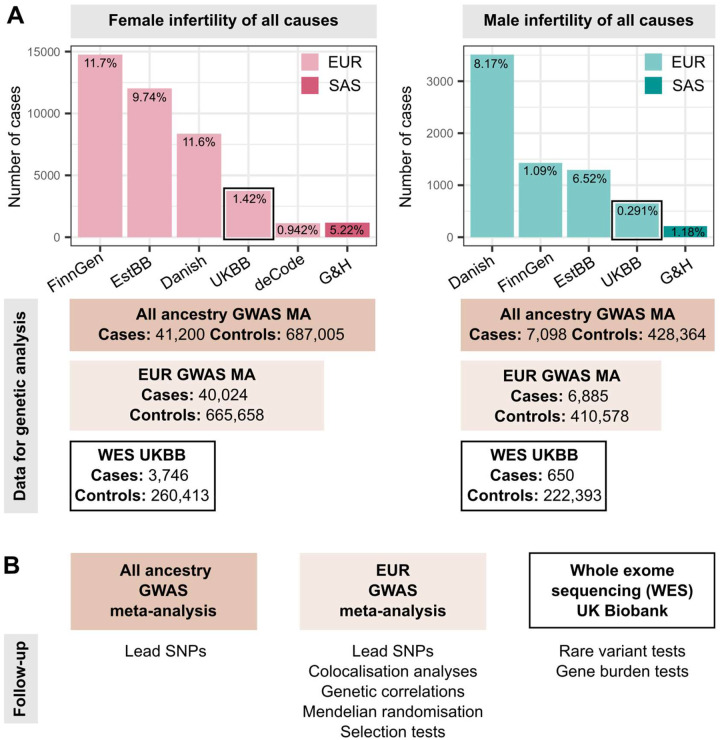
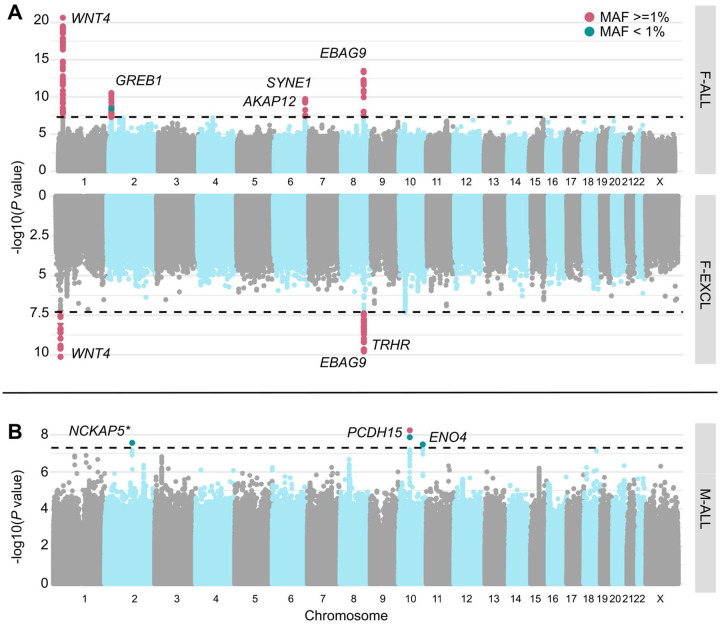
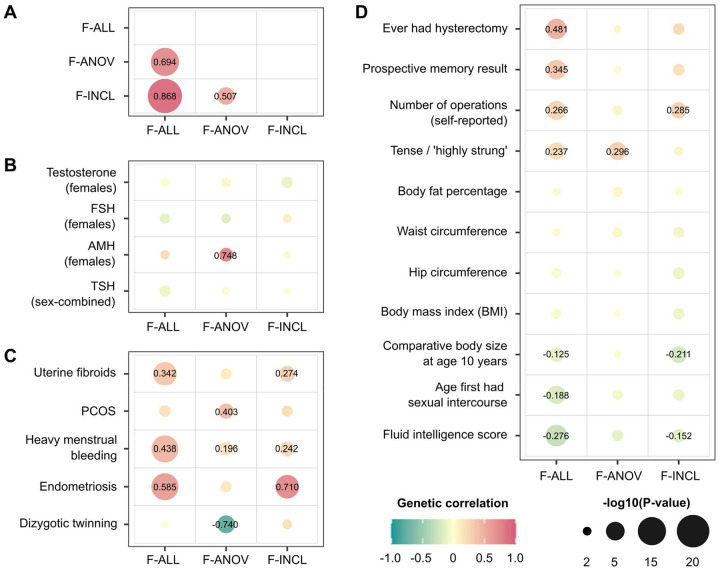
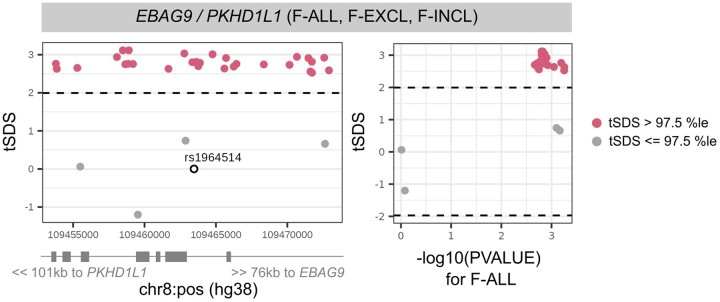
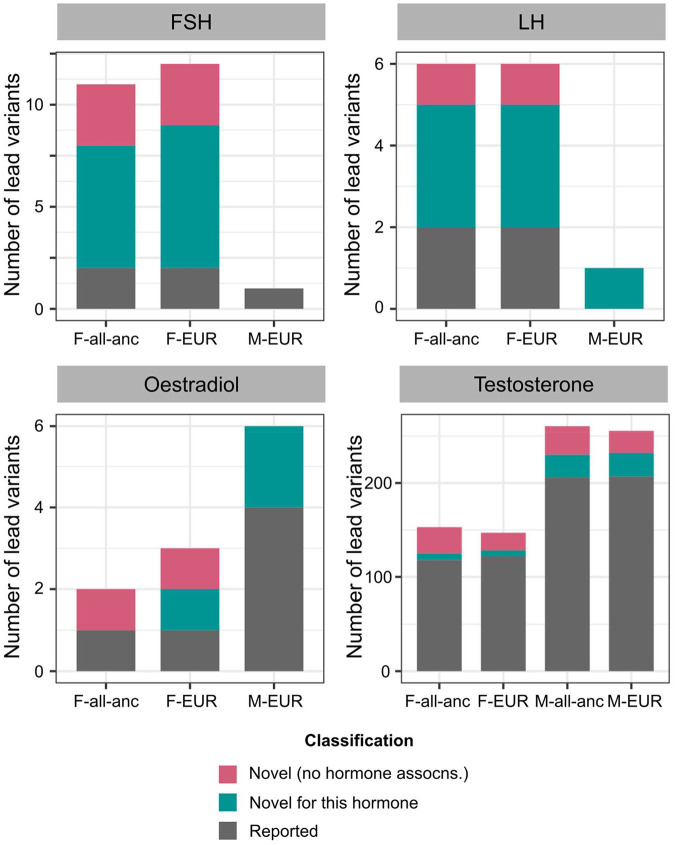
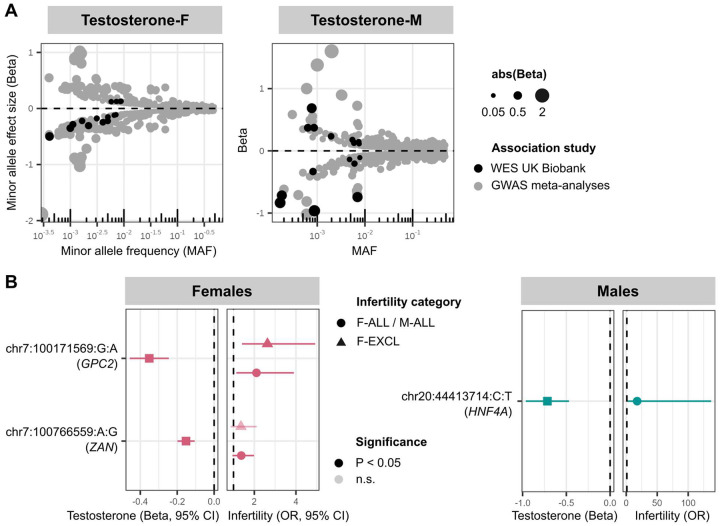
Genome-wide association studies (GWASs) may help inform treatments for infertility, whose causes remain unknown in many cases. Here we present GWAS meta-analyses across six cohorts for male and female infertility in up to 41,200 cases and 687,005 controls. We identified 21 genetic risk loci for infertility (P≤5E-08), of which 12 have not been reported for any reproductive condition. We found positive genetic correlations between endometriosis and all-cause female infertility (r g=0.585, P=8.98E-14), and between polycystic ovary syndrome and anovulatory infertility (r g=0.403, P=2.16E-03). The evolutionary persistence of female infertility-risk alleles in EBAG9 may be explained by recent directional selection. We additionally identified up to 269 genetic loci associated with follicle-stimulating hormone (FSH), luteinising hormone, oestradiol, and testosterone through sex-specific GWAS meta-analyses (N=6,095-246,862). While hormone-associated variants near FSHB and ARL14EP colocalised with signals for anovulatory infertility, we found no r g between female infertility and reproductive hormones (P>0.05). Exome sequencing analyses in the UK Biobank (N=197,340) revealed that women carrying testosterone-lowering rare variants in GPC2 were at higher risk of infertility (OR=2.63, P=1.25E-03). Taken together, our results suggest that while individual genes associated with hormone regulation may be relevant for fertility, there is limited genetic evidence for correlation between reproductive hormones and infertility at the population level. We provide the first comprehensive view of the genetic architecture of infertility across multiple diagnostic criteria in men and women, and characterise its relationship to other health conditions.


Conflict of interest statement

Competing Interests Statement L.B.L.W. is currently employed by Novo Nordisk Research Centre Oxford but, while she conducted the research described in this manuscript, was only affiliated to the University of Oxford. V.S., G.T., H.H., I.J., and K.S. are employees of deCODE genetics, a subsidiary of Amgen. C.M.L. reports grants from Bayer AG and Novo Nordisk and has a partner who works at Vertex. The other authors declare no conflicts of interest.

Figures

Figure 1.
Figure 1.. Overview of study cohorts and analyses presented for infertility genetic association studies.
(A) Case numbers in each cohort contributing cases to genome-wide association study (GWAS) meta-analyses (MA) for female (left) and male (right) infertility. The prevalence of all-cause infertility in each cohort (%) is noted on the barplots. EUR=European ancestry, SAS=South Asian ancestry. EstBB=Estonian Biobank, Danish=Danish Blood Donor Study/Copenhagen Hospital Biobank, UKBB=UK Biobank, G&H=Genes and Health cohort. Total case and control counts for each type of genetic analysis: all ancestry GWAS meta-analysis (dark rectangles), EUR-only GWAS meta-analysis (light rectangles), and UK Biobank whole exome sequencing (WES) analyses (black outlined rectangles) are displayed. Male infertility in deCode, with <100 cases, was excluded from GWAS MA. Note the different Y-axis scales in each subplot. (B) Downstream analyses performed for each type of genetic analysis: lead variants were identified via distance-based pruning for all-ancestry and EUR-only GWAS meta-analyses; colocalisation, genetic correlation, and selection analyses were only performed for EUR meta-analyses due to the need for ancestry-matched linkage disequilibrium (LD) information; rare variant and gene burden tests were performed with WES data for the UK Biobank EUR-ancestry subset.
Figure 2.
Figure 2.. Miami and Manhattan plots for selected infertility meta-analyses.
(A) Genetic variants associated with female infertility of all causes (F-ALL) (top) and idiopathic infertility (unknown causes) defined by exclusion of known causes such as anatomical or anovulatory causes, PCOS, endometriosis, or uterine leiomyomas (bottom). (B) Genetic variants associated with male infertility of all causes (M-ALL). Each point depicts a single SNP, with genome-wide significant (GWS) SNPs (P<5E-08, dashed line) coloured in pink for common variants with minor allele frequency (MAF)>=1% and green for those with MAF<1%. SNPs are annotated with the mapped gene. * indicates that lead variant is reported in only one cohort.
Figure 3.
Figure 3.. Genetic correlations between female infertility and other phenotypes.
SNP-based genetic correlations (rg) between significantly heritable phenotypes (Z>4) were estimated using LD-score regression, performed using the LDSC software on a subset of 1 million HapMap3 SNPs. Points are coloured by rg estimate, scaled by significance (−log10(P)), and labelled with the associated rg estimate if nominally significant without correction for multiple testing (P<0.05). (A) Genetic correlations among the three significantly heritable definitions of female infertility (all cause=F-ALL, anovulatory=F-ANOV, and idiopathic infertility defined by inclusion=F-INCL). (B) Genetic correlations between female infertility traits and reproductive hormones: testosterone, follicle stimulating hormone (FSH), and anti-Mullerian hormone (AMH, publicly available summary statistics) in female-specific analyses, and thyroid stimulating hormone (TSH, publicly available summary statistics) from sex-combined analysis. (C) Genetic correlations between female infertility traits and female reproductive conditions, with summary statistics generated from the largest available European-ancestry studies for each trait (see Methods). PCOS=polycystic ovary syndrome. (D) Genetic correlations between female infertility traits and selected heritable phenotypes (Z>4) in the UK Biobank, as generated by the Neale lab. Correlations with all heritable phenotypes can be found in Supp. Table 12.
Figure 4.
Figure 4.. Directional selection scores at infertility-associated EBAG9 locus.
Recent directional selection, as measured by trait-aligned Singleton Density Scores (tSDSs) at the EBAG9 locus. The window of +/− 10 kb around the lead variant associated with female infertility of all causes (F-ALL) is displayed, along with the location of nearest gene transcription start sites (TSSs). The tSDSs are aligned to the infertility-risk increasing allele, wherein a positive tSDS indicates positive selection for infertility-risk increasing allele at the locus. Dashed lines indicate 2.5th percentile (%ile) and 97.5th %ile of SDSs, and variants below or above this threshold respectively are coloured in pink. Left: Locus plots depicting genomic position on the x-axis and tSDS on the y-axis. The lead variant rs1964514 (open circle) is not present in the tSDS dataset and thus assigned a score of 0. Right: Scatter plots depicting relationship between −log10 of the GWAS p-value for the variant association with F-ALL on the x-axis and tSDS on the y-axis.
Figure 5.
Figure 5.. Number of novel and reported reproductive hormone associations.
Each panel displays a different hormone (FSH=follicle-stimulating hormone, LH=luteinising hormone). Lead variants in each analysis stratum (F=female-specific, M=male-specific, all-anc=all ancestry meta-analysis, EUR=European-only meta-analysis) are classified as: (1) novel (no hormone associations) if they are not in LD (r<0.1) with, and conditionally independent of (conditional P-value Pcond<0.05), any variants within a 1Mb window of the lead variant that are associated with 28 reproductive hormones in the GWAS Catalog, plotted in pink, (2) novel for this hormone if they are not in LD (r<0.1) with, and conditionally independent of (Pcond<0.05), the respective hormone-associated variants within a 1Mb window of the lead variant, plotted in green, and (3) reported otherwise, plotted in grey. Note the different Y-axis scales in each subplot. assocns.=associations.
Figure 6.
Figure 6.. Rare variants associated with testosterone and infertility in UK Biobank whole exome sequencing (WES) analyses.
(A) Effect size versus allele frequency of genetic variants associated with total testosterone. Variants discovered at genome-wide significance (P<5E-08) in GWAS meta-analyses (coloured in grey) and exome-wide significance in the UK Biobank WES analyses (coloured in black) are plotted, sized by the absolute value of their effect size. Effect sizes are aligned to the minor allele, plotted against MAF on the log x-axis. (B) Effects of testosterone-associated rare variants on infertility in females (left) and males (right). Per gene, the variant with lowest P-value of all variants that reach exome-wide significance (P<1E-07) in UK Biobank WES analyses for testosterone is displayed, for all variants with nominally significant effects on infertility. Effect sizes (β and 95% confidence intervals (CIs) for the variant effect on testosterone are to the left of each plot, and effect sizes (odds ratios (ORs) and 95% CIs) for the variant effect on infertility are to the right of each plot. Variants that reach nominal significance (P<0.05) are coloured in solid shapes.

References

    1. Infertility prevalence estimates, 1990–2021. https://www.who.int/publications/i/item/978920068315 (2023).
    1. Brandt J. S., Cruz Ithier M. A., Rosen T. & Ashkinadze E. Advanced paternal age, infertility, and reproductive risks: A review of the literature. Prenat. Diagn. 39, 81–87 (2019). - PubMed
    1. Crawford N. M. & Steiner A. Z. Age-related infertility. Obstet. Gynecol. Clin. North Am. 42, 15–25 (2015). - PubMed
    1. Tsevat D. G., Wiesenfeld H. C., Parks C. & Peipert J. F. Sexually transmitted diseases and infertility. Am. J. Obstet. Gynecol. 216, 1–9 (2017). - PMC - PubMed
    1. Passos L. G. et al. The Correlation between Chlamydia Trachomatis and Female Infertility: A Systematic Review. Rev. Bras. Ginecol. Obstet. 44, 614–620 (2022). - PMC - PubMed

Publication types