[Preprint]. 2024 Mar 25:2024.03.22.586332.
doi: 10.1101/2024.03.22.586332.

Host cell-specific metabolism of linoleic acid controls Toxoplasma gondii growth in cell culture

Affiliations

Host cell-specific metabolism of linoleic acid controls Toxoplasma gondii growth in cell culture

Nicole D Hryckowian et al. bioRxiv. .

Update in

Abstract

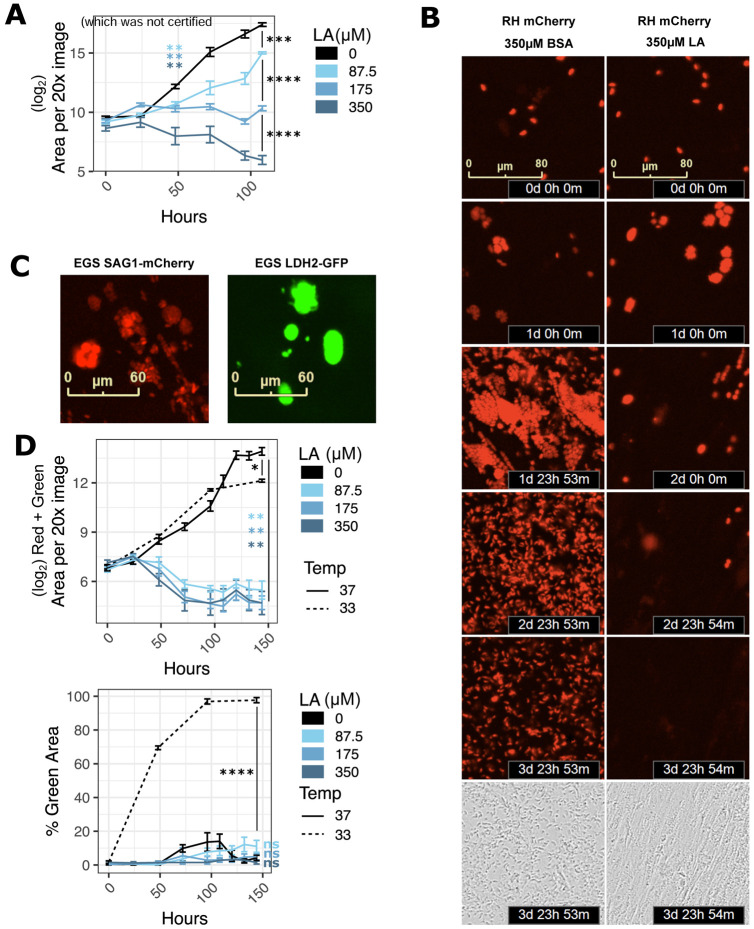
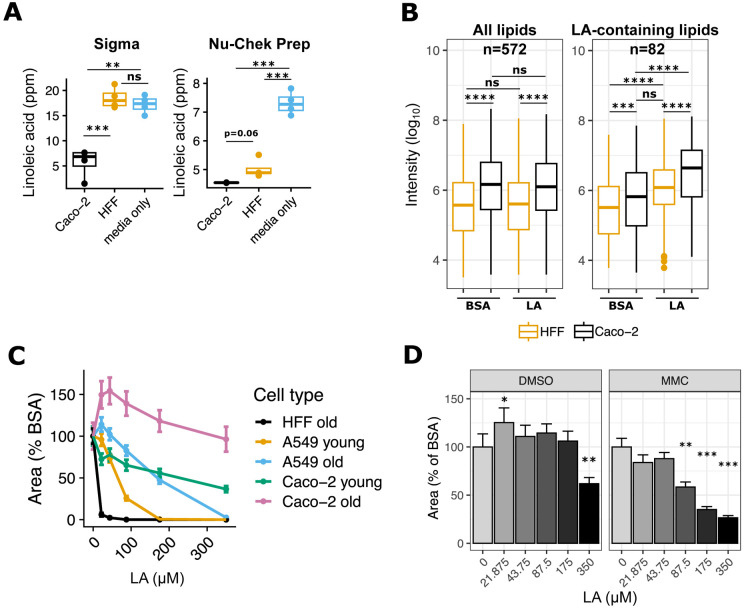
The obligate intracellular parasite Toxoplasma gondii can infect and replicate in any warm-blooded cell tested to date, but much of our knowledge about T. gondii cell biology comes from just one host cell type: human foreskin fibroblasts (HFFs). To expand our knowledge of host-parasite lipid interactions, we studied T. gondii in intestinal epithelial cells, the first site of host-parasite contact following oral infection and the exclusive site of parasite sexual development in feline hosts. We found that highly metabolic Caco-2 cells are permissive to T. gondii growth even when treated with high levels of linoleic acid (LA), a polyunsaturated fatty acid (PUFA) that kills parasites in HFFs. Caco-2 cells appear to sequester LA away from the parasite, preventing membrane disruptions and lipotoxicity that characterize LA-induced parasite death in HFFs. Our work is an important step toward understanding host-parasite interactions in feline intestinal epithelial cells, an understudied but important cell type in the T. gondii life cycle.

Keywords: Toxoplasma gondii; enterocyte; linoleic acid; lipid droplet; lipotoxicity; polyunsaturated fatty acid.


Conflict of interest statement

Declaration of Interests The authors declare that they have no known competing financial interests or personal relationships that could have appeared to influence the work reported in this paper.

Figures

Figure 1.
Figure 1.. Linoleic acid slows parasite growth in HFF cells but not in Caco-2 cells.
(a) T. gondii abundance after 4 days of treatment with 350 μM OA, 350 μM LA, 500 nM DHC, or an equal volume of BSA (final concentration 75 μM) in confluent HFFs or Caco-2 cells. After fixing and staining parasites red with immunofluorescence, 16 technical replicate images for each of 3 biological replicate wells were collected at 20x magnification on the Incucyte imaging system. Red fluorescence area was calculated for each technical replicate and averaged to obtain a value for each biological replicate. The mean of biological replicates is displayed on the y-axis +/− SE. #, p < 0.15; +, p < 0.1; *, p < 0.05 by Student’s t-test. One representative experiment of two is shown. (b) T. gondii replication assessed by parasitophorous vacuole (PV) size after 24 hours of treatments noted in 1a. Number of parasites per vacuole are shown as mean percentages of total PVs +/− SE. At least 100 vacuoles were counted per biological replicate. One representative experiment of two is shown, with 3 biological replicate wells per condition. *, p < 0.05; **, p < 0.01; ***, p < 0.001; ****, p < 0.0001 by Student’s t-test for percent of single-parasite vacuoles.
Figure 2.
Figure 2.. Linoleic acid is parasiticidal in HFFs.
(a) RH-mCherry T. gondii abundance after 4.5 days of treatment with LA at indicated doses in confluent HFFs. Time 0 images were collected immediately following addition of LA at indicated micromolar doses. 16 technical replicate images for each of 4 biological replicate wells were collected at 20x magnification on the Incucyte imaging system every 12-24 hours. Red fluorescence area was calculated for each technical replicate and averaged to obtain values for each biological replicate. The mean of the log2-transformed biological replicate values is displayed on the y-axis +/− SE. **, p < 0.01; ***, p < 0.001; ****, p < 0.0001 by Student’s t-test. (b) Red fluorescent images from 2a are shown at 24-hour increments up to 4 days post-treatment, and phase images from 2a are shown at 4 days post-treatment. (c) Representative images of tachyzoite-stage (left, red) and bradyzoite-stage (right, green) EGS DoubleCat T. gondii, Incucyte imaging system, 20x magnification. (d) EGS DoubleCat T. gondii abundance after 6 days of treatment with LA at indicated doses (μM) in confluent HFFs. 37°C = tachyzoite-promoting conditions with CO2 and neutral pH. 33°C = bradyzoite-promoting conditions without CO2 and pH 8.0 growth media. 16 technical replicate images for each of 4 biological replicate wells were collected at 20x magnification on the Incucyte imaging system every 12-24 hours. Areas of either the sum of red and green (top) or green divided by the sum of red and green (bottom) were computed and averaged by biological replicate. Either log2-transformed means +/− SE (top) or mean proportions +/− SE (bottom) of biological replicates are displayed on the y-axis. *, p < 0.05; **, p < 0.01; ****, p < 0.0001 by Student’s t-test.
Figure 3.
Figure 3.. In HFFs, linoleic acid disrupts parasite membranes and increases lipid droplets.
(a,b) Representative immunofluorescence microscopy images of ME49 Δhpt luciferase (a) and RH-mCherry (b) parasite vacuoles after 24 hours of treatment with 350 μM OA, 350 μM LA, 500 nM DHC, or an equal volume of BSA (final concentration 75 μM) in confluent HFFs or Caco-2 cells. Monolayers were fixed with formaldehyde and stained with a polyclonal anti-T. gondii antibody (ME49 Δhpt luciferase strain, magenta) and a mouse monoclonal anti-SAG1 antibody (ME49 and RH-mCherry, yellow), then counterstained with DAPI (cyan). White arrowheads point to membrane disruptions. (c) Lipid droplet formation in T. gondii vacuoles. ME49 Δhpt luciferase tachyzoites were treated as in 3a except parasites were allowed to invade and replicate for 24 hours prior to treatment. Magenta = T. gondii polyclonal antibody, yellow = lipid droplets, BODIPY 493/503, cyan = DAPI. Scalebars are applicable to all photos, as images all images were collected at the same magnification. (d) Lipid droplets per parasite from 3c were counted and plotted as percent of total parasites +/− SE. At least 100 parasites were counted for each of 3 biological replicate wells. One representative experiment of two is shown. ***, p < 0.001 by Student’s t-test.
Figure 4.
Figure 4.. High linoleic acid metabolism in Caco-2 cells controls parasite load.
(a) LA quantitation in HFF and Caco-2 supernatants, 24 hours post-treatment with 350 μM LA. Values (n=4 per condition, shown as dots) are expressed in parts per million (ppm). Two preparations of LA were tested in separate experiments on the same mass spectrometry instrument: Sigma (left) and Nu-Chek Prep (right). (b) Nu-Chek Prep LA-treated host cell pellets were sent for lipidomics analysis (n=4 per condition). Raw metabolite intensities were log10-transformed. Individual dots represent outliers. ***, p < 0.001; ****, p < 0.0001 by Student’s t-test. (c) Old and young cultures of Caco-2 and A549 cells and HFFs (see Methods) were infected with Pru Cre mCherry tachyzoites and grown in the presence of indicated doses of LA for 8 days. 16 technical replicate images for 4 biological replicate wells per condition were collected at 8 days post-treatment at 20x magnification on the Incucyte imaging system. Red fluorescence area was calculated for each technical replicate and averaged to obtain a value for each biological replicate. The y-axis shows the mean +/− SE of biological replicates, expressed as percent of the mean of BSA-treated control wells from the same host cell plate. (d) Pru Cre mCherry tachyzoites were grown in the presence of indicated doses of LA in Caco-2 cells that were treated with either DMSO or mitomycin C (MMC) one week prior to infection. 16 technical replicate images for 4 biological replicate wells per condition were collected at 9 days post-treatment at 20x magnification on the Incucyte imaging system. Red fluorescence area was calculated for each technical replicate and averaged to obtain a value for each biological replicate. The y-axis shows the mean +/− SE of biological replicates, expressed as percent of the mean of BSA-treated control wells. One representative experiment of two. *, p < 0.05; **, p < 0.01; ***, p < 0.001 by Student’s t-test.

References

    1. Desmonts G., and Couvreur J.. “Congenital Toxoplasmosis. A Prospective Study of 378 Pregnancies.” The New England Journal of Medicine, vol. 290, no. 20, May 1974, pp. 1110–16. 10.1056/NEJM197405162902003. - DOI - PubMed
    1. Blader Ira J., et al. “Lytic Cycle of Toxoplasma Gondii : 15 Years Later.” Annual Review of Microbiology, vol. 69, no. 1, Oct. 2015, pp. 463–85. 10.1146/annurev-micro-091014-104100. - DOI - PMC - PubMed
    1. Dubey J. P., and Frenkel J. K.. “Cyst-Induced Toxoplasmosis in Cats.” The Journal of Protozoology, vol. 19, no. 1, Feb. 1972, pp. 155–77. PubMed, 10.1111/j.1550-7408.1972.tb03431.x. - DOI - PubMed
    1. Ferguson D. J. P. "Use of Molecular and Ultrastructural Markers to Evaluate Stage Conversion of Toxoplasma Gondii in Both the Intermediate and Definitive Host." International Journal for Parasitology, vol. 34, no. 3, Mar. 2004, pp. 347–60. 10.1016/j.ijpara.2003.11.024. - DOI - PubMed
    1. Tomasina Ramiro, and Francia María E.. “The Structural and Molecular Underpinnings of Gametogenesis in Toxoplasma Gondii.” Frontiers in Cellular and Infection Microbiology, vol. 10, 2020. Frontiers, https://www.frontiersin.org/articles/10.3389/fcimb.2020.608291. - DOI - PMC - PubMed

Publication types