[Preprint]. 2024 Mar 18:rs.3.rs-4093618.
doi: 10.21203/rs.3.rs-4093618/v1.

Germinal Center Dark Zone harbors ATR-dependent determinants of T-cell exclusion that are also identified in aggressive lymphoma

Affiliations

Germinal Center Dark Zone harbors ATR-dependent determinants of T-cell exclusion that are also identified in aggressive lymphoma

Valeria Cancila et al. Res Sq. .

Update in

  • Aggressive B-cell lymphomas retain ATR-dependent determinants of T-cell exclusion from the Germinal Center Dark Zone.
    Cancila V, Bertolazzi G, Chan AS, Medico G, Bastianello G, Morello G, Paysan D, Lai C, Hong L, Shenoy G, Jaynes PW, Schiavoni G, Mattei F, Piconese S, Revuelta MV, Noto F, Businaro L, De Ninno A, Cammarata I, Pagni F, Venkatachalapathy S, Sangaletti S, Di Napoli A, Cicio G, Vacca D, Lonardi S, Lorenzi L, Ferreri AJ, Belmonte B, Liu M, Lakshmanan M, Ong MS, Zhang B, See T, Lam KP, Varano G, Colombo MP, Bicciato S, Inghirami G, Cerchietti L, Ponzoni M, Zappasodi R, Metzger E, Beechem J, Facchetti F, Foiani M, Casola S, Jeyasekharan AD, Tripodo C. Cancila V, et al. J Clin Invest. 2025 Jul 17:e187371. doi: 10.1172/JCI187371. Online ahead of print. J Clin Invest. 2025. PMID: 40674145

Abstract

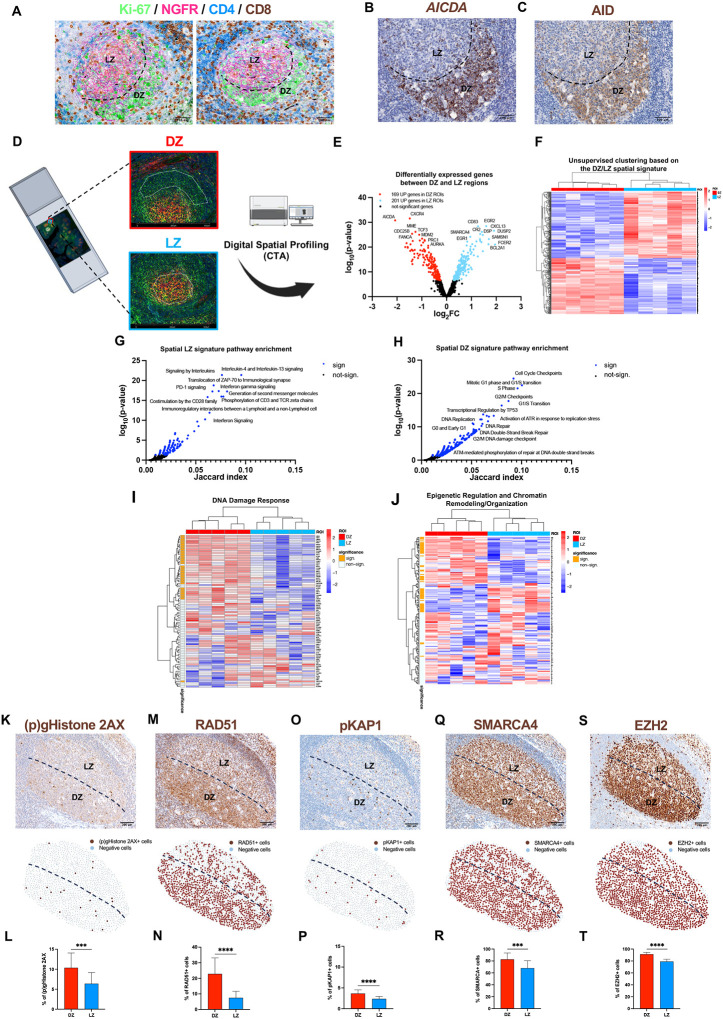
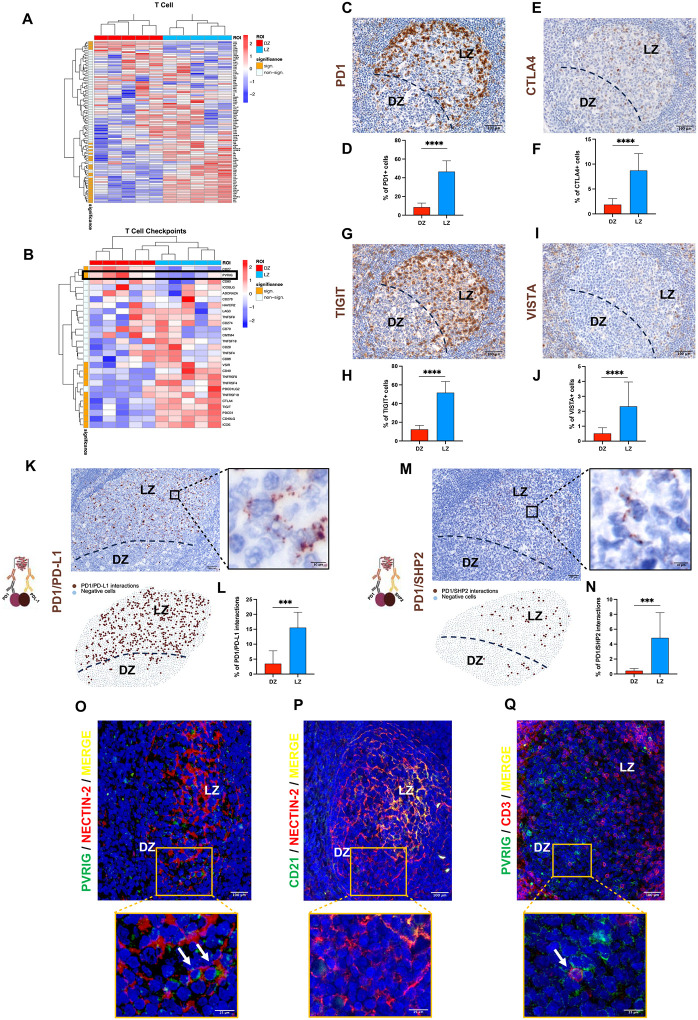
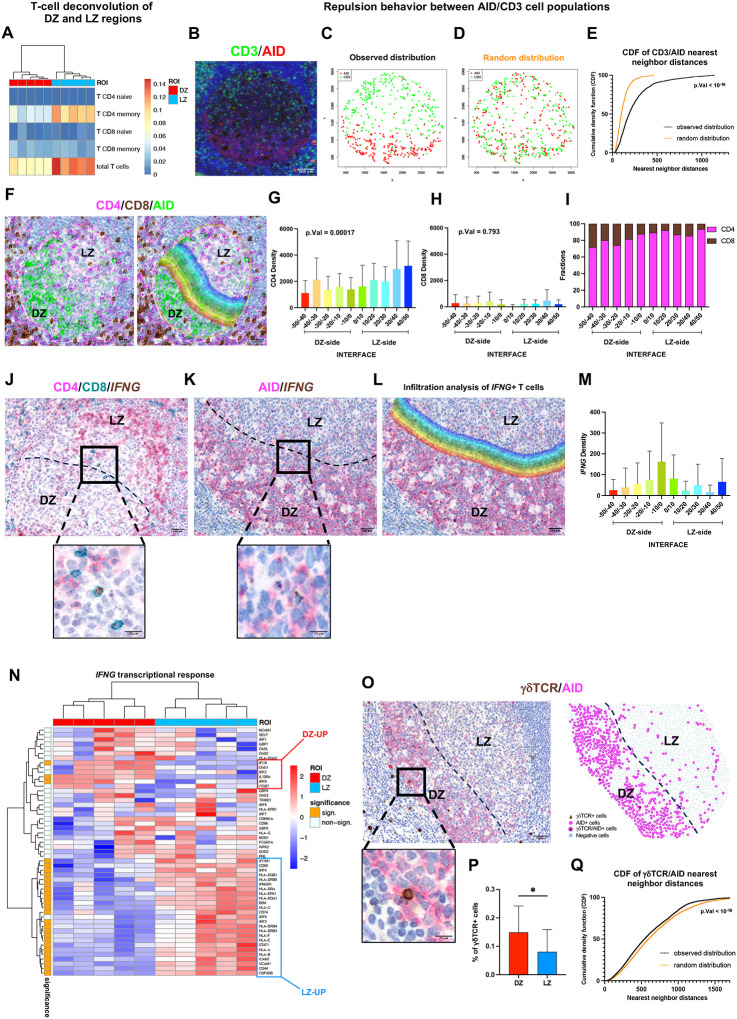
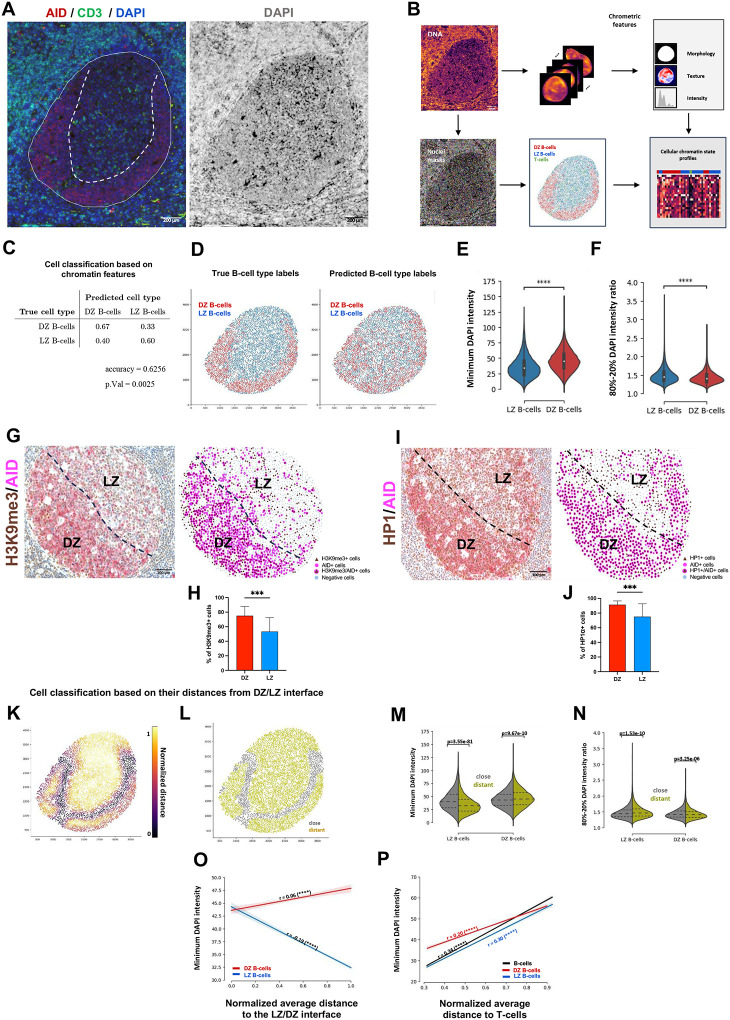
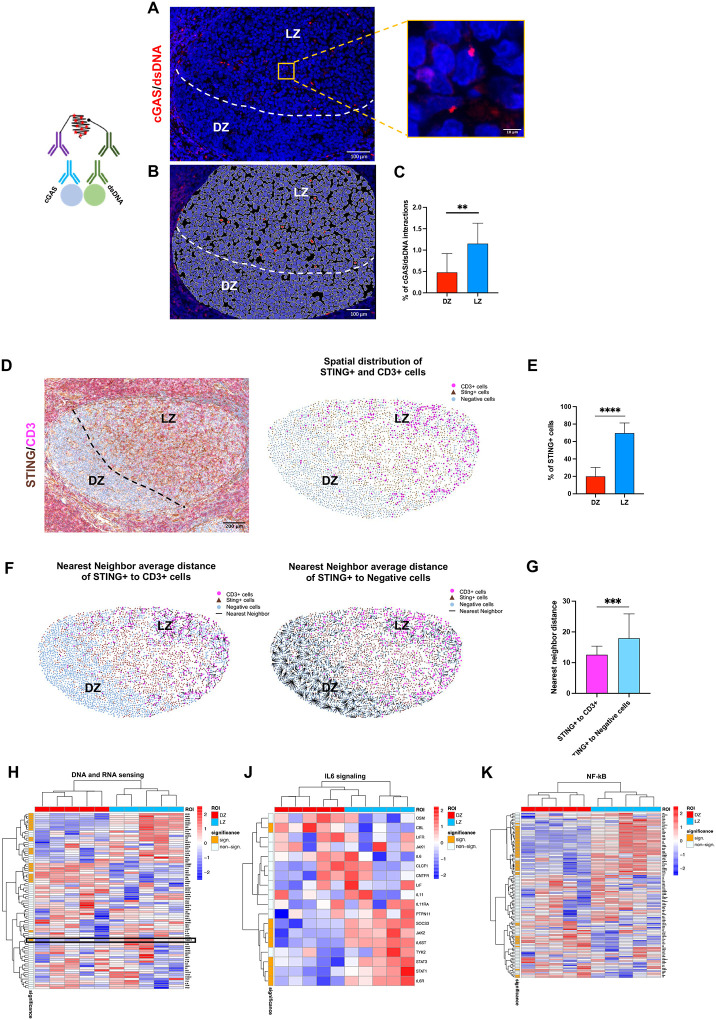
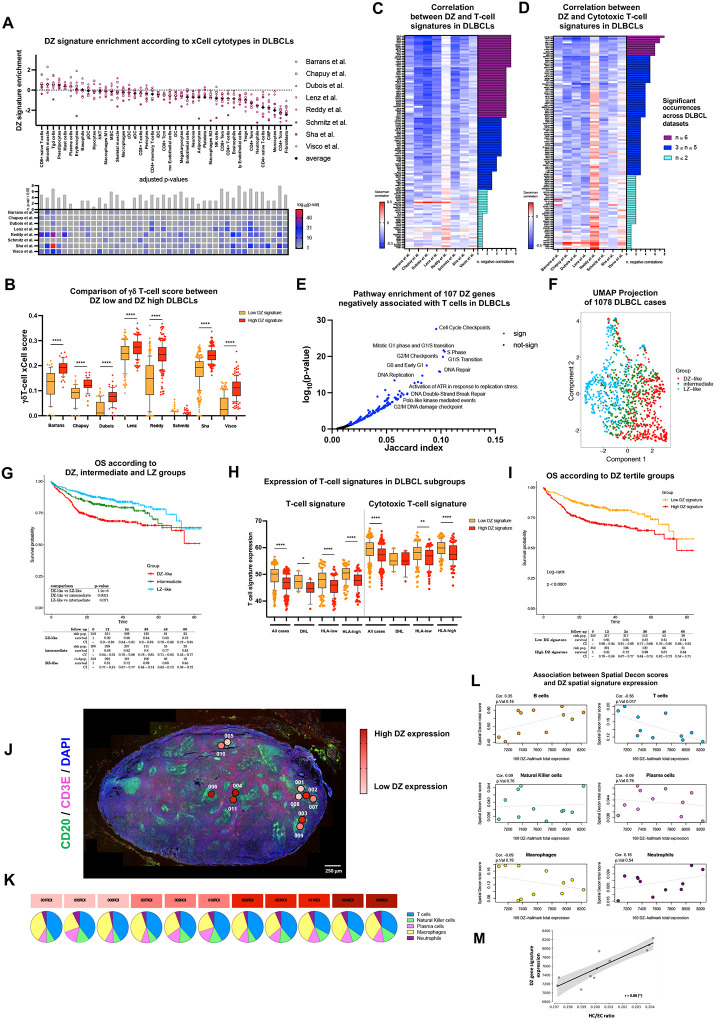
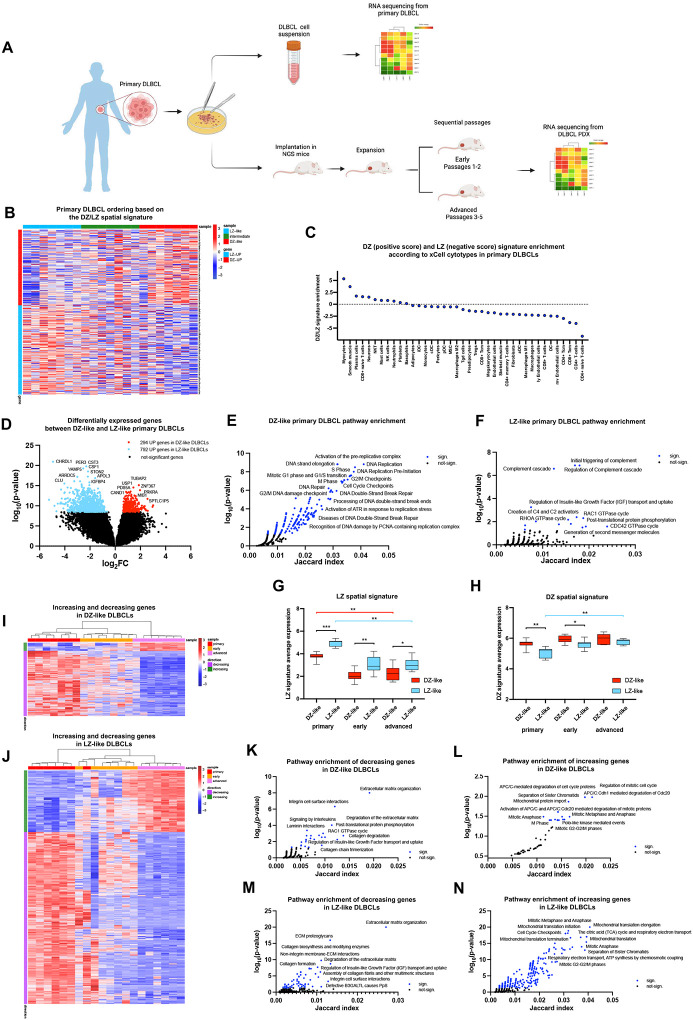
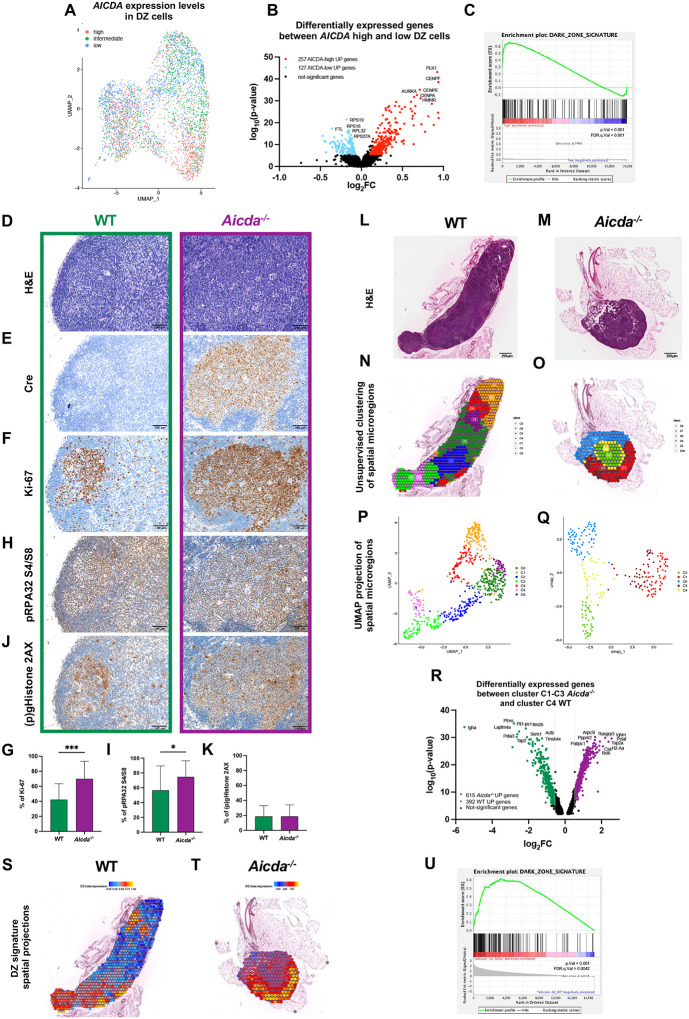
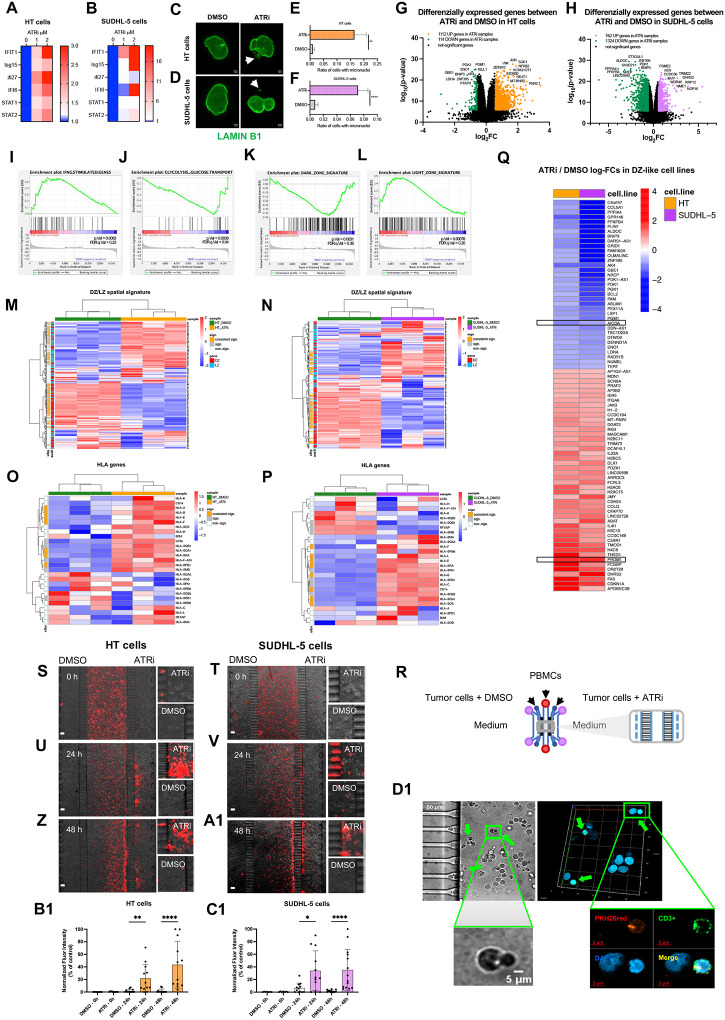
The germinal center (GC) dark zone (DZ) and light zone (LZ) regions spatially separate expansion and diversification from selection of antigen-specific B-cells to ensure antibody affinity maturation and B cell memory. The DZ and LZ differ significantly in their immune composition despite the lack of a physical barrier, yet the determinants of this polarization are poorly understood. This study provides novel insights into signals controlling asymmetric T-cell distribution between DZ and LZ regions. We identify spatially-resolved DNA damage response and chromatin compaction molecular features that underlie DZ T-cell exclusion. The DZ spatial transcriptional signature linked to T-cell immune evasion clustered aggressive Diffuse Large B-cell Lymphomas (DLBCL) for differential T cell infiltration. We reveal the dependence of the DZ transcriptional core signature on the ATR kinase and dissect its role in restraining inflammatory responses contributing to establishing an immune-repulsive imprint in DLBCL. These insights may guide ATR-focused treatment strategies bolstering immunotherapy in tumors marked by DZ transcriptional and chromatin-associated features.


Conflict of interest statement

CONFLICT OF INTERESTS ADJ has received consultancy fees from DKSH/Beigene, Roche, Gilead, Turbine Ltd, AstraZeneca, Antengene, Janssen, MSD and IQVIA; and research funding from Janssen and AstraZeneca.

Figures

Figure 1
Figure 1. The GC DZ exhibits a spatial transcriptome primarily associated with DNA replication and damage response processes.
A, Representative microphotographs of combined IHC/IF staining for Ki-67 (green signal), NGFR (pink signal), CD4 (blue signal), and CD8 (brown signal), showing dense expression of Ki-67 in GC DZ and NGFR expression in GC LZ regions. Original magnification, x200. Scale bar, 100 μm. B-C, Comparative images of mRNA in situ hybridization for AICDA and IHC for AID to evaluate the correspondence between mRNA and protein expression. Original magnification, x200. Scale bar, 100 μm. D, Digital spatial profiling experiment in DZ (n = 5) and LZ (n = 5) ROIs to identify an immune/stromal GC DZ/LZ signature. E, Volcano plot of differentially expressed genes (DEGs) from the comparison between DZ and LZ ROIs (adjusted p-values < 0.05). F, Heatmap of DEGs between DZ and LZ ROIs. The unsupervised hierarchical clustering based on the DZ/LZ spatial signature clearly discriminates DZ and LZ ROIs. G-H, Pathway enrichment of 201 LZ spatial signature genes and 169 DZ spatial signature genes (Reactome Pathway library). Significant pathways are marked with a blue colour. I-J, Expression of “DNA Damage Response” and “Epigenetic Regulation and Chromatin Remodeling/Organization” genes in DZ and LZ ROIs. The left bar indicates the significant DEGs between DZ and LZ ROIs (orange). K-T, Representative microphotographs, spatial plots and quantitative analyses of IHC for DNA damage/repair markers: (p)gHistone (K and L), RAD51 (M and N), pKAP1 (O and P), SMARCA4 (Q and R) and EZH2 (S and T) to assess the different enrichment between DZ and LZ (n GCs = 20). Original magnification, x100. Scale bar, 200 μm. Statistical analysis: two-tailed unpaired Mann-Whitney test (L, N, P, R, T). Mean ± standard error shown; *, P < 0.05; **, P < 0.01; ***, P < 0.001; ****, P < 0.0001.
Figure 2
Figure 2. T-cell transcript depletion and limited immune checkpoint expression characterize the GC DZ microenvironment.
A-B, Expression of “T-cell” and “T-cell checkpoints” genes in DZ and LZ ROIs. The left bar indicates the significant DEGs between DZ and LZ ROIs (orange). C-J, Representative microphotographs and quantitative analysis of IHC for PD1 (C and D), CTLA4 (E and F), TIGIT (G and H) and VISTA (I and J) showing a marked increase towards the LZ (n GCs = 20). Original magnification, x200. Scale bar, 100 μm. K-N, Representative microphotographs, spatial plots and quantitative analyses showing PD1/PD-L1 (K and L) or PD1/SHP2 (M and N) interactions (brown signal) detected by in situ proximity ligation assay (n GCs = 10). Original magnifications, x100 and x630 (insets). Scale bars, 200 μm and 10 μm. O, Double-marker IF of PVRIG (green signal) and NECTIN-2 (red signal) showing the association in the DZ GC. P, Double-marker immunofluorescence of CD21 (green signal) and NECTIN-2+ (red signal) highlighting NECTIN-2 expression beyond the LZ pattern. Q, Double-marker IF of PVRIG (green signal) and CD3 (red signal) showing scattered double positive T cells infiltrating the DZ. Original magnifications (O, P, Q), x200 and x400 (insets). Scale bars, 100 μm and 25 μm. Statistical analysis: two-tailed unpaired Mann-Whitney test (D, F, H, J, L, N). Mean ± standard error shown; *, P < 0.05; **, P < 0.01; ***, P < 0.001; ****, P < 0.0001.
Figure 3
Figure 3. T-cell repulsion and IFNG+ cell marginalization at the LZ/DZ interface in the GC microenvironment
A, SpatialDecon T-cell fractions over DZ and LZ ROIs. B, Representative microphotographs of double-marker IF for CD3 (green signal) and AID (red signal) within the GC. Original magnification, x200. Scale bar, 100 μm. C-D Example of observed (C) and randomized (D) spatial distribution. E, Cumulative density functions (CDFs) of CD3-AID nearest neighbor distances calculated in the observed samples (black curve) and in the randomized samples (orange curve). The distances between CD3 and AID cells are significantly higher in the observed samples compared with the randomized samples (Wilcoxon p-value < 10−16), indicating a segregation among the two cell populations. F, Representative microphotographs of triple immunohistochemical staining for CD4 (pink signal) CD8 (brown signal) and AID (green signal) (left) and DZ/LZ infiltration analysis representation (right) to quantify the density of CD4+ and CD8+ T cells infiltrating the interface within the GC. Original magnification, x200. Scale bar, 100 μm. G-H, Average density of CD4+ (G) and CD8+ (H) cells along with the LZ/DZ transition (n GCs = 10). I, Average fraction of CD4 and CD8 positive cells along the interface (n GCs = 10). J, Representative microphotographs of combined mRNA in situ hybridization of IFNG (brown signal) and double-marker immunohistochemistry of CD4 (pink signal) and CD8 (green signal). Original magnification, x200 and x400 (insets). Scale bars, 100 μm and 25 μm. K-M, In situ detection for IFNG mRNA and IHC for AID representative images (K), DZ/LZ infiltration analysis representation (L) and quantitative analyses of the average density of IFNG+ cells infiltrating the inside and outside of the interface (M). (n GCs = 10). Original magnification, x200 and x400 (insets). Scale bars, 100 μm and 25 μm. N, Expression of IFNG transcriptional response genes in DZ and LZ ROIs. The left bar indicates the significant DEGs between DZ and LZ ROIs (orange). O-P, Representative microphotographs, spatial plots and quantitative analyses of IHC for δTCR cells show different spatial enrichment and expression in DZ and LZ (n GCs = 20). Original magnification, x100 and x400 (insets). Scale bars, 200 μm and 25 μm. Q, CDFs of AID-δTCR nearest neighbor distances calculated in the observed samples (black curve) and the randomized samples (orange curve). The population distances are significantly lower in the observed samples compared with the randomized samples (Wilcoxon p-value < 10−16). It indicates an aggregation behavior among the two cell populations. Statistical analysis: two-tailed unpaired Mann-Whitney test (P). Mean ± standard error shown; *, P < 0.05; **, P < 0.01; ***, P < 0.001; ****, P < 0.0001.
Figure 4
Figure 4. Chromatin compaction gradients differentiate the DZ and LZ microenvironments.
A, Representative microphotographs of a GC showing the AID (red signal) and CD3 (green signal) staining (left) and the DAPI (DNA), marked in white (right). Original magnification x100. Scale bar, 200 μm. B, Overview of the computational pipeline to characterize the cell-type identities and chromatin states of cells from input fluorescent images. C, Average of the row-normalized confusion matrices of the RFC trained to distinguish between LZ and DZ B-cells. The average is obtained by evaluating the RFC in a 10-fold stratified cross-validation setup for a balanced random subsample of DZ and LZ B-cells (n=9,197). The prediction accuracy (Acc = 0.635) is significantly higher than the No Information Rate (NIR = 0.5, p-value 0.0025, one-sided Wilcoxon signed-rank test). D, Visualization of the prediction performance of the RFC for a GC sample. The true cell-type labels are shown on the left. Cell type labels predicted by an RFC when holding out the respective nuclei during training of the RFC are shown on the right. E-F, Violin plots showing the distribution of the “minimum DNA intensity” and the “ratio of the 80-to-20 percentile of the DNA intensity” among the LZ/DZ B-cell populations (Welch’s t-test, p-value < 1e-124). G-J, Representative microphotographs, spatial plots and quantitative analyses of double-marker IHC for AID (DZ marker) and H3K9me3 (G and H) or HP1 (I and J) to assess the different enrichment between DZ and LZ (n GCs = 20). Original magnification, x100. Scale bar, 200 μm. Statistical analysis: two-tailed unpaired Mann-Whitney test (H and J). Mean ± standard error shown; *, P < 0.05; **, P < 0.01; ***, P < 0.001; ****, P < 0.0001. K, Identified distance to the DZ/LZ interface of the individual cells by their corresponding color coding. L, Binary classification of cells close (grey) or distant (olive) to the interface by thresholding the distance measure at 0.4. M-N, Violin plots showing the distribution of the “minimal DNA intensity” and the “ratio of the 80 and 20 percentiles of the DNA intensity distribution” for LZ and DZ B-cells in close proximity (grey) and those distant (olive) to the LZ/DZ interface. The means are found to differ significantly (Welch t-test). The inner dashed lines correspond to the 25, 50 and 75 percentiles. O, Visualization of the significant correlation of the minimum DNA intensity of LZ/DZ B-cells with respect to their range-normalized distance to the LZ/DZ interface (Pearson r=0.0671 and r=−0.1902, p-values < 1e-6, permutation test). Linear regression lines with corresponding 95% bootstrapping confidence intervals using b=1,000 bootstrap samples are shown as shaded regions. P, Visualization of the significant correlation of the minimum DNA intensity of all B-cells (black), DZ (red) and LZ B-cells and their average range-normalized distance to T-cells in the germinal centers (Pearson r=0.3410, r=0.2030 and r=0.2998, p-values < 1e-6, permutation test). Linear regression lines with corresponding 95% confidence intervals using b=1,000 bootstrap samples are shown as shaded regions.
Figure 5
Figure 5. The T-cell depleted DZ microenvironment exhibits inactivity of the cGAS-STING pathway.
A-C, Representative microphotographs, spatial plots and quantitative analyses showing cGAS/dsDNA interactions (red signal) detected by fluorescent in situ proximity ligation assay (n GCs = 10) and showing scattered elements in the LZ regions. Original magnification, x200 and x630 (insets). Scale bars, 100 μm and 10 μm. D-E, Representative microphotographs, spatial plots and quantitative analyses of STING (brown signal) and CD3 (pink signal) double-marker immunostaining highlighting a different spatial distribution of STING and CD3 in DZ and LZ (n GCs = 20). Original magnification, x100. Scale bar, 200 μm. F-G, Nearest neighbor distance of STING to CD3 and STING to Negative cells showing the proximity of STING to CD3 cells (n GCs = 20). Statistical analysis: two-tailed unpaired Mann-Whitney test (C, E, G). Mean ± standard error shown; *, P < 0.05; **, P < 0.01; ***, P < 0.001; ****, P < 0.0001. H-K, Expression of “DNA and RNA sensing” (H), “IL6 signaling” (J), and “NF-kB” (K) genes in DZ and LZ ROIs. The left bar indicates the significant DEGs between DZ and LZ ROIs (orange).
Figure 6
Figure 6. The GC DZ spatial signature in aggressive B cell lymphomas is associated with reduced T cell infiltration.
A, DZ enrichment scores indicate the association between DZ gene expression and xCell cytotype scores calculated in 8 DLBCL datasets. Positive DZ enrichment values indicate a positive association between the DZ spatial signature and the xCell cytotype scores, while negative values indicate a negative association. The bottom panel highlights the significance of the enrichment scores (Wilcoxon adjusted p-values). B, Comparison of γδT-cells xCell score between low DZ expression and high DZ expression DLBCL cases. DZ high and DZ low groups have been obtained classifying the DLBCL cases based on the tertile separation of the DZ total expression. Wilcoxon p-values have been calculated to compare the xCell scores among the DZ high and the DZ low groups (*, P < 0.05; **, P < 0.01; ***, P < 0.001; ****, P < 0.0001). C-D, Observed correlations between the DZ spatial signature genes and the average expression of the T-cell hallmark/Cytotoxic T-cell gene signature in 8 DLBCL datasets. The right bars indicate how many times a gene was found to be significantly correlated over the DLBCL datasets. Violet bars indicate genes significantly correlated with the T cell signature in at least six DLBCL datasets. Blue and light-blue bars indicate genes significantly correlated less than six times. E, Pathway enrichment (Reactome Pathway library) of 107 DZ genes negatively correlated with the T-cell signatures in at least 3 DLBCL datasets. Significant pathways are marked with a blue color. F, UMAP projection of 1078 harmonized DLBCL cases classified based on the DZ/LZ spatial signature. DZ-like cases (red), LZ-like cases (light blue), and intermediate cases (green) are highlighted in the UMAP. G, Overall survival over DZ-like, LZ-like, and intermediate patients from the harmonized dataset (1078 cases). H, Expression of T-cell signatures over DLBCL patient subgroups. The DLBCL subgroups refer to double-hit lymphoma cases (DHL), high HLA expression (HLA-high), and low HLA expression (HLA-low) cases. Wilcoxon p-values have been calculated to compare the T-cell gene expression between DZ high expression and DZ low expression patients. I, Overall survival over high DZ expression and low DZ expression groups from the 1078 harmonized DLBCL cases. J, Digital spatial profiling experiment in 11 ROIs selected within CD20+ (green signal) and CD3E (red signal) infiltrates of a lymph node involved by diffuse large B-cell lymphoma (DLBC). Original magnification, x50. Scale bar, 250 μm. K-L, Association between the DZ spatial signature expression and SpatialDecon cytotype scores over 11 IG ROIs, reporting the Kendal correlation coefficient and p-values. M, Scatterplot shows the measured DZ gene signature expression of the ROIs (n=11) plotted against the median heterochromatin-to-euchromatin (HC/EC) ratio of the nuclei in those regions. The black line shows the fit of a linear regression model which visualises the significant correlation of the two quantities (Pearson r=0.8843, p-value = 0.0180, permutation test). A 95% confidence interval computed using 1,000 bootstrap samples for the regression line is shown as the shaded region in grey.
Figure 7
Figure 7. The absence of a native microenvironment attenuates the DZ-like/LZ-like DLBCL divergence in PDXs
A, Graphical scheme of RNA-seq transcriptomes analyzed from 21 primary DLBCL tumors and the corresponding patient-derived xenografts (PDXs). B, Heatmap of primary DLBCL samples categorized in DZ-like, LZ-like, and intermediate based on the DZ/LZ spatial gene expression signature. C, Enrichment scores indicate the association between DZ/LZ gene expression and xCell cytotype scores calculated in 8 DLBCL datasets. Positive values indicate cytotypes that enrich the DZ-like primary DLBCLs, while negative values indicate cytotypes that enrich the LZ-like primary DLBCLs. D, Volcano plot of differentially expressed genes (DEGs) from the comparison between DZ-like and LZ-like primary DLBCL samples (adjusted p-values < 0.05, abs-logFC>0.58). E-F, Pathway enrichment of 294 genes UP in DZ-like DLBCLs and 792 genes UP in LZ-like DLBCLs (Reactome Pathway library). Significant pathways are marked with a blue colour. G-H, Average expression of DZ/LZ spatial signature among primary, early, and advanced DLBCLs. Wilcoxon test was used for pairwise comparisons between DZ-like and LZ-like samples. The Kruskal-Wallis test was used to compare three groups (red and light-blue lines indicate KW test significance. *, P < 0.05; **, P < 0.01; ***, P < 0.001; ****, P < 0.0001). I-J, Heatmap of increasing and decreasing genes in primary, early, and advanced DLBCLs. Significant genes were selected based on the non-parametric one-way ANOVA and log-FCs (Kruskal-Wallis adj. p-value < 0.05, pairwise log-FCs > 0.58). K-N, Pathway enrichment of significant decreasing and increasing genes among primary, early, and intermediate DLBCLs in DZ-like and LZ-like subgroups.
Figure 8
Figure 8. The spatial signature of DZ cells is independent of AICDA-related mutational processes.
A, UMAP projection of 4.082 cells from the Holmes et al. dataset. The cells are classified as low, intermediate, and high AICDA gene expression. While low indicates the absence of expression, and high indicates an expression greater than the 2nd tertile. B, DEGs from the comparison between AICDA-high and AICDA-low cells from the Holms et al. single-cell dataset (Wilcoxon Rank Sum test adj. p-value < 0.05, abs-logFC > 0.25). C, GSEA enrichment analysis on AICDA-high and AICDA-low cells. The DZ spatial signature strongly enriches AICDA-high cells in the Holmes et al. dataset (p-value < 0.001). D-K, Comparative microphotographs of H&E (D) and IHC for Cre (E), Ki-67 (F and G), pRPA32 S4/S8 (H and I) and (p)gHistone2AX (J and K) in mesenteric lymph nodes of WT and Aicda−/− mice. Ki-67 (G), pRPA32 S4/S8 (I) and (p)gHistone2AX (K) show different expression between WT and Aicda−/− mice (n GCs = 20). Original magnification, x200. Scale bar, 100 μm. L-M, Representative microphotographs of H&E-stained sections from WT and Aicda−/− mesenteric lymph node involved in the Visium spatial transcriptome experiment profiling. Original magnification, x50. Scale bar, 250 μm. N-O, Unsupervised clustering of spatial microregions. P-Q, UMAP projection of the spatial microregions. Colors reflect the unsupervised cluster classification. R, DEGs from the comparison between the WT cluster 4 and Aicda−/− clusters 1 and 3 (Wilcoxon Rank Sum test adj. p-values < 0.05, abs-logFC > 0.025). S-T, Spatial projection of the DZ spatial signature total expression in WT and Aicda−/− samples. U, GSEA enrichment analysis on follicular-GC microregions. The spatial DZ spatial signature significantly enriches follicular-GC regions of the Aicda−/− sample (p-value < 0.001).
Figure 9
Figure 9. ATRi unleashes immune permeation of a DZ-like DLBCL milieu in a competitive on chip assay
A-B, qPCR analysis showing Interferon-Stimulated Genes (IFNG) induction in HT (A) or SUDHL-5 (B) cells following a 48h treatment with AZD6738 at the indicated concentrations. C-D, Representative immunofluorescence images showing micronuclei formation in HT (B) and SUDHL-5 (C) cells treated with 1μM ATR inhibitor for 48h (green: laminB1 staining decorating the nuclear envelope). E-F, Micronuclei quantifications (relative to IF analysis C-D) showing an increased ratio of micro-nucleated cells in the samples treated with 1μM ATRi for 48h (E: HT cells, F: SUDHL-5 cells). G-H, Differentially expressed genes from the comparison between ATRi and DMSO samples in HT/SUDHL-5 cell line (adjusted p-value < 0.05, |log-FC|>0.58). I-L, GSEA enrichment analysis on ATRi and DMSO samples. The IFNG Stimulated pathway (I) and the LZ spatial signature (L) significantly enrich the ATRi samples. The Glycolysis Glucose Transport pathway (J) and the DZ spatial signature (K) significantly enrich the DMSO samples M-P, Expression of DZ/LZ spatial signature (M and N) and HLA genes (O and P) in HT and SUDHL-5 cell lines. The left bar indicates the significant DEGs between ATRi and DMSO. The orange colour indicates the significant DEGs whose FCs have a consistent value among cell lines. Q, log-FC values from the comparison between ATRi vs DMSO in DZ-like cell lines (i.e., HT and SUDHL-5) considering only the significant genes shared between both cell lines. Positive log-FC values indicate genes up-modulated by ATRi (red cells in the heatmap), while negative log-FC values indicate genes down-modulated by ATRi (blue cells in the heatmap). R, Schematic representation of the competitive device. PKH26-labeled PBMCs were loaded in the central fluidic chamber. DLBCL (HT or SUDHL-5) cells were embedded in Matrigel with ATRi or DMSO and loaded in lateral chambers. S-T, Distribution of red fluorescent PBMCs after cell loading. U-A1 Preferential migration of PBMCs towards lateral DLBCL-gel chambers after 24h (U and V) and 48h (Z and A1) from cell loading. B1-C1, Quantitative analysis of PBMC infiltration expressed by integrated density of red fluorescence in the two HT (B1) or SUDHL-5 (C1) Matrigel chambers. Mean of representative fields ± S.D. from 3 replicates of different donor PBMCs (n=3) is shown. D1, Confocal analysis of PKH26+ CD3+ T cells in the ATRi-treated DLBCL-gel chamber (48h time point) showing close interaction with DLBCL cells. Lower left panel visible light image depicting a tumor cell interacting with an infiltrated T cell inside the Matrigel chamber. Green box shows a magnification of a T lymphocyte interacting with a tumor cell. Right panel, Z stack acquisition from the panel J with a magnification (green box) displaying the strict spatial interaction between CD3+ PKH26+ T cells and DAPI+ DLBLCL (HT) cells. The green box delineates a representative Z stack plan evidencing a T lymphocyte interacting with a DLBCL cancer cell. Images were acquired at the 48h time point. Statistical analysis: two-tailed unpaired Mann-Whitney test (E, F, B1, C1). Mean ± standard error shown; *, P < 0.05; **, P < 0.01; ***, P < 0.001; ****, P < 0.0001.

Similar articles

References

    1. Lazear HM, Schoggins JW, Diamond MS. Shared and Distinct Functions of Type I and Type III Interferons. Immunity. 2019. Apr 16;50(4):907–923. doi: 10.1016/j.immuni.2019.03.025. - DOI - PMC - PubMed
    1. Robert C. A decade of immune-checkpoint inhibitors in cancer therapy. Nat Commun. 2020. Jul 30;11(1):3801. doi: 10.1038/s41467-020-17670-y. - DOI - PMC - PubMed
    1. Pardoll DM. The blockade of immune checkpoints in cancer immunotherapy. Nat Rev Cancer. 2012. Mar 22;12(4):252–64. doi: 10.1038/nrc3239. - DOI - PMC - PubMed
    1. Togashi Y, Shitara K, Nishikawa H. Regulatory T cells in cancer immunosuppression - implications for anticancer therapy. Nat Rev Clin Oncol. 2019. Jun;16(6):356–371. doi: 10.1038/s41571-019-0175-7. - DOI - PubMed
    1. Veglia F, Sanseviero E, Gabrilovich DI. Myeloid-derived suppressor cells in the era of increasing myeloid cell diversity. Nat Rev Immunol. 2021. Aug;21(8):485–498. doi: 10.1038/s41577-020-00490-y. Epub 2021 Feb 1. - DOI - PMC - PubMed

Publication types