

This is a preprint.
Electrical Impedance Spectroscopy Quantifies Skin Barrier Function in Organotypic In Vitro Epidermis Models
- PMID: 38562885
- PMCID: PMC10983962
- DOI: 10.1101/2024.03.18.585587
Electrical Impedance Spectroscopy Quantifies Skin Barrier Function in Organotypic In Vitro Epidermis Models
Update in
-
Electrical Impedance Spectroscopy Quantifies Skin Barrier Function in Organotypic In Vitro Epidermis Models.J Invest Dermatol. 2024 Nov;144(11):2488-2500.e4. doi: 10.1016/j.jid.2024.03.038. Epub 2024 Apr 19. J Invest Dermatol. 2024. PMID: 38642800
Abstract
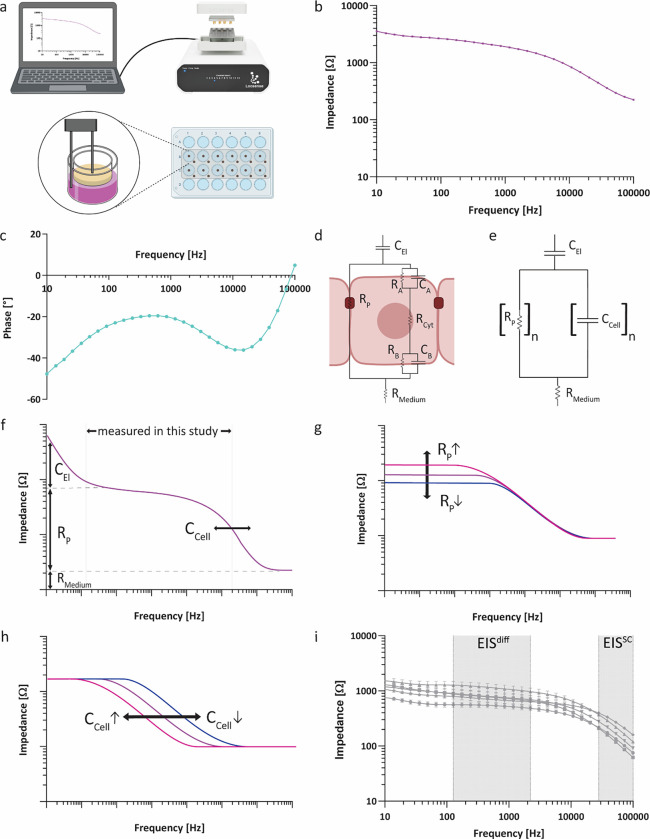
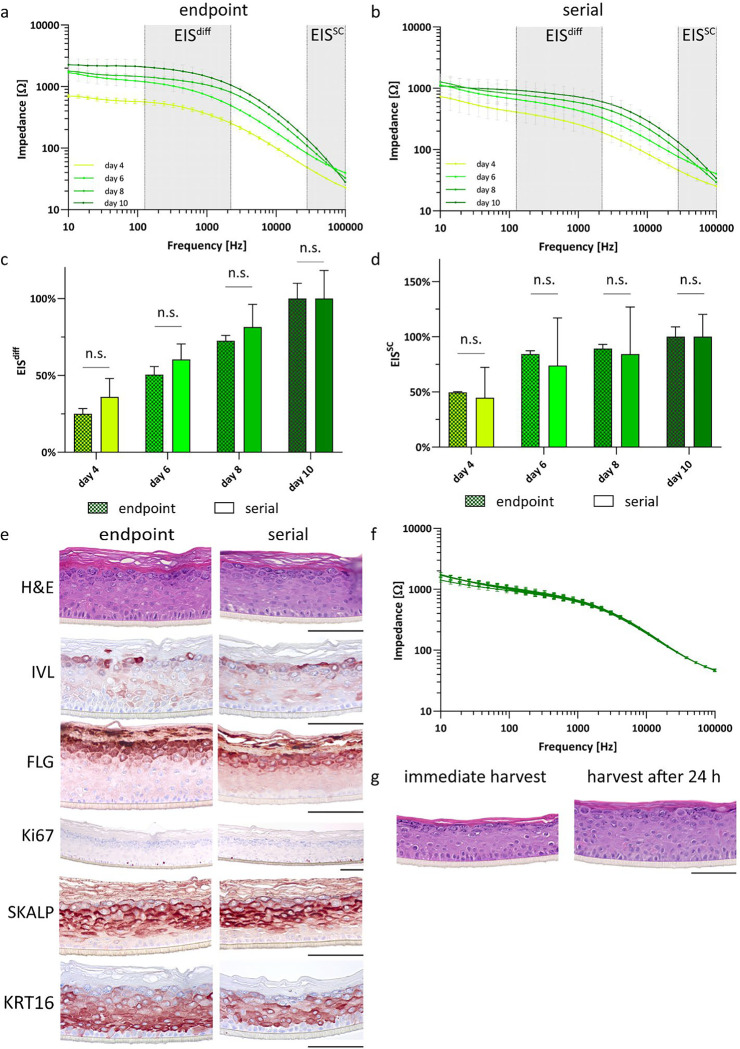
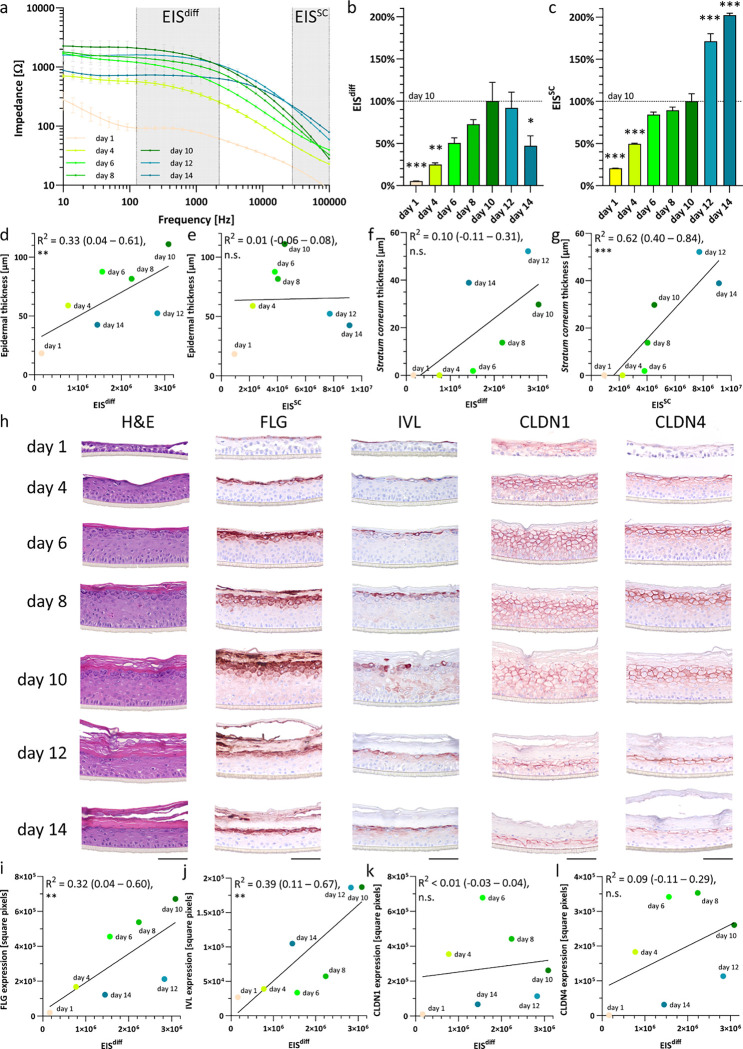
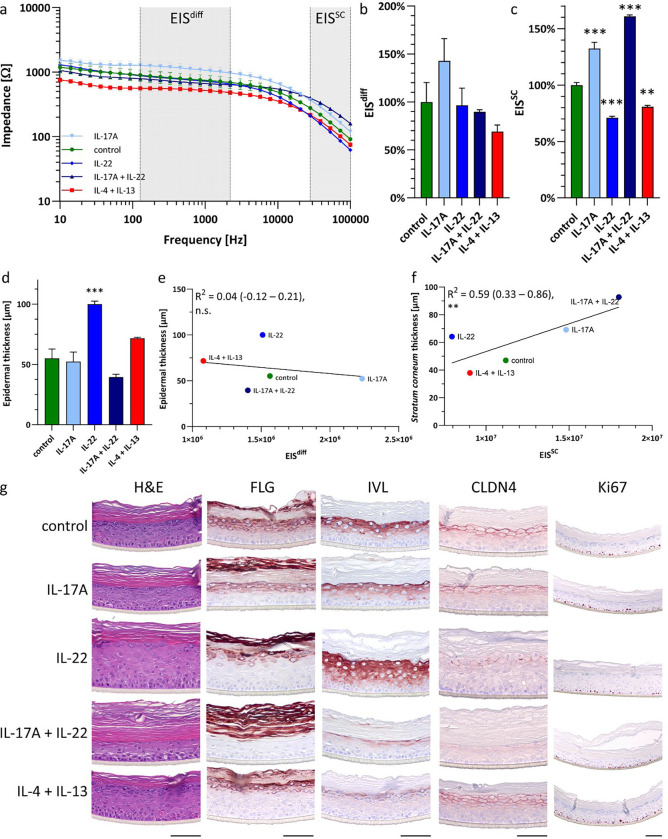
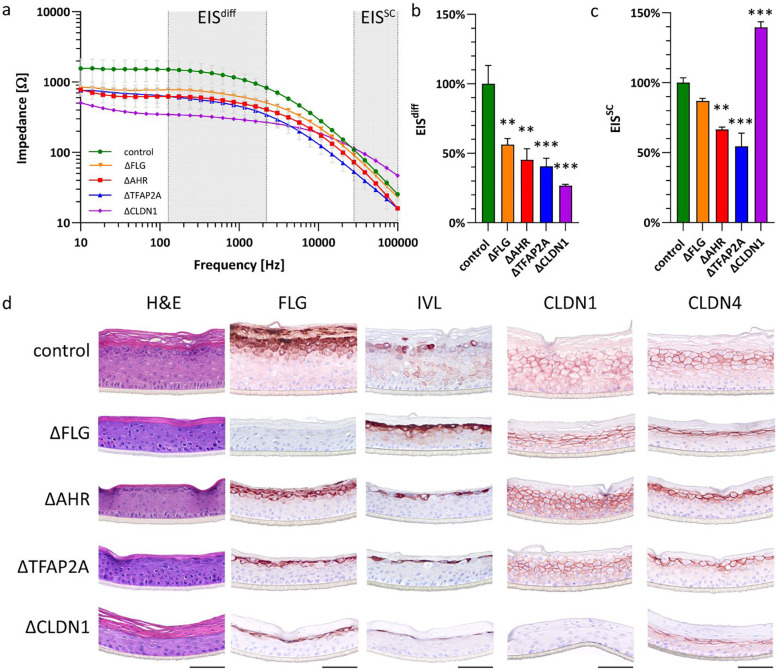
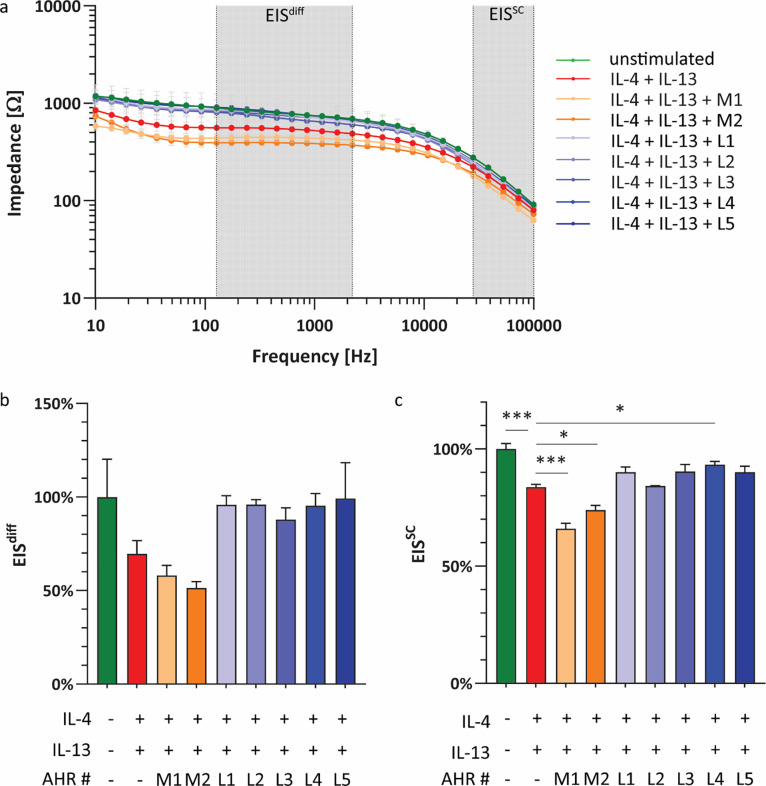
3 D human epidermal equivalents (HEEs) are a state-of-the-art organotypic culture model in pre-clinical investigative dermatology and regulatory toxicology. Here, we investigated the utility of electrical impedance spectroscopy (EIS) for non-invasive measurement of HEE epidermal barrier function. Our setup comprised a custom-made lid fit with 12 electrode pairs aligned on the standard 24-transwell cell culture system. Serial EIS measurements for seven consecutive days did not impact epidermal morphology and readouts showed comparable trends to HEEs measured only once. We determined two frequency ranges in the resulting impedance spectra: a lower frequency range termed EISdiff correlated with keratinocyte terminal differentiation independent of epidermal thickness and a higher frequency range termed EISSC correlated with stratum corneum thickness. HEEs generated from CRISPR/Cas9 engineered keratinocytes that lack key differentiation genes FLG, TFAP2A, AHR or CLDN1 confirmed that keratinocyte terminal differentiation is the major parameter defining EISdiff. Exposure to pro-inflammatory psoriasis- or atopic dermatitis-associated cytokine cocktails lowered the expression of keratinocyte differentiation markers and reduced EISdiff. This cytokine-associated decrease in EISdiff was normalized after stimulation with therapeutic molecules. In conclusion, EIS provides a non-invasive system to consecutively and quantitatively assess HEE barrier function and to sensitively and objectively measure barrier development, defects and repair.
Keywords: Human epidermal equivalents; TEER; electrical impedance spectroscopy; epidermal barrier; in vitro epidermis model; reconstructed human epidermis; skin barrier function.
Conflict of interest statement
CONFLICT OF INTEREST SR is CEO and founder of Locsense B.V. which contributed in–kind to this work. The results presented in the study are not influenced nor determined by the views or wishes of Locsense, nor did Locsense provide any financial support for this study that may conflicted with the results interpretation or presentation of data. The contribution of Locsense was limited to the development of the smart lid to fit the cell culture system and to providing technical support. Discussions with Locsense on the data representation and electrical circuit interpretation aided in correlating the data output to biological interpretations. The remaining authors declare no conflicts of interest.
Figures
Similar articles
-
Electrical Impedance Spectroscopy Quantifies Skin Barrier Function in Organotypic In Vitro Epidermis Models.J Invest Dermatol. 2024 Nov;144(11):2488-2500.e4. doi: 10.1016/j.jid.2024.03.038. Epub 2024 Apr 19. J Invest Dermatol. 2024. PMID: 38642800
-
Assessing Barrier Function in Psoriasis and Cornification Models of Artificial Skin Using Non-Invasive Impedance Spectroscopy.Adv Sci (Weinh). 2024 Sep;11(34):e2400111. doi: 10.1002/advs.202400111. Epub 2024 Jul 12. Adv Sci (Weinh). 2024. PMID: 38995098 Free PMC article.
-
Direct assessment of individual skin barrier components by electrical impedance spectroscopy.Allergy. 2021 Oct;76(10):3094-3106. doi: 10.1111/all.14851. Epub 2021 May 5. Allergy. 2021. PMID: 33844311
-
Filaggrin and Skin Barrier Function.Curr Probl Dermatol. 2016;49:1-7. doi: 10.1159/000441539. Epub 2016 Feb 4. Curr Probl Dermatol. 2016. PMID: 26844893 Review.
-
Barrier function regulates epidermal lipid and DNA synthesis.Br J Dermatol. 1993 May;128(5):473-82. doi: 10.1111/j.1365-2133.1993.tb00222.x. Br J Dermatol. 1993. PMID: 8504036 Review.
References
-
- Alexander H, Brown S, Danby S, Flohr C. Research Techniques Made Simple: Transepidermal Water Loss Measurement as a Research Tool. J. Invest. Dermatol. Elsevier; 2018. p. 2295–2300.e1 - PubMed
-
- Bäsler K, Bergmann S, Heisig M, Naegel A, Zorn-Kruppa M, Brandner JM. The role of tight junctions in skin barrier function and dermal absorption. J. Control. Release. J Control Release; 2016;242:105–18 - PubMed
-
- Bissonnette R, Stein Gold L, Rubenstein DS, Tallman AM, Armstrong A. Tapinarof in the treatment of psoriasis: A review of the unique mechanism of action of a novel therapeutic aryl hydrocarbon receptor–modulating agent. J. Am. Acad. Dermatol. Mosby Inc.; 2021. p. 1059–67 - PubMed
Publication types
Grants and funding
LinkOut - more resources
Full Text Sources
Miscellaneous