[Preprint]. 2024 Mar 20:2024.03.18.585554.
doi: 10.1101/2024.03.18.585554.

Light-gated Integrator for Highlighting Kinase Activity in Living Cells

Affiliations

Light-gated Integrator for Highlighting Kinase Activity in Living Cells

Wei Lin et al. bioRxiv. .

Update in

Abstract

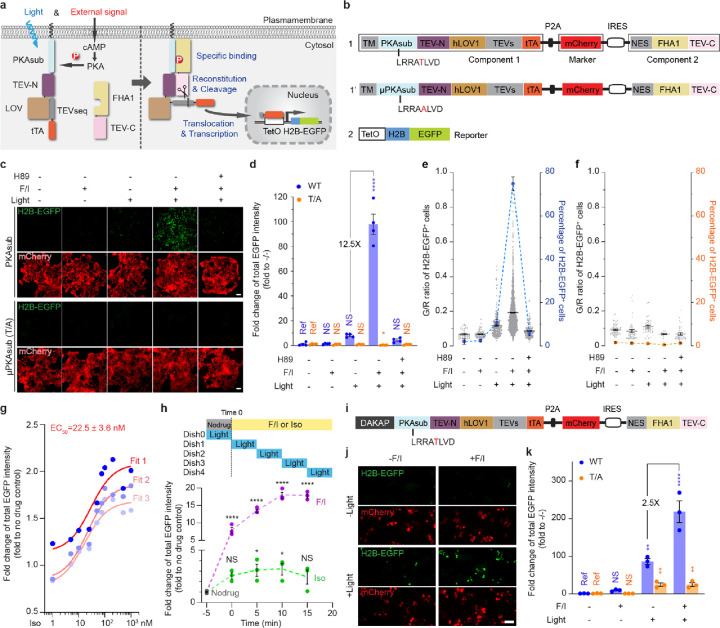
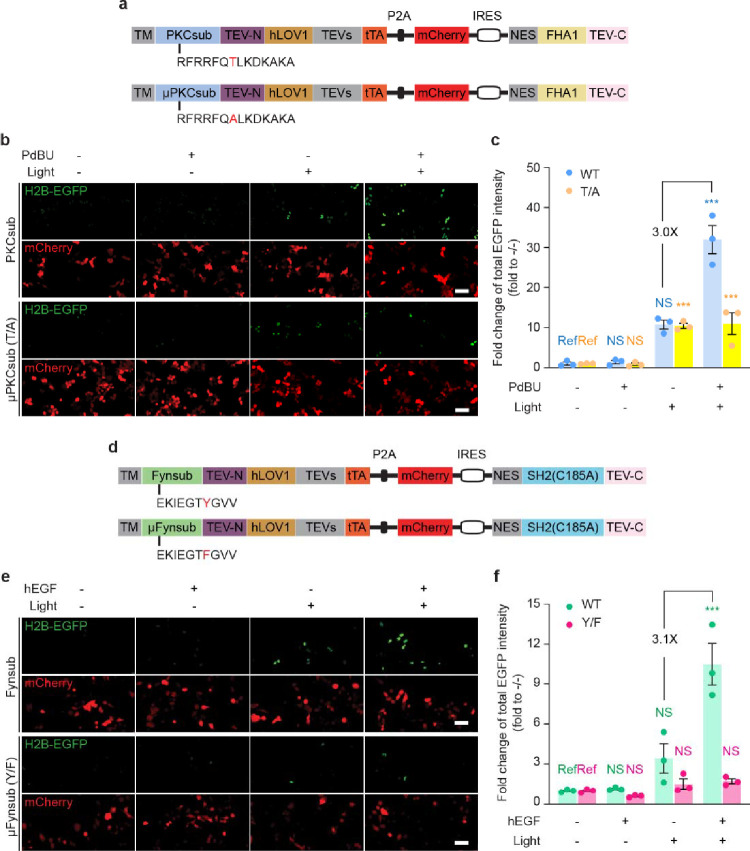
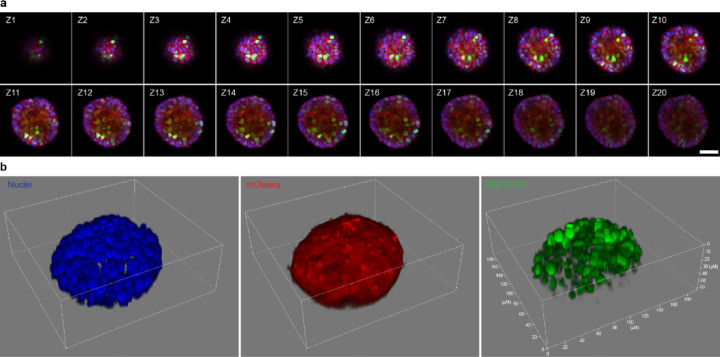
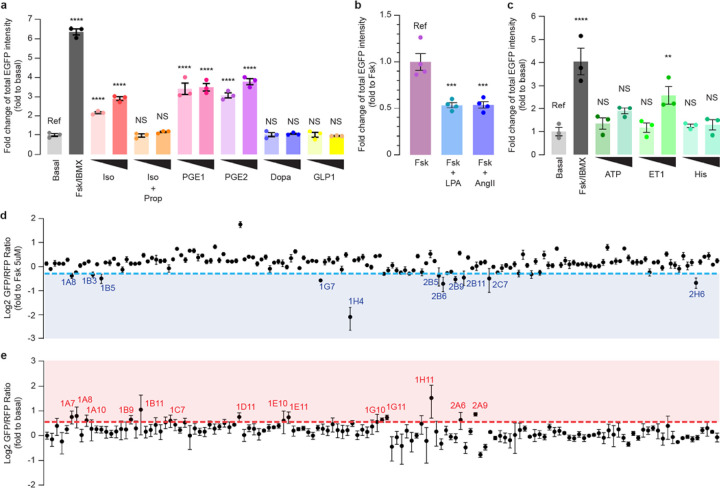
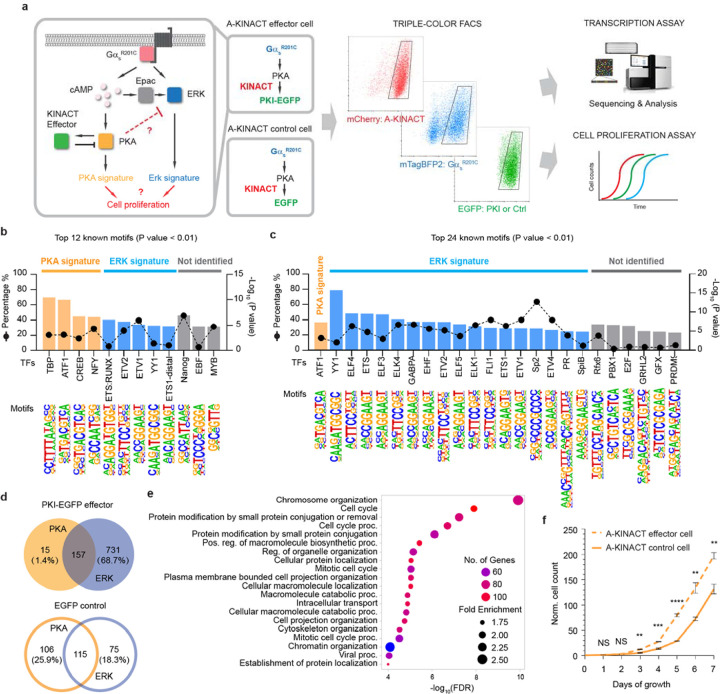
Protein kinases are key signaling nodes that regulate fundamental biological and disease processes. Illuminating kinase signaling from multiple angles can provide deeper insights into disease mechanisms and improve therapeutic targeting. While fluorescent biosensors are powerful tools for visualizing live-cell kinase activity dynamics in real time, new molecular tools are needed that enable recording of transient signaling activities for post hoc analysis and targeted manipulation. Here, we develop a light-gated kinase activity coupled transcriptional integrator (KINACT) that converts dynamic kinase signals into "permanent" fluorescent marks. KINACT enables robust monitoring of kinase activity across scales, accurately recording subcellular PKA activity, highlighting PKA signaling heterogeneity in 3D cultures, and identifying PKA activators and inhibitors in high-throughput screens. We further leverage the ability of KINACT to drive signaling effector expression to allow feedback manipulation of the balance of GαsR201C-induced PKA and ERK activation and dissect the mechanisms of oncogenic G protein signaling.


Figures

Figure 1 |
Figure 1 |. KINACT for cumulative PKA activity recording in live cells.
a, Schematic of PKA activity integrator and diagram of light- and activator-induced gene expression. b, The domain structure of A-KINACT (WT and T/A mutant). Construct 1 includes combines the two key components and a transfection marker, and construct 2 contains the H2B-EGFP reporter driven by TetO promoter. c, Snapshot imaging of cumulative PKA activity in A-KINACT (WT and T/A) dual-stable cells. Five treatment conditions were applied: −F/I/−light, +F/I/−light, −F/I/+light, +F/I/+light and H89 pretreat/+F/I/+light. d, Statistical quantification of total EGFP intensity under all conditions. P=0.0388 (T/A, +F/I/+light) and P<0.0001 (WT, +F/I/+light). e, The fraction and mean EGFP/mCherry (G/R) intensity ratio of H2B-EGFP+ cells stably expressing A-KINACT (WT). n = 52, n = 73, n = 285, n = 1975 and n = 154 cells. f, The fraction and G/R ratio of H2B-EGFP+ cells stably expressing A-KINACT (T/A). n = 52, n = 47, n = 37, n = 13 and n = 36 cells. g, The quantification of 3 replicates of isoproterenol (Iso) dose-response experiments in A-KINACT cells. The red lines represent 3 fitted logistic curves with an average fit value for the EC50. h, The quantification of light-gated experiments with full-time drug treatments (F/I, 50/100 μM or Iso, 100 nM) but 5-min time window of light illumination. Data points correspond to start of illumination (min after drug addition). P = 0.0417 (Iso, 5–10 min), P = 0.0333 (Iso, 10–15 min) and P < 0.0001 (F/I). i, Domain structure of outer mitochondrial membrane-targeted A-KINACT (WT) system. DAKAP was tagged at the N-terminus of component 1. j, Snapshot imaging of cumulative PKA activity near mitochondria. Four treatment conditions were applied: −F/I/−light, +F/I/−light, −F/I/+light and +F/I/+light. k, Statistical quantification of total EGFP intensity under all conditions. P = 0.0094 (WT, −F/I/+light), P < 0.0001 (WT, +F/I/+light), P = 0.0042 (T/A, −F/I/+light) and P = 0.0041 (T/A, +F/I/+light). For d-f, data from 4 independent experiments. For g, h and k, data from 3 independent experiments. For c and j, scale bars, 10 μm. For d, h and k, statistical analysis was performed using ordinary one-way ANOVA followed by Dunnett’s multiple-comparison test. NS, not significant. Data are mean ± s.e.m.
Fig. 2 |
Fig. 2 |. General applicability of KINACT to different type of kinases.
a, Domain structures of C-KINACT (WT and T/A mutant). b, Representative images showing C-KINACT and mutant C-KINACT (T/A) reporting PKC activity changes induced by PdBU (200 nM) in HEK293T cells. c, Statistical quantification of total EGFP intensity under all conditions. P=0.0008 (WT, +PdBU/+light), P=0.0004 (T/A, −PdBU/+light), P=0.0005 (T/A, +PdBU/+light). d, Domain structures of F-KINACT (WT and Y/F mutant). e, Representative images showing F-KINACT reporting Fyn activity changes induced by human EGF (hEGF, 100 nM) in HeLa cells. f, Statistical quantification of total EGFP intensity under all conditions. P=0.0003 (WT, +hEGF/+light). n = 3 independent experiments. For b and e, scale bars, 10 μm. For c and f, statistical analysis was performed using ordinary one-way ANOVA followed by Dunnett’s multiple-comparison test. NS, not significant. Data are mean ± s.e.m.
Fig. 3 |
Fig. 3 |. 3D imaging of heterogeneous PKA activity in HEK293T organoids.
a, Triple-color confocal imaging of an A-KINACT dual-stable organoid in the Z-direction. 20-layer merged images of Hoechst-stained nuclei (blue), mCherry (red) and H2B-EGFP (green). Scale bar, 50 μm. b, 3D reconstruction of individual channels showing nuclear positions (left), uniform A-KINACT expression (middle) and heterogeneity of PKA activity within the organoid. n = 3 organoids (see Supplementary Fig 7a for Organoid 2 and 3).
Fig. 4 |
Fig. 4 |. A-KINACT for evaluating PKA responses to small molecule libraries.
a, Functional PKA responses to Gαs-coupled receptor agonists: Iso (100 nM, 1 μM); Iso (100 nM, 1 μM) with propranolol (Prop) (10 μM) costimulation; PGE1 (1 μM, 10 μM); PGE2 (1 μM, 10 μM); dopamine (Dopa) (1 μM, 10 μM); glucagon-like peptide 1 (GLP1) (10 nM, 30 nM). ****P<0.0001. b, Functional PKA responses to Gαi-coupled receptor agonists: Fsk (100 nM, 1 μM) costimulation with LPA (500 nM) or angiotensin II (Ang-II; 10 μM). P=0.0006 (LPA) and P=0.0007 (Ang-II). c, Functional PKA responses to Gαq-coupled receptor agonists: ATP (1 μM, 10 μM); endothelin 1 (ET1) (30 nM, 100 nM) and histamine (His) (1 μM, 10 μM). P=0.0083 (ET1, 100nM) and ****P<0.0001. d, High-throughput library screening of 160 kinase inhibitors to discover potential PKA inhibitors. Compounds with an average value below the 0.8-fold cut-off (blue dash line) were collected. e, High-throughput library screening of 137 marine natural products to discover potential PKA activators. Compounds with an average value above the 1.5-fold cut-off (red dash line) were collected. n = 3 independent experiments. For a-c, statistical analysis was performed using ordinary one-way ANOVA followed by Dunnett’s multiple-comparison test. NS, not significant. Data are mean ± s.e.m.
Figure 5 |
Figure 5 |. A-KINACT effector diverts GαsR201C-PKA signaling toward the ERK pathway.
a, Design of A-KINACT effector for manipulating GαsR201C-mediated PKA activity and scheme for identifying transcriptional and phenotypic changes. b, Top 12 enriched known TF motifs among 410 upregulated DEGs from light-induced A-KINACT control (EGFP) cells overexpressing GαsR201C. c, Top 24 enriched known TF motifs among 1064 upregulated DEGs from light-induced A-KINACT effector (PKI-EGFP) cells overexpressing GαsR201C. d, Venn diagrams comparing the PKA signature versus ERK signature from A-KINACT effector cells (upper) and A-KINACT control cells (lower). e, GO enrichment analysis of 731 ERK-upregulated DEGs for biological processes. f, Growth curves of light-reduced A-KINACT effector cells (dashed line) and A-KINACT control cells (solid line) with GαsR201C overexpression. n=3 independent experiments. P=0.005 (day 3), P=0.00099 (day 4), P=0.00007 (day 5), P=0.0042 (day 6) and P=0.0043 (day 7). Statistical analyses were performed using unpaired t tests. Data are mean ± s.e.m.

Similar articles

References

    1. Greenwald E.C., Mehta S. & Zhang J. Genetically Encoded Fluorescent Biosensors Illuminate the Spatiotemporal Regulation of Signaling Networks. Chem. Rev. 118, 11707–11794 (2018). - PMC - PubMed
    1. Tsien R.Y. Very long-term memories may be stored in the pattern of holes in the perineuronal net. Proc. Natl. Acad. Sci. U. S. A. 110, 12456–12461 (2013). - PMC - PubMed
    1. Lee D., Hyun J.H., Jung K., Hannan P. & Kwon H.B. A calcium- and light-gated switch to induce gene expression in activated neurons. Nat. Biotechnol. 35, 858–863 (2017). - PubMed
    1. Wang W. et al. A light- and calcium-gated transcription factor for imaging and manipulating activated neurons. Nat. Biotechnol. 35, 864–871 (2017). - PMC - PubMed
    1. Lee D. et al. Temporally precise labeling and control of neuromodulatory circuits in the mammalian brain. Nat. Methods 14, 495–503 (2017). - PubMed

Publication types