

Fructooligosaccharides act on the gut-bone axis to improve bone independent of Tregs and alter osteocytes in young adult C57BL/6 female mice
- PMID: 38562914
- PMCID: PMC10982850
- DOI: 10.1093/jbmrpl/ziae021
Fructooligosaccharides act on the gut-bone axis to improve bone independent of Tregs and alter osteocytes in young adult C57BL/6 female mice
Erratum in
-
Correction to: Fructooligosaccharides act on the gut-bone axis to improve bone independent of Tregs and alter osteocytes in young adult C57BL/6 female mice.JBMR Plus. 2024 May 3;8(6):ziae055. doi: 10.1093/jbmrpl/ziae055. eCollection 2024 Jun. JBMR Plus. 2024. PMID: 38706879 Free PMC article.
Abstract
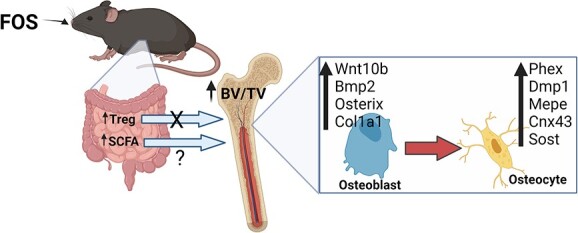
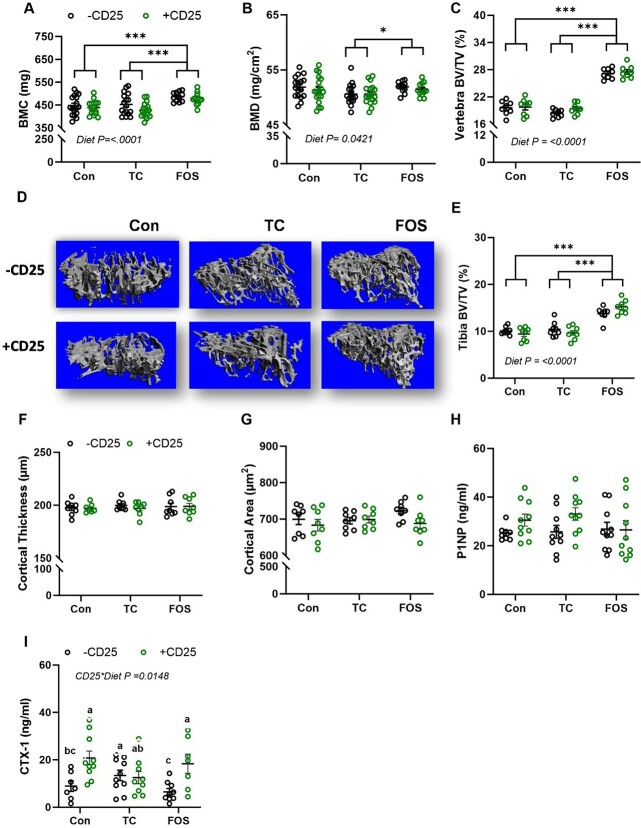
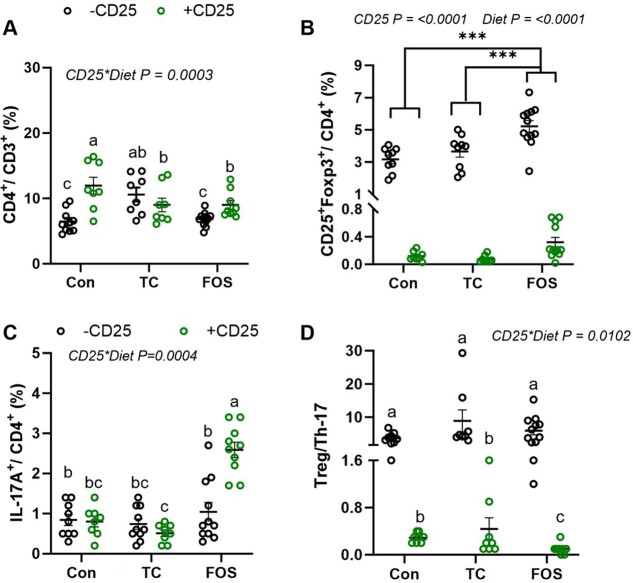
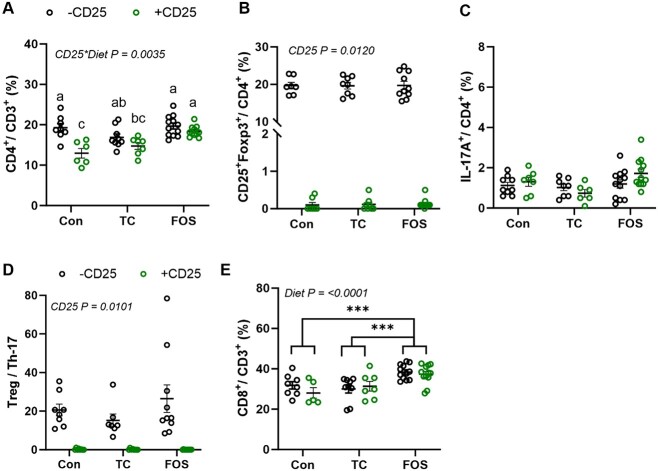
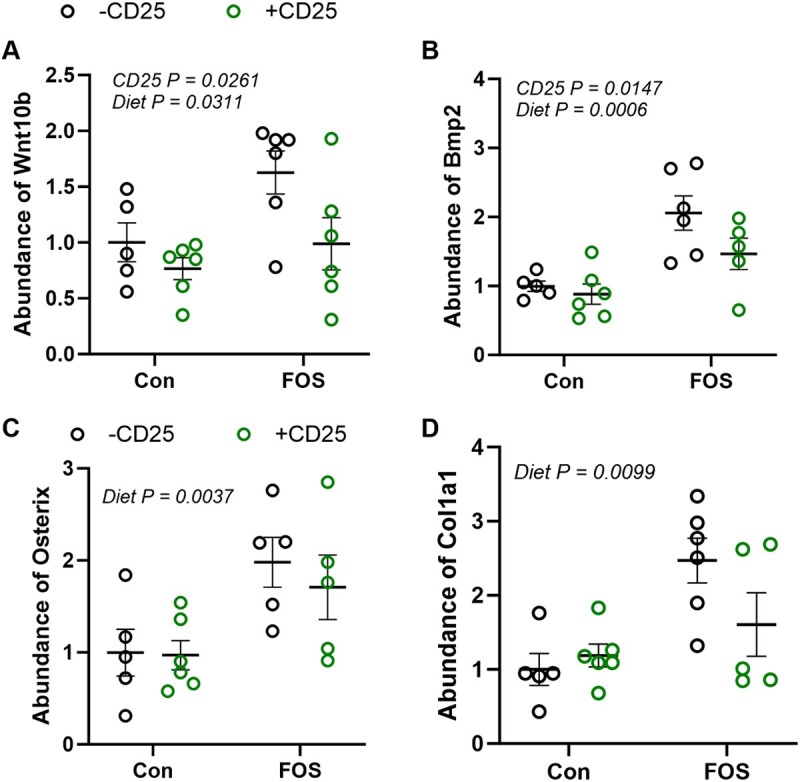
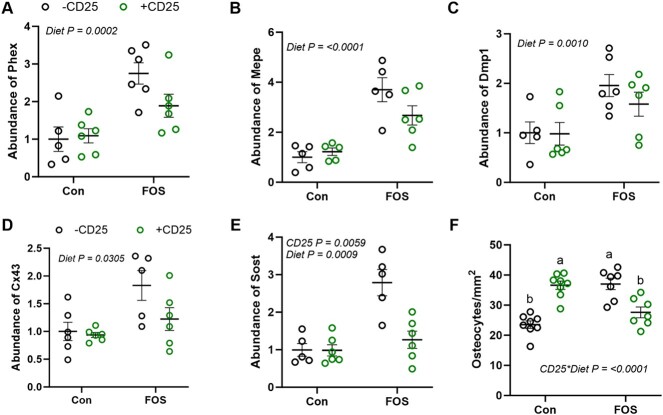
Targeting the gut-bone axis with probiotics and prebiotics is considered as a promising strategy to reduce the risk of osteoporosis. Gut-derived short chain fatty acids (SCFA) mediate the effects of probiotics on bone via Tregs, but it is not known whether prebiotics act through a similar mechanism. We investigated how 2 different prebiotics, tart cherry (TC) and fructooligosaccharide (FOS), affect bone, and whether Tregs are required for this response. Eight-wk-old C57BL/6 female mice were fed with diets supplemented with 10% w/w TC, FOS, or a control diet (Con; AIN-93M) diet, and they received an isotype control or CD25 Ab to suppress Tregs. The FOS diet increased BMC, density, and trabecular bone volume in the vertebra (~40%) and proximal tibia (~30%) compared to the TC and control diets (Con), irrespective of CD25 treatment. Both prebiotics increased (P < .01) fecal SCFAs, but the response was greater with FOS. To determine how FOS affected bone cells, we examined genes involved in osteoblast and osteoclast differentiation and activity as well as genes expressed by osteocytes. The FOS increased the expression of regulators of osteoblast differentiation (bone morphogenetic protein 2 [Bmp2], Wnt family member 10b [Wnt10b] and Osterix [Osx]) and type 1 collagen). Osteoclasts regulators were unaltered. The FOS also increased the expression of genes associated with osteocytes, including (Phex), matrix extracellular phosphoglycoprotein (Mepe), and dentin matrix acidic phosphoprotein 1 (Dmp-1). However, Sost, the gene that encodes for sclerostin was also increased by FOS as the number and density of osteocytes increased. These findings demonstrate that FOS has a greater effect on the bone mass and structure in young adult female mice than TC and that its influence on osteoblasts and osteocytes is not dependent on Tregs.
Keywords: fructooligosaccharide; gut–bone axis; osteocytes; prebiotics; short chain fatty acids; tart cherry.
© The Author(s) 2024. Published by Oxford University Press on behalf of the American Society for Bone and Mineral Research.
Conflict of interest statement
None declared.
Figures
Similar articles
-
Pigment epithelium derived factor suppresses expression of Sost/Sclerostin by osteocytes: implication for its role in bone matrix mineralization.J Cell Physiol. 2015 Jun;230(6):1243-9. doi: 10.1002/jcp.24859. J Cell Physiol. 2015. PMID: 25363869
-
Sclerostin is a locally acting regulator of late-osteoblast/preosteocyte differentiation and regulates mineralization through a MEPE-ASARM-dependent mechanism.J Bone Miner Res. 2011 Jul;26(7):1425-36. doi: 10.1002/jbmr.345. J Bone Miner Res. 2011. PMID: 21312267 Free PMC article.
-
Primary Human Osteocyte Networks in Pure and Modified Collagen Gels.Tissue Eng Part A. 2019 Oct;25(19-20):1347-1355. doi: 10.1089/ten.TEA.2018.0338. Epub 2019 Jun 14. Tissue Eng Part A. 2019. PMID: 30648477
-
Osteocyte Dysfunction in Joint Homeostasis and Osteoarthritis.Int J Mol Sci. 2021 Jun 17;22(12):6522. doi: 10.3390/ijms22126522. Int J Mol Sci. 2021. PMID: 34204587 Free PMC article. Review.
-
Effects of Type 1 Diabetes on Osteoblasts, Osteocytes, and Osteoclasts.Curr Osteoporos Rep. 2016 Dec;14(6):310-319. doi: 10.1007/s11914-016-0329-9. Curr Osteoporos Rep. 2016. PMID: 27704393 Free PMC article. Review.
Cited by
-
Gut microbiome and bone health: update on mechanisms, clinical correlations, and possible treatment strategies.Osteoporos Int. 2025 Feb;36(2):167-191. doi: 10.1007/s00198-024-07320-0. Epub 2024 Dec 7. Osteoporos Int. 2025. PMID: 39643654
-
The gut-bone axis in osteoporosis: a multifaceted interaction with implications for bone health.Front Endocrinol (Lausanne). 2025 Jul 16;16:1569152. doi: 10.3389/fendo.2025.1569152. eCollection 2025. Front Endocrinol (Lausanne). 2025. PMID: 40741168 Free PMC article. Review.
References
-
- Inderjeeth CA, Inderjeeth KA. Osteoporosis in older people. J Pharm Pract Res. 2021;51(3):265–274. 10.1002/jppr.1743. - DOI
-
- NIH Consensus Development Panel on Osteoporosis Prevention, Diagnosis, and Therapy, Osteoporosis prevention, diagnosis, and therapy. Jama, 2001;285(6):785–795.
Grants and funding
LinkOut - more resources
Full Text Sources
