. 2024 Apr 15;137(8):jcs261687.
doi: 10.1242/jcs.261687. Epub 2024 Apr 30.

DLC1 promotes mechanotransductive feedback for YAP via RhoGAP-mediated focal adhesion turnover

Affiliations

DLC1 promotes mechanotransductive feedback for YAP via RhoGAP-mediated focal adhesion turnover

Aukie Hooglugt et al. J Cell Sci. .

Abstract

Angiogenesis is a tightly controlled dynamic process demanding a delicate equilibrium between pro-angiogenic signals and factors that promote vascular stability. The spatiotemporal activation of the transcriptional co-factors YAP (herein referring to YAP1) and TAZ (also known WWTR1), collectively denoted YAP/TAZ, is crucial to allow for efficient collective endothelial migration in angiogenesis. The focal adhesion protein deleted-in-liver-cancer-1 (DLC1) was recently described as a transcriptional downstream target of YAP/TAZ in endothelial cells. In this study, we uncover a negative feedback loop between DLC1 expression and YAP activity during collective migration and sprouting angiogenesis. In particular, our study demonstrates that signaling via the RhoGAP domain of DLC1 reduces nuclear localization of YAP and its transcriptional activity. Moreover, the RhoGAP activity of DLC1 is essential for YAP-mediated cellular processes, including the regulation of focal adhesion turnover, traction forces, and sprouting angiogenesis. We show that DLC1 restricts intracellular cytoskeletal tension by inhibiting Rho signaling at the basal adhesion plane, consequently reducing nuclear YAP localization. Collectively, these findings underscore the significance of DLC1 expression levels and its function in mitigating intracellular tension as a pivotal mechanotransductive feedback mechanism that finely tunes YAP activity throughout the process of sprouting angiogenesis.

Keywords: Angiogenesis; DLC1; Endothelium; Focal adhesion; Force; Integrin; Mechanotransduction; Migration; Rho GTPase; Stiffness; YAP/TAZ.


Conflict of interest statement

Competing interests The authors declare no competing or financial interests.

Figures

Fig. 1.
Fig. 1.
DLC1 regulates YAP nuclear–cytoplasmic translocation and transcriptional activity through its RhoGAP function. (A,C) Representative immunofluorescence images of HUVECs transduced with GFP (control), GFP–DLC1 or GFP–DLC1-R677E at the migration rear and front (A), and in dense or sparse (C) culture conditions. Stained for YAP (magenta) and DAPI (green). Yellow asterisks in the YAP grayscale images indicate GFP-positive cells. Cells in the scratch wound assay were fixed 4 h after scratch initiation. (B,D) Schematic representation of cells with different nuclear-to-cytoplasmic ratios of YAP intensity, reflecting low (0.8), intermediate (1.0) and high (1.2) levels of nuclear YAP (B, top). Graphs depicting the nuclear-to-cytoplasmic ratio of YAP intensity at the migration rear and front (B, bottom), and in dense or sparse (D) culture conditions. Gray circles represent the YAP ratio of individual cells. Total number of cells quantified (B) rear: control=206 cells, DLC1=159 cells, DLC1-R677E=181 cells; (B) front: control=131 cells, DLC1=89 cells, DLC1-R677E=108 cells; (D) dense: control=150 cells, DLC1=150 cells, DLC1-R677E=150 cells; (D) sparse: control=74 cells, DLC1=120 cells, DLC1-R677E=101 cells. The median YAP ratio of three independent experiments is presented and was tested by one-way ANOVA, Tukey's multiple comparisons test. (E) Representative western blot analysis of lysates from sparsely cultured HUVECs transduced with GFP (control), GFP–DLC1 or GFP–DLC1-R677E. Blotted for phospho-YAP S127 (pYAP), YAP, CTGF, DLC1 and β-actin (loading control). (F) Bar graphs show the ratio between pYAP S127 and YAP, and CTGF levels. a.u. arbitrary units. Data is from n=7 independent experiments; one-way ANOVA, Tukey's multiple comparisons test. All error bars are mean±s.e.m. ns, not significant; *P<0.05; **P<0.01.
Fig. 2.
Fig. 2.
DLC1, and its RhoGAP function, are needed to inhibit YAP translocation to the nucleus. (A,C) Representative immunofluorescence images of HUVECs transduced with shControl, shDLC1 3′UTR and subsequently rescued with GFP–DLC1 or GFP–DLC1-R677E at the migration rear and front (A), and in dense or sparse (C) culture conditions. Stained for YAP (red), F-actin (cyan) and DAPI (green). Yellow asterisks in the YAP grayscale images indicate GFP-positive cells. Cells in the scratch wound assay were fixed 4 h after scratch initiation. (B,D) Graphs depicting the nuclear-to-cytoplasmic ratio of YAP intensity at the migration rear and front (B), and in dense or sparse (D) culture conditions. Gray circles represent the YAP ratio of individual cells. Total number of cells quantified (B) rear: control=265 cells, shDLC1=259 cells, shDLC1+DLC1=136 cells, shDLC1+DLC1-R677E=168 cells; (B) front: control=93 cells, shDLC1=70 cells, shDLC1+DLC1=61 cells, shDLC1+DLC1-R677E=76 cells; (D) dense: control=245 cells, shDLC1=236 cells, shDLC1+DLC1=129 cells, shDLC1+DLC1-R677E=196 cells; (D) sparse: control=60 cells, shDLC1=87 cells, shDLC1+DLC1=52 cells, shDLC1+DLC1-R677E=66 cells. The median YAP ratio of three independent experiments is presented and was tested by one-way ANOVA, Tukey's multiple comparisons test. (E) Representative western blot analysis from three repeats of lysates from HUVECs transduced with shControl or shDLC1 3′UTR and subsequently rescued with GFP-DLC1 or GFP–DLC1-R677E. Blotted for DLC1 and β-actin (loading control). All error bars are mean±s.e.m. ns, not significant; *P<0.05; **P<0.01; ***P<0.001.
Fig. 3.
Fig. 3.
The RhoGAP function of DLC1 is essential for YAP-driven angiogenic sprouting. (A) Representative widefield images of spheroid-based sprouting assays of HUVECs transduced with GFP control, GFP–DLC1 or GFP–DLC1-R677E at 16 h after stimulation with VEGF. (B) Violin plots depict the cumulative sprout length and sprout number. Data is from n=3 independent experiments, control=25 spheroids, DLC1=25 spheroids, DLC1-R677E=24 spheroids; one-way ANOVA, Tukey's multiple comparisons test. (C) Representative widefield images of spheroid-based sprouting assay with HUVECs transduced with shControl, shDLC1 3′UTR, and subsequently rescued with GFP–DLC1 or GFP–DLC1-R677E at 16 h after stimulation with VEGF. (D) Violin plots depict the cumulative sprout length and sprout number. Data is from n=3 independent experiments, shControl=27 spheroids, shDLC1 3′UTR=19 spheroids, shDLC1+DLC1=21 spheroids, shDLC1+DLC1-R677E=19 spheroids; one-way ANOVA, Bonferroni's test. (E) Representative immunofluorescence images of competition sprouting assay with control (RFP) and GFP–DLC1, or control (RFP) and GFP–DLC1-R677E spheroids at the onset of VEGF stimulation and 15 h after VEGF stimulation. (F) Violin plots depicting average sprout length and sprout number of control (RFP), GFP–DLC1 or GFP–DLC1-R677E positive sprouts. Data is from n=3 independent experiments, DLC1 spheroids=12, DLC1-R677E spheroids=12; two-way ANOVA, Bonferroni's test. (G) Representative widefield images of spheroid-based sprouting assays of HUVECs transduced with shControl, shYAP and subsequently transduced with GFP–DLC1 or GFP–DLC1-R677E at 16 h after stimulation with VEGF. (H) Violin plots depict the cumulative sprout length and sprout number. Data is from n=3 independent experiments, shControl=20 spheroids, shYAP=18 spheroids, shYAP+DLC1=20 spheroids, shDLC1+DLC1-R677E=23 spheroids; one-way ANOVA, Bonferroni's test. In violin plots, dashed bars indicate the quartiles and solid bars the median.
Fig. 4.
Fig. 4.
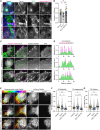
DLC1 controls focal adhesion turnover and maturation in a RhoGAP-dependent manner. (A) Representative immunofluorescence images of HUVECs expressing GFP (control), GFP–DLC1 or GFP–DLC1-R677E (green) and stained for F-actin (blue) and phosphorylated paxillin Y118 (magenta). (B) Bar graph shows the number of focal adhesions per cell, corrected for cell surface area. Focal adhesions were determined in 5 GFP-positive cells per condition for each independent experiment (n=3, represented by different symbols); one-way ANOVA, Tukey's multiple comparisons test. (C) Representative TIRF images from four repeats of live imaged HUVECs transduced with GFP (control), GFP–DLC1 or GFP–DLC1-R677E and mCherry–paxillin. See Movie 1 for the corresponding 3 h time-lapse recording. (D) Line graph analysis showing the colocalization of mCherry–paxillin with GFP–DLC1 and GFP–DLC1-R677E signal in live imaged HUVECs. a.u. arbitrary units. (E) Representative TIRF images of the mCherry–paxillin signal from live imaged HUVECs transduced with GFP (control), GFP–DLC1 or GFP–DLC1-R677E and mCherry–paxillin. Focal adhesion dynamics over 1.5 h are visualized by temporal color coding of mCherry–paxillin signal (1 color per frame, 1 frame/minute). Regions of interest (ROIs) highlight the contractile areas of the cells. Right panels display mCherry–paxillin signal in grayscale at timepoints t=0 h and t=1.5 h. (F,G) Graphs show the quantification of focal adhesion assembly and disassembly (F) and lifetime (G) based on TIRF timelapse imaging with HUVECs expressing GFP, GFP–DLC1 or GFP–DLC1-R677E and mCherry–paxillin. Gray circles represent each tracked focal adhesion, colored icons represent the median per cell. Data from n=4 independent experiments, the average number of focal adhesions tracked per cell: Control (329 assembly, 361 disassembly, 212 lifetime; 8 cells), GFP–DLC1 (234 assembly, 352 disassembly, 94 lifetime; 7 cells), GFP-DLC1-R677E (522 assembly, 577 disassembly, 323 lifetime; 7 cells). Time-lapse recordings were 3–4 h long and analyzed using the focal adhesion analysis server (Berginski and Gomez, 2013); one-way ANOVA, Tukey's multiple comparisons test. All error bars are mean±s.e.m. ns, not significant; *P<0.05; **P<0.01; ***P<0.001.
Fig. 5.
Fig. 5.
The RhoGAP function of DLC1 inhibits basal Rho signaling and traction forces. (A,C) Representative western blot analysis of RhoA-GTP levels in lysates from HEK 293T cells (A) and HUVECs (C) transduced with GFP (control), GFP–DLC1 or GFP–DLC1-R677E from rhotekin pull-downs. Blotted for RhoA, DLC1 and β-actin (loading control). (B,D) Bar graphs showing the ratio between RhoA-GTP and RhoA levels in HEK 293T cells (B) and HUVECs (D), and RhoA total protein levels in HUVECs (D). Data are from n=3 independent experiments; one-way ANOVA, Tukey's multiple comparisons test. (E) Representative TIRF images from live imaged HUVECs stimulated with thrombin and expressing the Rho biosensor dT-2xrGBD in control cells (white arrow), or in GFP–DLC1 or GFP–DLC1-R677E cells (green arrow). See corresponding Movie 2 for the 15 min time-lapse recording. (F) Normalized fluorescence intensity of the Rho biosensor dT-2xrGBD upon thrombin stimulation over time and at 2 min of stimulation. Data is from n=3 independent experiments, control=5 cells, DLC1=5 cells, DLC1-R677E=5 cells; one-way ANOVA, Tukey's multiple comparisons test. (G) Representative immunofluorescence images of HUVECs transduced with GFP (control), GFP–DLC1 or GFP–DLC1-R677E (green) and stained for phospho-cofilin S3 (pCofilin; magenta). Yellow asterisks in the grayscale images indicate GFP-positive cells. (H) The fluorescence intensity of pCofilin per cell. Gray circles represent the pCofilin intensity of individual cells. Data is from n=3 independent experiments, control=52 cells, DLC1=64 cells, DLC1-R677E=49 cells; one-way ANOVA, Tukey's multiple comparisons test. (I) Representative images of HUVECs transduced with GFP (control), GFP–DLC1 or GFP–DLC1-R677E and seeded on fluorescent bead-containing polyacrylamide gels (4 kPa) with corresponding heatmap of computed tractions. Arrows indicate direction of tractions. The cell edge is outlined in white. (J) Bar graph presents the average tractions per cell. Cells without any measureable tractions were not included in this quantification. Dots represent single cells: control=19 cells, DLC1=22 cells, DLC1-R677E=35 cells; Kruskal–Wallis, Dunn's multiple comparisons test. All error bars are mean±s.e.m. ns, not significant; *P<0.05; **P<0.01; ***P<0.001; ****P<0.0001.
Fig. 6.
Fig. 6.
DLC1 RhoGAP activity provides cytoskeletal force-mediated feedback for YAP. (A) Representative TIRF images from live imaged HUVECs transduced with GFP (control), GFP–DLC1 or GFP–DLC1-R677E and mCherry–paxillin stimulated with thrombin. See corresponding Movie 4 for the 45 min time-lapse recording. (B) Graph shows the cumulative mature focal adhesion area per cell at 0 and 30 min of thrombin stimulation. Focal adhesions were considered mature when larger than 1 µm2. Data is from n=3 independent experiments, DLC1=10 cells, DLC1-R677E=9 cells; two-way ANOVA, Šídák's multiple comparisons test. (C) Representative immunofluorescence images of HUVECs transduced with GFP (control) or GFP–DLC1, cultured in sparse conditions. Cells were serum starved and fixed after 0 min, 30 min or 60 min of thrombin stimulation and stained for YAP (magenta). Of note, serum-starvation reduced basal nuclear YAP localization compared to cells in normal medium as shown in Fig. 1C. (D) Graphs depicting the nuclear-to-cytoplasmic ratio of YAP intensity in thrombin-stimulated control or DLC1-expressing cells. Gray circles represent the YAP ratio of individual cells. Total number of cells quantified: control 0 min=109 cells, 30 min=91 cells, 60 min=106 cells; DLC1 0 min=87 cells, 30 min=97 cells, 60 min=87 cells. The mean±s.e.m. YAP ratio of n=4 independent experiments is presented and tested by two-way ANOVA, Dunnett's multiple comparisons test. ns, not significant; *P<0.05; **P<0.01. (E) Graphical summary of the RhoGAP-mediated feedback loop of DLC1 on YAP activity. Created with BioRender.com.

References

    1. Abraham, S., Yeo, M., Montero-Balaguer, M., Paterson, H., Dejana, E., Marshall, C. J. and Mavria, G. (2009). VE-cadherin-mediated cell-cell interaction suppresses sprouting via signaling to MLC2 phosphorylation. Curr. Biol. 19, 668-674. 10.1016/j.cub.2009.02.057 - DOI - PubMed
    1. Amerongen, G. P. N., Delft, S., Vermeer, M. A., Collard, J. G. and van Hinsbergh, V. W. M. (2000). Activation of RhoA by thrombin in endothelial hyperpermeability: role of Rho kinase and protein tyrosine kinases. Circ. Res. 87, 335-340. 10.1161/01.RES.87.4.335 - DOI - PubMed
    1. Amin, E., Jaiswal, M., Derewenda, U., Reis, K., Nouri, K., Koessmeier, K. T., Aspenström, P., Somlyo, A. V., Dvorsky, R. and Ahmadian, M. R. (2016). Deciphering the molecular and functional basis of RHOGAP family proteins: a systematic approach toward selective inactivation of RHO family proteins. J. Biol. Chem. 291, 20353-20371. 10.1074/jbc.M116.736967 - DOI - PMC - PubMed
    1. Azad, T., Ghahremani, M. and Yang, X. (2019). The role of YAP and TAZ in angiogenesis and vascular mimicry. Cells 8, 407. 10.3390/cells8050407 - DOI - PMC - PubMed
    1. Berginski, M. E. and Gomez, S. M. (2013). The Focal Adhesion Analysis Server: a web tool for analyzing focal adhesion dynamics. F1000Research 68, 4-8. 10.12688/f1000research.2-68.v1 - DOI - PMC - PubMed

Publication types

MeSH terms