. 2024 May 10;134(10):1240-1255.
doi: 10.1161/CIRCRESAHA.123.324183. Epub 2024 Apr 2.

Age-Dependent RGS5 Loss in Pericytes Induces Cardiac Dysfunction and Fibrosis

Affiliations

Age-Dependent RGS5 Loss in Pericytes Induces Cardiac Dysfunction and Fibrosis

Anita Tamiato et al. Circ Res. .

Abstract

Background: Pericytes are capillary-associated mural cells involved in the maintenance and stability of the vascular network. Although aging is one of the main risk factors for cardiovascular disease, the consequences of aging on cardiac pericytes are unknown.

Methods: In this study, we have combined single-nucleus RNA sequencing and histological analysis to determine the effects of aging on cardiac pericytes. Furthermore, we have conducted in vivo and in vitro analysis of RGS5 (regulator of G-protein signaling 5) loss of function and finally have performed pericytes-fibroblasts coculture studies to understand the effect of RGS5 deletion in pericytes on the neighboring fibroblasts.

Results: Aging reduced the pericyte area and capillary coverage in the murine heart. Single-nucleus RNA sequencing analysis further revealed that the expression of Rgs5 was reduced in cardiac pericytes from aged mice. In vivo and in vitro studies showed that the deletion of RGS5 impaired cardiac function, induced fibrosis, and morphological changes in pericytes characterized by a profibrotic gene expression signature and the expression of different ECM (extracellular matrix) components and growth factors, for example, TGFB2 and PDGFB. Indeed, culturing fibroblasts with the supernatant of RGS5-deficient pericytes induced their activation as evidenced by the increased expression of αSMA (alpha smooth muscle actin) in a TGFβ (transforming growth factor beta)2-dependent mechanism.

Conclusions: Our results have identified RGS5 as a crucial regulator of pericyte function during cardiac aging. The deletion of RGS5 causes cardiac dysfunction and induces myocardial fibrosis, one of the hallmarks of cardiac aging.

Keywords: cardiovascular diseases; fibroblasts; fibrosis; heart failure; pericytes.


Conflict of interest statement

Disclosures None.

Figures

Figure 1.
Figure 1.
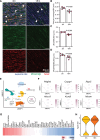
Pericytes are reduced in the old heart and Rgs5 expression is downregulated in the aged heart. A, Immunofluorescence staining of left ventricular cross sections of 3- and 18-month-old C57BL/6 murine hearts. Pericytes are identified as double PDGFR (platelet-derived growth factor receptor)β- and NG2 (neural glial 2)-positive cells (arrowheads). B, Quantification of pericyte coverage normalized to the vasculature area. C, Quantification of NG2 coverage normalized to the vasculature area. D, Quantification of PDGFRβ coverage normalized to the vasculature area. B through D, Every data point (n=5) represents 1 independent mouse. Data are shown as mean±SEM. P values were calculated using Mann-Whitney U test. E, Uniform manifold approximation and projection (UMAP) plot showing cell-type-specific clustering of all data points from cardiac single-nucleus sequencing. Across both 3- (n=3; 14 247 cells) and 18-month-old (n=3; 12 402 cells) samples, we identified 10 individual cell types: cardiomyocytes, endothelial cells (ECs), epicardial cells, fibroblasts, immune cells, lymphatic ECs, pericytes, pericyte cells (PCs)/endothelial mixed clusters (ECs), Schwann-like cells (SWL), and smooth muscle cells. F, Feature plot showing gene expression of pericyte marker genes (Pdgfrb, Cspg4, Rgs5, Abcc9, Kcnj8, and Mcam). The colored scale bar indicates the log-normalized gene expression level. G, Heatmap showing differentially expressed genes (DEGs) between 3- and 18-month-old pericytes. Upregulated genes are represented in red and downregulated genes in blue. H, Violin plot showing Rgs5 normalized gene expression value (unique molecular identifier; UMI) for the pericyte cluster in 3- and 18-month-old hearts. P value was calculated using bimod test.
Figure 2.
Figure 2.
RGS5 knockdown induces functional and morphological alterations in human pericytes. A, Gating strategy for BrdU proliferation assay using siControl-treated hPC-PL. B, Representative FACS plots showing a reduction in the proliferation rate in RGS5 knockdown pericytes (right) compared with siControl (left). C, Cell cycle phases distribution differences in hPC-PL between siControl and siRGS5 conditions (siControl: apoptotic cells=7.76%, G1=57.90%, G2/M=4.85%, S=28.50%; siRGS5: apoptotic cells=12.10%, G1=67.40%, G2/M=12.20%, S=7.38%). D, Quantification of S-phase events (BrdU+ and 7AAD+) shows a significant reduction upon RGS5 knockdown represented in B. Every data point (n=4) represents an independent transfection. Data are represented as mean±SEM and P value is calculated using Mann-Whitney U test. E and F, Representative images of hPC-PL migration at 0- and 10-hour time points comparing siControl and siRGS5 conditions. G, Pericyte migration is reduced upon RGS5 knockdown in hPC-PL. Values are expressed as percentage of closed area from time 0. Every data point (n=7) represents independent transfections and different colors indicate 3 different hPC-PL lots. Data are represented as mean±SEM and P value is calculated using Mann-Whitney U test. H and I, Representative image of Matrigel coculture assay of pericytes (green) and endothelial cells (red). Morphologically different pericytes were found in RGS5 knockdown sample. J, Quantification of morphologically different pericytes normalized to the total endothelial cell (EC) area. Every data point (n=3, P=0.1) represents an independent transfection. Data are represented as mean±SEM and P value is calculated using Mann-Whitney U test. K, Immunofluorescence images of hPC-PL showing the cytoskeleton (green) and the focal adhesions (white) indicating an increase in pericyte cells (PCs) size upon RGS5 knockdown. L, Quantification of the cell area. Data distribution shows independent transfected cells (repeated in 2 different hPC-PL lots) represented as mean±SEM and P value is calculated using Mann-Whitney U test. M, Quantification of the number of focal adhesion points per cell stained with vinculin and normalized to the cell area. Data distribution shows independent transfected cells (repeated in 2 different hPC-PL lots) represented as mean±SEM and P value is calculated using Mann-Whitney U test. N and O, Quantification of the pericyte cell width and length. Data distribution shows independent transfected cells represented as mean±SEM and P values are calculated using Mann-Whitney U test. 7AAD indicates 7-Aminoactinomycin D; BrdU, bromodeoxyuridine; FACS, fluorescence-activated cell sorting; G1, Gap1 phase; G2, Gap2 phase; hPC-PL, Human Pericytes from Placenta; M, mitosis; and S, synthesis phase.
Figure 3.
Figure 3.
Pericyte total area is increased in Rgs5ΔPC hearts. A, Scheme of the experimental design. B, Immunofluorescence staining of left ventricular cross sections of control and Rgs5ΔPC hearts 4 weeks (4W) and 8 weeks (8W) after tamoxifen injection. Pericytes are indicated as double PDGFRβ (platelet-derived growth factor receptor β)- and NG2 (neural glial 2)-positive cells (arrowheads). C, Measurement of pericyte total volume shows a significant increase in Rgs5ΔPC hearts both 4W and 8W after tamoxifen injection. P values are calculated using the Mann-Whitney U test (control vs Rgs5ΔPC at 4W, n=5; control and Rgs5ΔPC at 8W, n=8) and represented as mean±SEM. D, Measurement of pericyte coverage of the vasculature shows an increased pericyte volume in Rgs5ΔPC hearts 4W after tamoxifen, back to normal 8W after tamoxifen injection. P values are calculated using the Mann-Whitney U test (control vs Rgs5ΔPC at 4W, n=5, control and Rgs5ΔPC 8W, n=8; P=0.44) and represented as mean±SEM. E, Pericyte cell body count normalized to total endothelial cell volume shows no significant difference between control and Rgs5ΔPC. P values are calculated using Mann-Whitney U test (4W, n=4 and 5, respectively; P=0.90; 8W, n=5 and 6, respectively; P=0.33). F, Pericyte branch count shows no significant difference between control and Rgs5ΔPC 8W after tamoxifen injection. P value is calculated using Mann-Whitney U test (n=5 and 6, respectively; P=0.93). C through F, All quantifications are normalized to the vasculature area and expressed as fold change (FC) from control. Every data point represents 1 independent mouse.
Figure 4.
Figure 4.
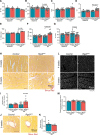
Rgs5 deletion in pericytes compromises heart function and increases collagen deposition in the heart. A through G, Echocardiography analysis of control and Rgs5ΔPC mice. A, Left ventricle ejection fraction (LVEF) in control and Rgs5ΔPC mice 4 weeks (4W) after tamoxifen injection. Data are represented as mean±SEM and P values are calculated using Kruskal-Wallis test (n=5; baseline control vs baseline Rgs5ΔPC; P>0.99; baseline control vs control 4W; P>0.99; baseline Rgs5ΔPC vs Rgs5ΔPC 4W; P=0.08; control 4W vs Rgs5ΔPC 4W; P=0.25). B, Echocardiography analysis of LV-EF in control and Rgs5ΔPC mice 8 weeks (8W) after tamoxifen injection. Data are represented as mean±SEM and P values are calculated using the Kruskal-Wallis test (n=18 control, n=20 Rgs5ΔPC; baseline control vs baseline Rgs5ΔPC; P>0.99; baseline Rgs5ΔPC vs Rgs5ΔPC 8W; P=0.003; baseline control vs control 8W; P>0.99). C, Echocardiography analysis of E/E′ value in the control and Rgs5ΔPC mice 8W after tamoxifen injection. Data are represented as mean±SEM and P values are calculated using the Kruskal-Wallis test (n=9; baseline control vs baseline Rgs5ΔPC; P>0.99; baseline control vs control 8W; P=0.34; baseline control vs Rgs5ΔPC 8W; P=0.1). D, Echocardiography analysis of T;d value in control and Rgs5ΔPC mice 8W after tamoxifen injection. Data are represented as mean±SEM and P values are calculated using the Kruskal-Wallis test (n=18 control, n=20 Rgs5ΔPC; baseline control vs baseline Rgs5ΔPC; P>0.99; baseline Rgs5ΔPC vs Rgs5ΔPC 8W; P=0.000051; baseline control vs control 8W; P>0.99). E, Left ventricular mass measurements expressed in milligrams in control and Rgs5ΔPC mice 4W after tamoxifen injection. Data are represented as mean±SEM and P values are calculated using the Kruskal-Wallis test (n=5; baseline control vs baseline Rgs5ΔPC; P>0.99; baseline Rgs5ΔPC vs Rgs5ΔPC 4W, P=0.17; baseline control vs control 4W; P>0.99). F, Left ventricular mass measurements expressed in milligrams in control and Rgs5ΔPC mice 8W after tamoxifen injection. Data are represented as mean±SEM and P values are calculated using the Kruskal-Wallis test (n=18 control, n=20 Rgs5ΔPC; baseline Rgs5ΔPC vs Rgs5ΔPC 8W; P=0.0000018; baseline control vs baseline Rgs5ΔPC; P>0.99; baseline control vs control 8W; P>0.99). G, Echocardiography analysis of LV vol;d value in control and Rgs5ΔPC mice 8W after tamoxifen injection. Data are represented as mean±SEM and P values are calculated using Kruskal-Wallis test (n=18 control, n=20 Rgs5ΔPC; baseline control vs baseline Rgs5ΔPC; P>0.99; baseline control vs control 8W; P=0.43; baseline Rgs5ΔPC vs Rgs5ΔPC 8W; P=0.1). H, Representative pictures of sirius red collagen (red) staining of control and Rgs5ΔPC left ventricular free wall of 4μm paraffin sections. I, Measurement of collagen area normalized to tissue total area (n=5, 4W; n=9, 8W; control vs Rgs5ΔPC at 4W; P=0.309). J, Representative pictures of perivascular sirius red collagen (red) staining of control and Rgs5ΔPC of 4 µm paraffin sections. K, Measurement of perivascular collagen area normalized to the vascular lumen (n=6, control vs Rgs5ΔPC at 4W; P=0.39). I and K, Data are represented as mean±SEM and P values are calculated using the Mann-Whitney U test (control vs Rgs5ΔPC at 4W; control and Rgs5ΔPC at 8W). L, WGA (wheat germ agglutinin) staining on 4 µm paraffin sections of the LV wall in control and Rgs5ΔPC hearts 4W (n=5) and 8W (n=9). M, Quantification of cardiomyocyte relative area shows no significant difference between control and Rgs5ΔPC at 4W (n=5; P=0.309), control and Rgs5ΔPC at 8W (n=9 and 8, respectively; P=0.683). M, Data are represented as mean±SEM and P values are calculated using the Mann-Whitney U test (control vs Rgs5ΔPC at 4W; control and Rgs5ΔPC at 8W). A through G, I, M, and K, Every data point represents 1 independent mouse. CD indicates Cluster of Differentiation; T;d, thickness of the ventricular septum in diastole; and vol;d, left ventricular volume in diastole.
Figure 5.
Figure 5.
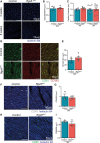
Rgs5 loss in pericytes does not affect microvascular integrity. A, Isolectin B4 fluorescence staining of 4µm paraffin sections of the free wall of the left ventricle in control and Rgs5ΔPC hearts 4 weeks (4W) and 8 weeks (8W) after tamoxifen injection. B, Vascular coverage is not significantly changed between control and Rgs5ΔPC hearts 8W after tamoxifen injection (n=3 and 4 respectively; P>0.99). C, Quantification of capillary perimeter shows no significant difference between control vs Rgs5ΔPC at 4W (n=4 and 5, respectively; P=0.41); control and Rgs5ΔPC at 8W (n=9; P=0.93). D and E, Immunofluorescence staining and quantification of CD144 area (red) show no significant difference in endothelial cell junctions between control and Rgs5ΔPC hearts 8W after tamoxifen injection (n=3 and 5, respectively; P=0.57). F and G, Immunofluorescence staining and quantification of CD45+ cells (white) show no significant difference between control and Rgs5ΔPC hearts 8W after tamoxifen injection (n=3 and 4, respectively; P=0.86). H and I, Immunofluorescence staining and quantification of CD68+ cells (green) show no significant difference between control and Rgs5ΔPC hearts 8W after tamoxifen injection (n=3; P=0.7). B, C, E, G, and I, Data are shown as mean±SEM. P value is calculated using the Mann-Whitney U test. Every data point represents 1 independent mouse.
Figure 6.
Figure 6.
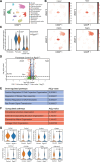
Single-nucleus sequencing confirmed fibroblast activation in Rgs5ΔPC hearts. A, Uniform manifold approximation and projection (UMAP) plot showing cell-type-specific clustering of all data points from cardiac single-nucleus sequencing. B, Feature plot showing gene expression of pericyte and fibroblast marker genes (Pdgfrb, Cspg4, Rgs5, and Pdgfra). The colored scale bar indicates the log-normalized gene expression level. C, Violin plot showing Rgs5 normalized gene expression values (unique molecular identifier; UMI) for the pericyte, fibroblast, and smooth muscle cell clusters. P value was calculated using the Wilcoxon rank-sum test. D, Volcano plot showing upregulated and downregulated genes in fibroblasts in control and Rgs5ΔPC hearts. E and F, Gene ontology (GO) enrichment analysis of significant downregulated and upregulated differentially expressed genes (DEGs) in fibroblasts in control and Rgs5ΔPC hearts. Represented pathways are the top 4 in the list. P values were calculated with the Fisher exact test and adjusted for multiple testing using Bonferroni correction assuming independent tests for all terms in the gene ontology database. G, Violin plot showing DEGs in fibroblasts between control and Rgs5ΔPC hearts. P value was calculated using the Wilcoxon rank-sum test. DMSO indicates dimethyl sulfoxide; HCF, human cardiac fibroblasts; hPC-PL, Human Placenta Pericytes; and U46619, a stable synthetic analog of the endoperoxide prostaglandin PGH2.
Figure 7.
Figure 7.
RGS5 knockdown induces a profibrotic phenotype in human pericytes. A and B, Gene ontology (GO) enrichment analysis of significant differentially expressed genes after bulk sequencing of RGS5 knockdown hPC-PL. Represented pathways are the top 4 in the list. P values were calculated with Fisher exact test and adjusted for multiple testing using Bonferroni correction assuming independent tests for all terms in the GO database. C, List of significant upregulated genes upon RGS5 knockdown from the bulk sequencing data set involved in fibrosis, ECM (extracellular matrix) deposition, and inflammation. Data are represented as mean±SEM. A through C, Data are representative of n=4 replicates from 3 different hPC-PL donors. D, Inositol-1-phosphate (IP1) production in hPC-PL after RGS5 knockdown. Every data point (n=6) represents independent transfections and different colors indicate 2 different hPC-PL lots. Data are represented as mean±SEM and P value is calculated using the Mann-Whitney U test. E and F, RT-qPCR analysis of TGFB2 and ACTA2 gene expression in hPC-PL after U46619 treatment. Every data point (n=5) represents an independent transfection. Data are represented as mean±SEM and P values are calculated using the Mann-Whitney U test. D through F, Values are shown as fold changes from siControl.
Figure 8.
Figure 8.
RGS5 (regulator of G-protein signaling 5)-deficient pericytes activate fibroblasts via TGFβ (transforming growth factor beta). A, Immunofluorescence staining of human cardiac fibroblasts showing an increase in αSMA+ (alpha smooth muscle actin)-activated fibroblasts treated with the supernatant from siRGS5 and siControl hPC-PL. B, Quantification of αSMA+ volume normalized to phalloidin. Data are represented as mean±SEM and P values are calculated using the Mann-Whitney U test. Every data point (n=4) represents an independent transfection. C, Immunofluorescence staining of HCF treated with RGS5-deficient pericyte supernatant in the presence of TGFβ 1, 2, 3 neutralizing antibody. Neutralizing antibody rescued HCF activation. D, Quantification of αSMA+ volume normalized to phalloidin cell area (siControl+IgG vs siControl+TGFβ 1, 2, 3; P>0.99; siRGS5+IgG vs siRGS5+TGFβ 1, 2, 3; P>0.99). Data are represented as mean±SEM and P values are calculated using the Kruskal-Wallis test. Every data point (n=12) represents independent transfections and different colors identify 3 different hPC-PL lots. HCF indicates human cardiac fibroblasts; and RT-qPCR, quantitative reverse transcription polymerase chain reaction.

Comment in

References

    1. Luxán G, Dimmeler S. The vasculature: a therapeutic target in heart failure? Cardiovasc Res. 2022;118:53–64. doi: 10.1093/cvr/cvab047 - PMC - PubMed
    1. Lakatta EG, Levy D. Arterial and cardiac aging: major shareholders in cardiovascular disease enterprises: part II: the aging heart in health: links to heart disease. Circulation. 2003;107:346–354. doi: 10.1161/01.cir.0000048893.62841.f7 - PubMed
    1. Hsieh PCH, Davis ME, Lisowski LK, Lee RT. Endothelial-cardiomyocyte interactions in cardiac development and repair. Annu Rev Physiol. 2006;68:51–66. doi: 10.1146/annurev.physiol.68.040104.124629 - PMC - PubMed
    1. Holm A, Heumann T, Augustin HG. Microvascular mural cell organotypic heterogeneity and functional plasticity. Trends Cell Biol. 2018;28:302–316. doi: 10.1016/j.tcb.2017.12.002 - PubMed
    1. Bergers G, Song S. The role of pericytes in blood-vessel formation and maintenance. Neurooncology. 2005;7:452–464. doi: 10.1215/S1152851705000232 - PMC - PubMed

Publication types