

Clinical Performance of Immunonephelometric Assay and Chemiluminescent Immunoassay for Detection of IgG Subclasses in Chinese
- PMID: 38563457
- PMCID: PMC11073813
- DOI: 10.1002/jcla.25033
Clinical Performance of Immunonephelometric Assay and Chemiluminescent Immunoassay for Detection of IgG Subclasses in Chinese
Abstract
Background: Detection of IgG subclasses (IgGSc) is vital for the diagnosis and management of disease, especially IgG4-related diseases (IgG4-RD). This study aimed to evaluate the performances of the chemiluminescent immunoassay (CLIA) for detecting IgGSc and diagnosing IgG4-RD by IgGSc.
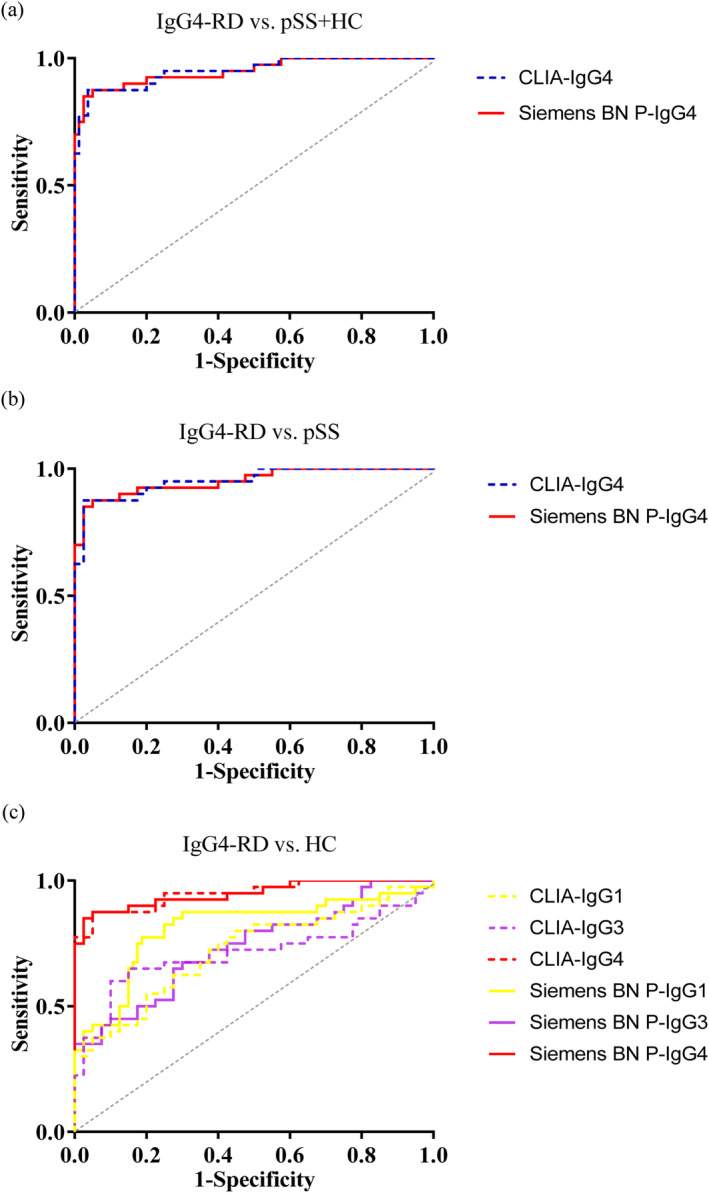
Methods: A total of 40 individuals with IgG4-RD, 40 with primary Sjogren's syndrome (pSS), and 40 healthy controls (HCs) were enrolled. Serum samples were collected for the simultaneous detection of IgG1, IgG2, IgG3, and IgG4 by the Siemens immunonephelometric assay and the CLIA. The correlation analysis was performed, and diagnostic value was analyzed by the receiver operating characteristic (ROC) curve.
Results: Patients with IgG4-RD had higher IgG4 (p < 0.001) and lower IgG1 (p < 0.001) than those with pSS, and HC. The results by the Siemens immunonephelometric assay and the CLIA showed a strong correlation in detecting IgG1, IgG2, IgG3, and IgG4 (r = 0.937, r = 0.847, r = 0.871, r = 0.990, all p < 0.001, respectively). The sum of IgG1, IgG2, IgG3, and IgG4 using two assays strongly correlated with total IgG by the IMMAGE 800 (r = 0.866, r = 0.811, both p < 0.001, respectively). For discriminating IgG4-RD from pSS and HC, no significant differences were observed in CLIA IgG4 and Siemens immunonephelometric assay IgG4 (z = 0.138, p = 0.891), which provided the area under the curves (AUCs) of 0.951 (p < 0.001) and 0.950 (p < 0.001), respectively. The AUCs of CLIA IgG1 and Siemens immunonephelometric assay IgG1 in distinguishing pSS from IgG4-RD and HC were 0.761 (p < 0.001) and 0.765 (p < 0.001), respectively, with no significant differences (z = 0.228, p = 0.820).
Conclusions: The CLIA and the Siemens immunonephelometric assay appeared to have good consistency with comparable diagnostic value in detecting IgGSc, especially IgG4, and IgG1 that can accurately identify IgG4-RD or pSS in clinical practice.
Keywords: IgG subclasses; IgG4‐related diseases; chemiluminescent immunoassay; immunonephelometric assay; primary Sjogren's syndrome.
© 2024 The Authors. Journal of Clinical Laboratory Analysis published by Wiley Periodicals LLC.
Conflict of interest statement
The authors declare no conflicts of interest.
Figures


Similar articles
-
Serum soluble interleukin-2 receptor is a useful biomarker for disease activity but not for differential diagnosis in IgG4-related disease and primary Sjögren's syndrome adults from a defined population.Clin Exp Rheumatol. 2018 May-Jun;36 Suppl 112(3):157-164. Epub 2018 Feb 15. Clin Exp Rheumatol. 2018. PMID: 29465360
-
Serum IgG subclasses in autoimmune diseases.Medicine (Baltimore). 2015 Jan;94(2):e387. doi: 10.1097/MD.0000000000000387. Medicine (Baltimore). 2015. PMID: 25590841 Free PMC article.
-
Immunoglobulin G4 in primary Sjögren's syndrome and IgG4-related disease - connections and dissimilarities.Front Immunol. 2024 Sep 19;15:1376723. doi: 10.3389/fimmu.2024.1376723. eCollection 2024. Front Immunol. 2024. PMID: 39364411 Free PMC article. Review.
-
Immune Profile Differences between IgG4-Related Diseases and Primary Sjögren's Syndrome.J Inflamm Res. 2025 Jan 21;18:911-923. doi: 10.2147/JIR.S471266. eCollection 2025. J Inflamm Res. 2025. PMID: 39871956 Free PMC article.
-
Pathogenesis of IgG4-related disease. Comparison with Sjögren's syndrome.Mod Rheumatol. 2020 Jan;30(1):7-16. doi: 10.1080/14397595.2019.1650694. Epub 2019 Aug 19. Mod Rheumatol. 2020. PMID: 31425659 Review.
Cited by
-
Risk factors for postoperative vascular crisis in squamous cell carcinoma reconstruction using supraclavicular artery flaps.Am J Cancer Res. 2025 Jun 25;15(6):2855-2871. doi: 10.62347/ZHMS1734. eCollection 2025. Am J Cancer Res. 2025. PMID: 40667552 Free PMC article.
References
MeSH terms
Substances
Grants and funding
- 2020-191/Research Project Supported by Shanxi Scholarship Council of China
- YDZJSX2022C031/Central Government Guides Local Science and Technology Development Fund
- 2020SYS08/Science and Technology Innovation Project of Shanxi Province
- 201901D111377/Nature Fund Projects of Shanxi Science and Technology Department
- 2019044/Scientific Research Project of Health commission of Shanxi Province
LinkOut - more resources
Full Text Sources
Miscellaneous
