. 2024 May 14;98(5):e0001624.
doi: 10.1128/jvi.00016-24. Epub 2024 Apr 2.

The Ca2+-dependent phosphatase calcineurin dephosphorylates TBK1 to suppress antiviral innate immunity

Affiliations

The Ca2+-dependent phosphatase calcineurin dephosphorylates TBK1 to suppress antiviral innate immunity

Yang Qu et al. J Virol. .

Abstract

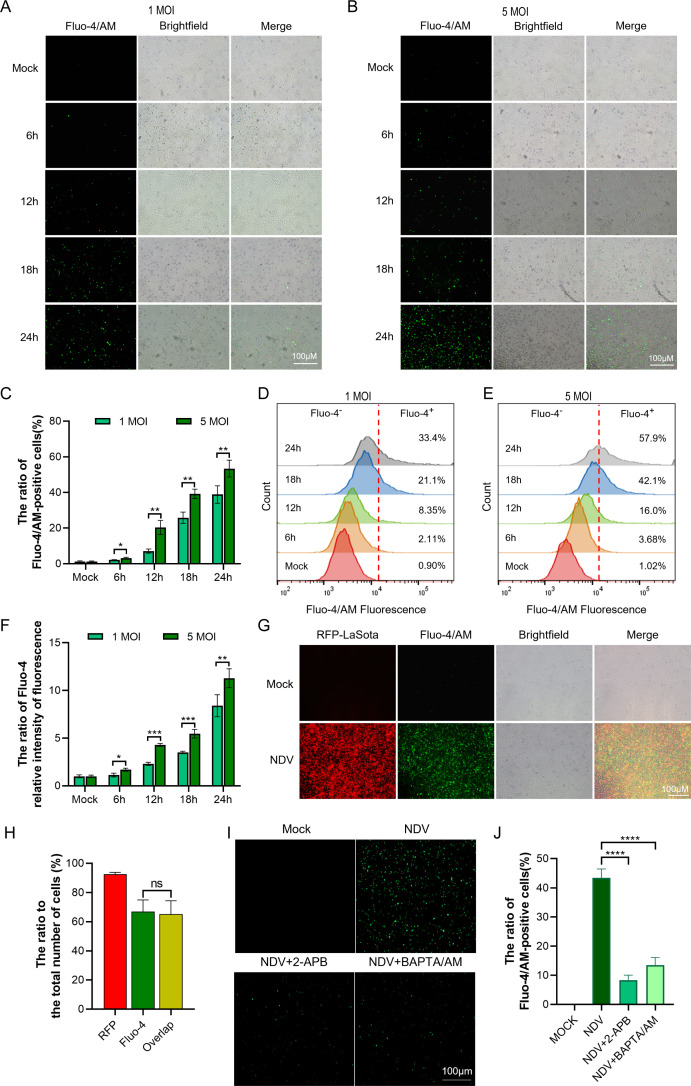
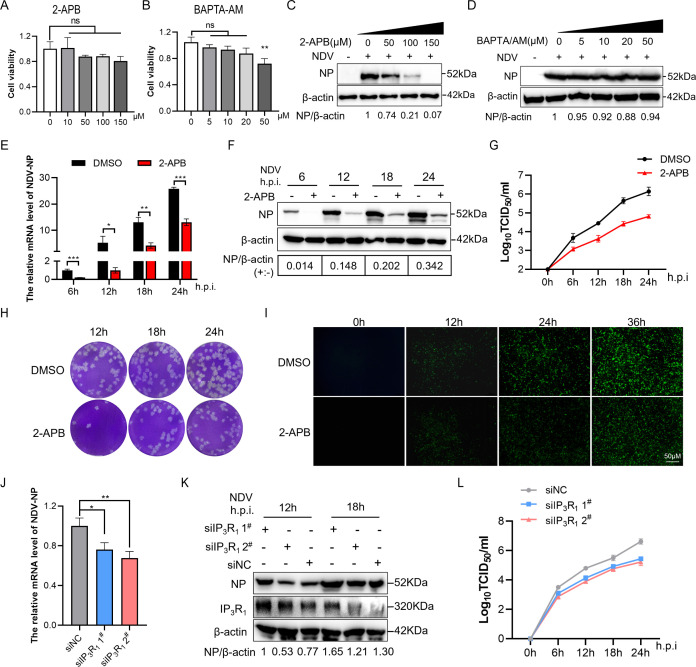
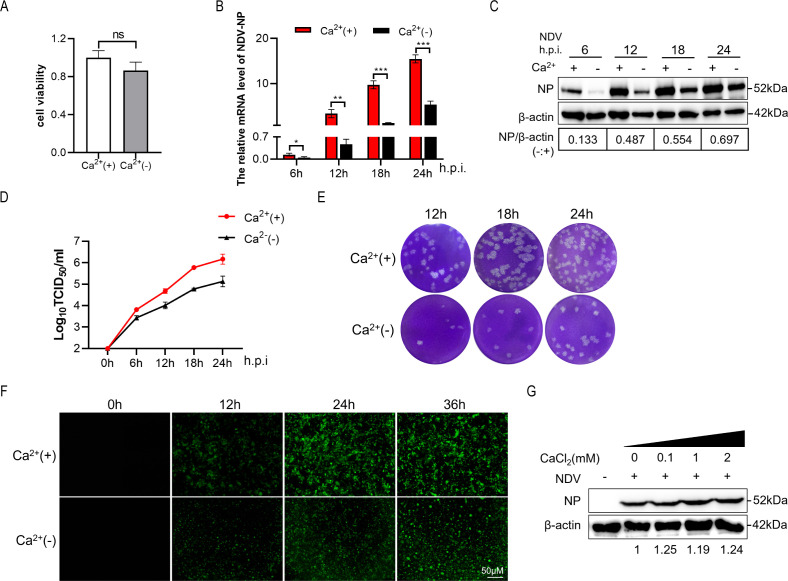
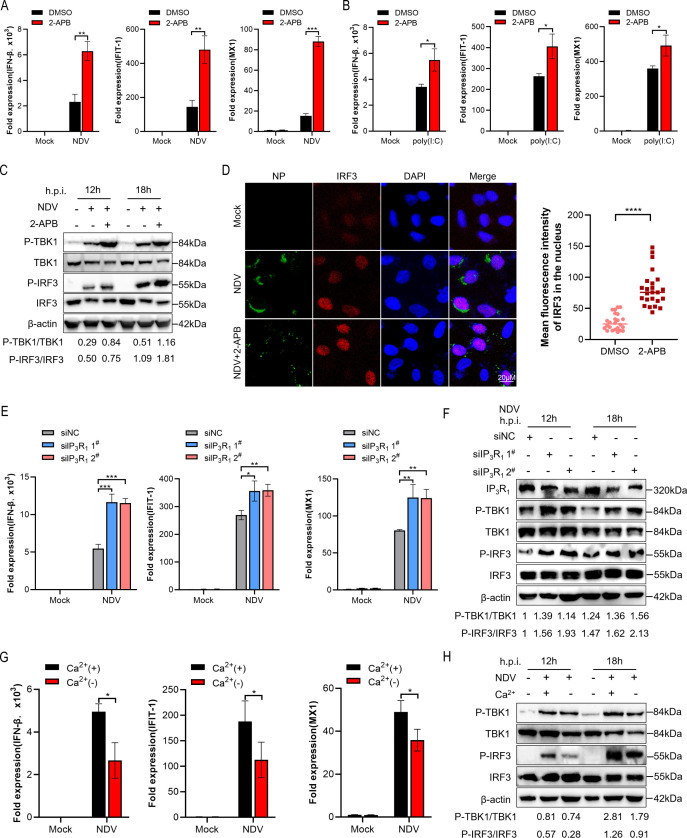
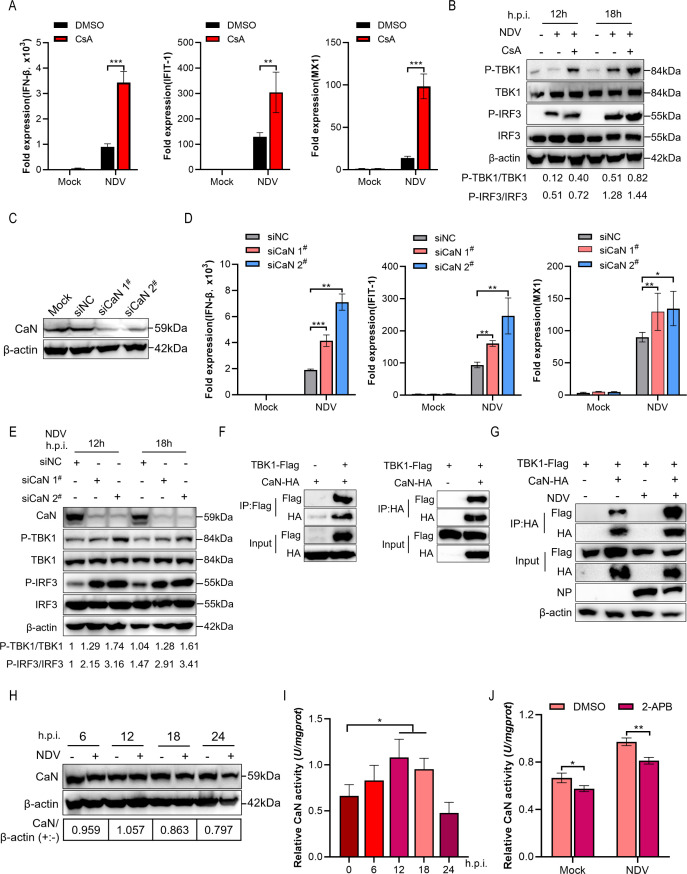
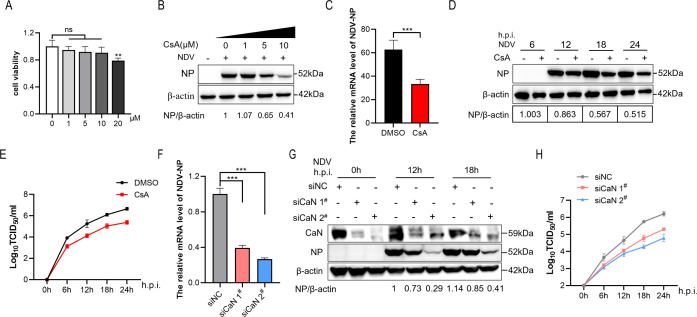
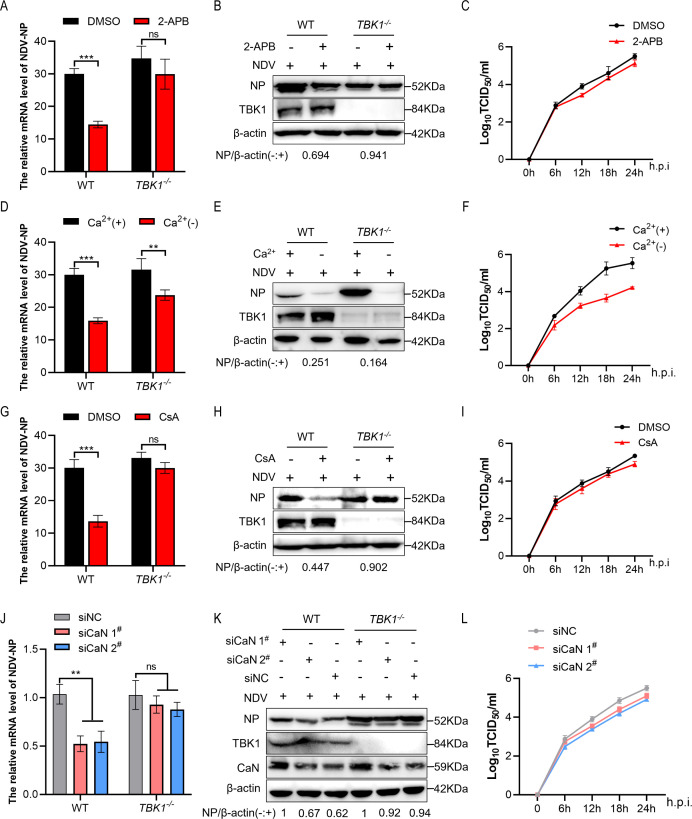
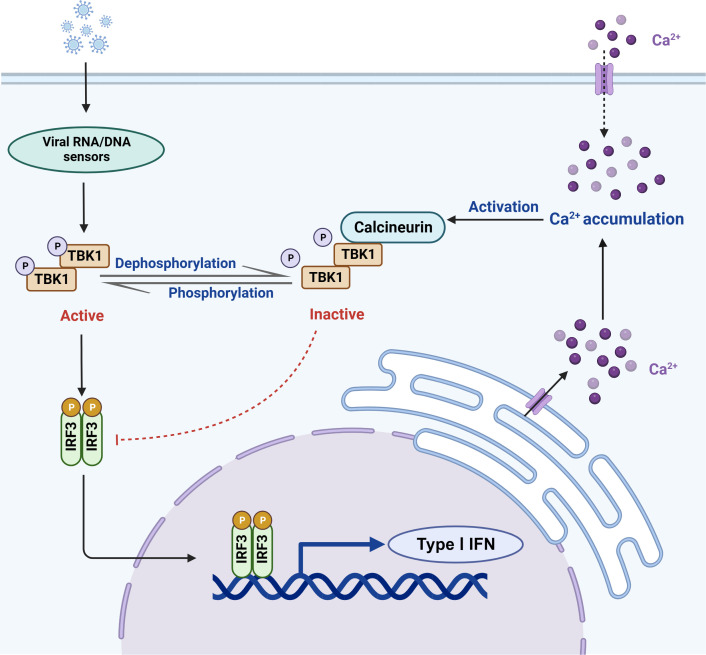
Tumor necrosis factor receptor-associated factor family member-associated NF-κB activator-binding kinase 1 (TBK1) plays a key role in the induction of the type 1 interferon (IFN-I) response, which is an important component of innate antiviral defense. Viruses target calcium (Ca2+) signaling networks, which participate in the regulation of the viral life cycle, as well as mediate the host antiviral response. Although many studies have focused on the role of Ca2+ signaling in the regulation of IFN-I, the relationship between Ca2+ and TBK1 in different infection models requires further elucidation. Here, we examined the effects of the Newcastle disease virus (NDV)-induced increase in intracellular Ca2+ levels on the suppression of host antiviral responses. We demonstrated that intracellular Ca2+ increased significantly during NDV infection, leading to impaired IFN-I production and antiviral immunity through the activation of calcineurin (CaN). Depletion of Ca²+ was found to lead to a significant increase in virus-induced IFN-I production resulting in the inhibition of viral replication. Mechanistically, the accumulation of Ca2+ in response to viral infection increases the phosphatase activity of CaN, which in turn dephosphorylates and inactivates TBK1 in a Ca2+-dependent manner. Furthermore, the inhibition of CaN on viral replication was counteracted in TBK1 knockout cells. Together, our data demonstrate that NDV hijacks Ca2+ signaling networks to negatively regulate innate immunity via the CaN-TBK1 signaling axis. Thus, our findings not only identify the mechanism by which viruses exploit Ca2+ signaling to evade the host antiviral response but also, more importantly, highlight the potential role of Ca2+ homeostasis in the viral innate immune response.IMPORTANCEViral infections disrupt intracellular Ca2+ homeostasis, which affects the regulation of various host processes to create conditions that are conducive for their own proliferation, including the host immune response. The mechanism by which viruses trigger TBK1 activation and IFN-I induction through viral pathogen-associated molecular patterns has been well defined. However, the effects of virus-mediated Ca2+ imbalance on the IFN-I pathway requires further elucidation, especially with respect to TBK1 activation. Herein, we report that NDV infection causes an increase in intracellular free Ca2+ that leads to activation of the serine/threonine phosphatase CaN, which subsequently dephosphorylates TBK1 and negatively regulates IFN-I production. Furthermore, depletion of Ca2+ or inhibition of CaN activity exerts antiviral effects by promoting the production of IFN-I and inhibiting viral replication. Thus, our results reveal the potential role of Ca2+ in the innate immune response to viruses and provide a theoretical reference for the treatment of viral infectious diseases.

Keywords: Ca2+; TBK1; antiviral immunity; calcineurin; virus infection.


Conflict of interest statement

The authors declare no conflict of interest.

Figures

Fig 1
Fig 1
NDV infection promotes intracellular Ca2+ accumulation. A549 cells were infected with NDV at an MOI of 1 or 5. Cells were harvested at 0, 6, 12, 18, and 24 h post-infection, then incubated with the fluorescent calcium indicator, Fluo-4/AM. (A and B) Ca2+ concentrations in the cytosol were visualized by fluorescence microscopy. (C) Quantification of the free Ca2+ levels in the cytosol by the number of positive fluorescent cells. (D and E) Fluorescence intensity was detected by flow cytometry. (F) Quantification of the free Ca2+ levels in the cytosol by fluorescence intensity. (G) Attenuated NDV strain RFP-LaSota-infected A549 cells for 24 h and then labeled with Fluo-4/AM for free Ca2+. (H) Quantification of overlapping red and green fluorescence. (I) A549 cells were treated with 2-APB (100 µM) and BAPTA-AM (20 µM), then infected with NDV for 18 h, and incubated with Fluo-4/AM. Ca2+ concentrations in the cytosol were visualized by fluorescence microscopy. (J) Quantitation of the free Ca2+ levels in the cytosol. Each bar represents the mean ± standard deviation. *P < 0.05, **P < 0.01, ***P < 0.001, ****P < 0.0001. MOI, multiplicity of infection; ns, not significant.
Fig 2
Fig 2
Inhibition of ER Ca2+ release inhibits viral proliferation. (A and B) A549 cells were spread on a 96-well plate for 24 h, and the effects of different inhibitor concentrations on cell viability were detected by CCK-8. (C) A549 cells were treated with 2-APB (0, 50, 100, and 150 µM), then infected with NDV at an MOI of 1. Cells were harvested at 18 h post-infection. Western blot analysis was used to assess NDV-NP protein expression levels. β-Actin acted as the loading control. (D) A549 cells were treated with BAPTA-AM (0, 5, 10, 20, and 50 µM), then infected with NDV at an MOI of 1. Cells were harvested at 18 h post-infection. Western blot analysis was used to assess NDV-NP expression levels. β-Actin acted as the loading control. (E–H) A549 cells were treated with or without 2-APB (100 µM), then mock treated or infected with NDV at an MOI of 1. Cells were harvested at 0, 6, 12, 18, and 24 h post-infection. The amounts of viral mRNA (E) and protein (F) were assessed in the cell lysates, while cell culture supernatants were subjected to the viral titer assay (G), and the virus yield was analyzed by plaque assays (H). (I) A549 cells were treated with or without 2-APB (100 µM) followed by infection with the attenuated NDV strain GFP-LaSota. Viral proliferation was visualized 0, 12, 24, and 36 h post-infection by fluorescence microscopy. (J–L) A549 cells were transfected with IP3R1 small interfering RNA for 48 h, then infected with NDV at an MOI of 1. At 12 h post-infection, cells were harvested, and quantitative real-time PCR was used to assess NDV-NP mRNA expression levels (J). At 12 or 18 h post-infection, NDV-NP expression levels were assessed by Western blotting (K). Cell culture supernatants were then subjected to the viral titer assay (L). Each bar represents the mean ± standard deviation. *P < 0.05, **P < 0.01, ***P < 0.001. DMSO, dimethyl sulfoxide; NDV-NP, Newcastle disease virus nucleoprotein; NP, nucleoprotein.
Fig 3
Fig 3
Depletion of extracellular Ca2+ suppresses viral proliferation. (A) Cells were cultured with Ca2+-free medium for 24 h, and then cell viability was measured by CCK-8. (B–E) A549 cells were cultured in normal medium or calcium-free medium followed by infection with NDV at an MOI of 1 for 0, 6, 12, 18, and 24 h. The amount of viral mRNA (B) and protein (C) was assessed in the cell lysates, while cell culture supernatants were subjected to the viral titer assay (D), and the virus yield was analyzed by plaque assays (E). (F) Attenuated NDV strain GFP-LaSota-infected A549 cells were cultured in normal or calcium-free medium. Viral proliferation was visualized by fluorescence microscopy. (G) A549 cells were treated with CaCl2 (0, 0.1, 1.0, and 2.0 mM), then infected with NDV for 18 h. Western blot analysis was used to examine the expression levels of NDV-NP. β-Actin acted as the loading control. Each bar represents the mean ± standard deviation. *P < 0.05, **P < 0.01, ***P < 0.001.
Fig 4
Fig 4
Inhibition of ER Ca2+ release promotes activation of the IFN-β signaling pathway. (A) A549 cells were treated with or without 2-APB (100 µM), then mock treated or infected with NDV at an MOI of 1. At 12 h post-infection, cells were harvested, and qRT-PCR was used to assess IFN-β, IFIT-1, and MX1 mRNA expression levels. (B) A549 cells were treated with or without 2-APB (100 µM), then mock treated or transfected with poly(I:C) (20 mg/mL). Cells were harvested after 12 h, and qRT-PCR was used to examine IFN-β, IFIT-1, and MX1 mRNA expression levels. (C) Virus infection experiments were performed as described above for panel A. Cells were harvested at 12 and 18 h post-infection, and P-TBK1, TBK1, P-IRF3, and IRF3 protein expression levels were assessed by Western blot analysis. β-Actin acted as the loading control. (D) Virus infection experiments were performed as described above for panel A. At 18 h post-infection, cells were fixed and immunofluorescence staining was carried out using antibodies against IRF3 and NDV-NP. Nuclei were stained with 1-mg/mL 4′,6-diamidino-2-phenylindole (DAPI). (E and F) A549 cells were transfected with IP3R1 siRNA for 48 h, then infected with NDV at an MOI of 1. At 12 h post-infection, cells were harvested, and qRT-PCR was used to examine IFN-β, IFIT-1, and MX1 mRNA expression levels (E). At 12 or 18 h post-infection, P-TBK1, TBK1, P-IRF3, and IRF3 protein expression levels were assessed by Western blot analysis (F). (G) A549 cells were cultured in normal medium or calcium-free medium, then mock treated or infected with NDV at an MOI of 1. At 12 h post-infection, cells were harvested, and qRT-PCR was used to detect IFN-β, IFIT-1, and MX1 mRNA expression levels. (H) Virus infection experiments were performed as described above for panel G. Cells were harvested at 12 and 18 h post-infection, and P-TBK1, TBK1, P-IRF3, and IRF3 protein expression levels were measured by Western blotting. β-Actin acted as the loading control. Each bar represents the mean ± standard deviation. *P < 0.05, **P < 0.01, ***P < 0.001, ****P < 0.0001. qRT-PCR, quantitative real-time PCR.
Fig 5
Fig 5
Calcineurin negatively regulates IFN-I signaling. (A) A549 cells were treated with or without CsA (10 µM), then mock treated or infected with NDV at an MOI of 1. At 12 h post-infection, cells were harvested, and qRT-PCR was used to detect IFN-β, IFIT-1, and MX1 mRNA expression levels. (B) Virus infection experiments were performed as described above for panel A. Cells were harvested at 12 and 18 h post-infection, and Western blot analysis was carried out to assess P-TBK1, TBK1, P-IRF3, and IRF3 protein expression levels. β-Actin acted as the loading control. (C) Cells were transfected with siRNA targeting CaN. Western blot analysis was used to determine the knockdown level of CaN. (D) A549 cells were transfected with CaN siRNA for 48 h, then infected with NDV at an MOI of 1. At 12 h post-infection, cells were harvested, and qRT-PCR was used to assess IFN-β , IFIT-1, and MX1 mRNA expression levels. (E) Virus infection experiments were performed as described above for panel D. Cells were harvested at 12 and 18 h post-infection, and Western blot analysis was used to detect P-TBK1, TBK1, P-IRF3, and IRF3 protein expression levels. β-Actin acted as the loading control. (F) HEK-293T cells were transfected with plasmids encoding Flag-TBK1 and HA-CaN for 24 h. Then, the supernatants of the cell lysates were immunoprecipitated using anti-Flag or anti-HA beads and immunoblotted with anti-HA or anti-Flag. (G) HEK-293T cells transfected with Flag-TBK1 and HA-CaN for 24 h were infected with NDV at an MOI of 1. Cells were harvested at 12 h post-infection, and the supernatants of the cell lysates were immunoprecipitated using anti-HA beads, then immunoblotted with anti-HA or anti-Flag. (H and I) A549 cells were infected with NDV at an MOI of 1. Cells were harvested at 0, 6, 12, 18, and 24 h post-infection, and Western blot analysis was carried out to determine CaN protein expression levels. β-Actin acted as the loading control (H). CaN activity was detected by spectrophotometry (I). (J) A549 cells were treated with or without 2-APB (100 µM), then mock treated or infected with NDV at an MOI of 1. At 18 h post-infection, cells were harvested and CaN activity was detected by spectrophotometry. Each bar represents the mean ± standard deviation. *P < 0.05, **P < 0.01, ***P < 0.001.
Fig 6
Fig 6
Inhibition of calcineurin activity inhibits virus replication. (A) A549 cells were spread on a 96-well plate for 24 h, and the effects of CsA on cell viability were detected by CCK-8. (B) A549 cells were treated with CsA (0, 1, 5, and 10 µM), then infected with NDV at an MOI of 1. Cells were harvested at 18 h post-infection, and NDV-NP expression levels were detected by Western blot analysis. β-Actin acted as the loading control. (C) A549 cells were treated with or without CsA (10 µM), then mock treated or infected with NDV at an MOI of 1. At 12 h post-infection, cells were harvested, and qRT-PCR was used to detect NDV-NP mRNA expression levels. (D and E) A549 cells were treated with or without CsA (10 µM) followed by infection with NDV (MOI of 1) for 0, 6, 12, 18, and 24 h. The amount of viral protein was quantified in the cell lysates (D), while cell culture supernatants were subjected to the viral titer assay (E). (F–H) A549 cells were transfected with CaN siRNA for 48 h, then infected with NDV at an MOI of 1. At 12 h post-infection, cells were harvested, and qRT-PCR was used to assess NDV-NP mRNA expression levels (F). At 12 or 18 h post-infection, NDV-NP expression levels were assessed by Western blotting (G). Cell culture supernatants were subjected to the viral titer assay (H). Each bar represents the mean ± standard deviation.**P < 0.01, ***P < 0.001.
Fig 7
Fig 7
Knockout of TBK1 inhibits the effect of Ca2+ and CaN on viral proliferation. (A–C) A549 cells were treated with or without 2-APB (100 µM), then mock treated or infected with NDV at an MOI of 1. The amounts of viral mRNA (A) and protein (B) and the viral titer assay (C). (D–F) A549 cells were cultured in normal medium or calcium-free medium followed by infection with NDV. The amounts of viral mRNA (D) and protein (E) and the viral titer assay (F). (G–I) A549 cells were treated with or without CsA (10 µM), then mock treated or infected with NDV at an MOI of 1. Cells were harvested, and qRT-PCR was used to detect NDV-NP mRNA expression levels. (G) The amount of viral mRNA and (H) protein and (I) the viral titer assay. (J–L) A549 cells were transfected with CaN siRNA for 48 h, then infected with NDV at an MOI of 1. (J) The amount of viral mRNA and (K) protein and (L) the viral titer assay. Each bar represents the mean ± standard deviation. ns >0.05, **P < 0.01, ***P < 0.001.
Fig 8
Fig 8
Model showing the negative regulation of IFN-I by the Ca2+-calcineurin-TBK1 signaling pathway. NDV infection leads to the imbalance of intracellular Ca2+ homeostasis by inducing the accumulation of intracellular free Ca2+, especially the release of Ca2+ from the ER, which promotes activation of CaN resulting in the dephosphorylation of TBK1 and inhibition of IFN-I, and finally replication of NDV.

Similar articles

References

    1. Bowie AG, Unterholzner L. 2008. Viral evasion and subversion of pattern-recognition receptor signalling. Nat Rev Immunol 8:911–922. doi:10.1038/nri2436 - DOI - PMC - PubMed
    1. Fitzgerald KA, McWhirter SM, Faia KL, Rowe DC, Latz E, Golenbock DT, Coyle AJ, Liao SM, Maniatis T. 2003. IKKε and TBK1 are essential components of the IRF3 signaling pathway. Nat Immunol 4:491–496. doi:10.1038/ni921 - DOI - PubMed
    1. Friedman CS, O’Donnell MA, Legarda-Addison D, Ng A, Cárdenas WB, Yount JS, Moran TM, Basler CF, Komuro A, Horvath CM, Xavier R, Ting AT. 2008. The tumour suppressor CYLD is a negative regulator of RIG-I-mediated antiviral response. EMBO Rep. 9:930–936. doi:10.1038/embor.2008.136 - DOI - PMC - PubMed
    1. Lei CQ, Zhong B, Zhang Y, Zhang J, Wang S, Shu HB. 2010. Glycogen synthase kinase 3Β regulates Irf3 transcription factor-mediated antiviral response via activation of the kinase Tbk1. Immunity 33:878–889. doi:10.1016/j.immuni.2010.11.021 - DOI - PubMed
    1. Renner F, Saul VV, Pagenstecher A, Wittwer T, Schmitz ML. 2011. Inducible SUMO modification of TANK Alleviates its repression of Tlr7 signalling. EMBO Rep 12:129–135. doi:10.1038/embor.2010.207 - DOI - PMC - PubMed

LinkOut - more resources