. 2024 Jun 3;221(6):e20231348.
doi: 10.1084/jem.20231348. Epub 2024 Apr 2.

NF-κB subunits RelA and c-Rel selectively control CD4+ T cell function in multiple sclerosis and cancer

Affiliations

NF-κB subunits RelA and c-Rel selectively control CD4+ T cell function in multiple sclerosis and cancer

Guilhem Lalle et al. J Exp Med. .

Abstract

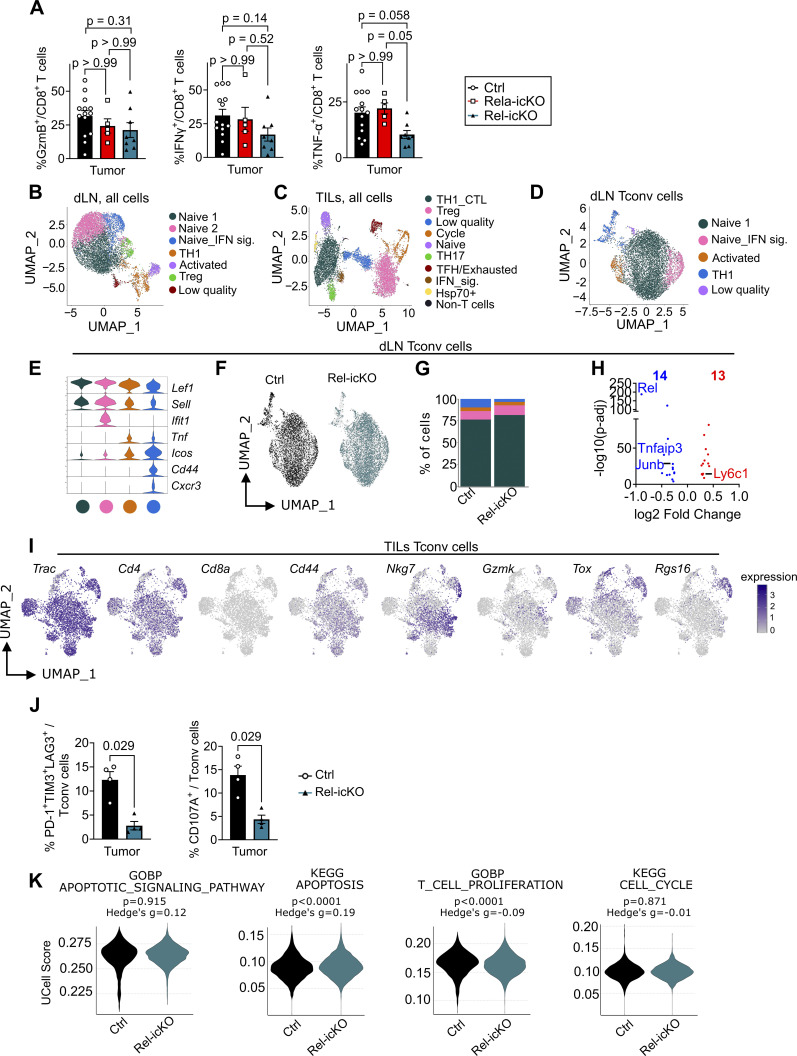
The outcome of cancer and autoimmunity is often dictated by the effector functions of CD4+ conventional T cells (Tconv). Although activation of the NF-κB signaling pathway has long been implicated in Tconv biology, the cell-autonomous roles of the separate NF-κB transcription-factor subunits are unknown. Here, we dissected the contributions of the canonical NF-κB subunits RelA and c-Rel to Tconv function. RelA, rather than c-Rel, regulated Tconv activation and cytokine production at steady-state and was required for polarization toward the TH17 lineage in vitro. Accordingly, RelA-deficient mice were fully protected against neuroinflammation in a model of multiple sclerosis due to defective transition to a pathogenic TH17 gene-expression program. Conversely, Tconv-restricted ablation of c-Rel impaired their function in the microenvironment of transplanted tumors, resulting in enhanced cancer burden. Moreover, Tconv required c-Rel for the response to PD-1-blockade therapy. Our data reveal distinct roles for canonical NF-κB subunits in different disease contexts, paving the way for subunit-targeted immunotherapies.


Conflict of interest statement

Disclosures: P. Cassier reported “other” from Abbvie, Amgen, Alligator, Blueprint, Boehringer Ingelheim, Daiichi Sankyo, Astrazeneca, C4 Therapeutics, Exelixis, Molecular Partners, Pierre Fabre, Relay, Sotio, Tango, GSK, Merck Sharp Dohme, Lilly/Loxo, Novartis, Roche/Genentech, Taiho, Transgene, and Toray; personal fees from BMS, OSE, and Brenus; and non-financial support from Debio outside the submitted work. R. Liblau reported personal fees from Novartis, Biogen, Sanofi-genzyme, and Vida Venture; non-financial support from Novo Nordisk; and grants from Roche, Population Bio, and BMS outside the submitted work. No other disclosures were reported.

Figures

None
Graphical abstract
Figure S1.
Figure S1.
The role of RelA and c-Rel in Tconv at steady-state. (A–F) Thymus, spleen, and peripheral LN from control (CD4cre), Rela-cKO, and Rel-cKO mice were analyzed by flow cytometry (mean ± SEM of 3–9 mice/group from two experiments). (A–C) Analysis of the thymus. (A) Number of total live cells. (B) Proportions and absolute numbers of double negative (DN), double positive (DP), and simple positive (SP) CD4+ and CD8+ T cells. (C) Quantification of live Tregs. (D–H) Analysis of spleens and peripheral LNs. (D) Number of total live cells. (E) Proportions and absolute numbers of Tconv and CD8+ T cells among total live cells. (F) Quantification of live Tregs. (G and H) Analysis of mixed BM chimeras as in Fig. 1, by flow cytometry (mean ± SEM of n = 10 mice/group from two experiments). (G) Proportion of FoxP3+ Treg among CD45.2+ CD4+ cells in secondary lymphoid organs. (H) Proportion of naive (CD44CD62L+) TCM (T central memory) (CD44+CD62L+) and TEM (CD44+CD62L) among CD45.2+ Tconv in spleen. (I–L) Analysis of RNA-seq data from Fig. 1 (n = 4 independent samples/genotype [2 mice/sample] from two experiments sequenced simultaneously). (I) Correspondence analysis of mRNA counts of all the genes of WT (blue points), Rel-cKO (orange squares), and RelA-KO (pink triangles) murine CD4+ Tconv before differential expression analysis. (J) GSEA plot from Rela-cKO dataset showing decreased expression of known NF-κB–dependent genes. (K) Strategy for the identification of indirect transcriptional regulators. (L) Expression of the 34 master regulator candidates. lFC, log2 fold change; MR analysis, master regulator analysis.
Figure 1.
Figure 1.
Mouse Tconv homeostasis and transcriptome are predominantly controlled by NF-κB RelA. (A) Schematic representation of the experimental mixed BM chimera model used (control = CD4cre). (B–D) Spleen cells were analyzed by flow cytometry (mean ± SEM of n = 3–10 mice/group from two experiments). (B) Proportion of T cells that are of CD45.2 origin. (C) Proportion of CD44high and Ki67+ in CD45.2+TCRβ+CD4+CD8Foxp3 Tconv. (D) Spleen cells were restimulated with PMA-ionomycin; proportions of cytokine expression by CD45.2+ Tconv are shown. (E–H) RNA-seq analysis of CD45.2+ Tconv sorted from spleen and LN and stimulated for 4 h with anti-CD3/CD28 and IL-2 (n = 4 independent samples/genotype [two mice/sample] from two experiments sequenced simultaneously). (E) Volcano plot of DEGs (log2 fold change >0.58, P < 0.005). Bold numbers denote the numbers of downregulated (blue) and upregulated (red) genes. (F) Venn partition diagram showing the overlap between RelA and c-Rel–regulated DEGs. (G) Heatmaps of selected DEGs. (H) KEGG enrichment analysis of Rela-cKO DEGs. (I and J) RelA DNA-binding analysis in WT Tconv (Oh et al., 2017) stimulated or not with anti-CD3/CD28 for 4 h. (I) Heatmap of DEGs directly (in blue) and indirectly (in yellow) bound by RelA. (J) Visualization of RelA binding in selected loci using Integrative Genome Viewer. (K) BATF and c-Jun binding on DEGs not directly bound by RelA. Our RNA-seq and ChIP-Seq data were compared to publicly available ChIP-Seq data of BATF and c-Jun. The heatmap represents DEG in Rela-cKO cells that might be regulated by these proteins. For FACS data, Kruskal–Wallis tests were used.
Figure 2.
Figure 2.
Separate roles of RELA and c-REL in human Tconv. (A) Experimental protocol; created with https://Biorender.com. (B) Western blot validation of gene editing efficacy after ATTO550+ live cell sorting (one representative of four experiments). (C and D) RNA-seq analysis following a 4 h stimulation with anti-CD3/CD28 and IL-2 (n = 4 experiments with one donor/experiment, sequenced simultaneously). (C) Volcano plot of DEGs (log2 fold change >0.58, P < 0.005). Bold numbers denote the number of downregulated (blue) and upregulated (red) genes. (D) Heatmaps of selected DEGs. (E–G) Gene-edited Tconv were sorted and rested for 2 days and then labeled with Cell Trace Violet (CTV) and stimulated 3 days with anti-CD3/CD28 and IL-2. Cells were analyzed by FACS after PMA-ionomycin restimulation. (E) Gating strategy for Tconv cell analysis. (F) Representative CTV (top, gray histograms denote unstained controls) and cytokine (bottom) staining (one representative of three experiments). (G) Cumulative data from n = 3–4 experiments with independent donors. Multiple paired T tests were used. Source data are available for this figure: SourceData F2.
Figure S2.
Figure S2.
RNA-seq analysis of human gene-edited Tconv. n = 4 experiments with independent donors, sequenced simultaneously. (A) Venn partition diagram showing the overlap between RelA and c-Rel–regulated DEGs. (log2 fold change >0.58, P < 0.005). (B) KEGG enrichment analysis of RELA-KO DEGs. (C) Expression of the 378 human RELA-KO DEGs in the mouse dataset. (D) KEGG enrichment analysis of the 80 common downregulated genes in mouse and human RELA-KO Tconv.
Figure S3.
Figure S3.
RelA and c-Rel in TH differentiation and pathogenicity in EAE. (A–E) Naive Tconv from control (CD4cre), Rela-cKO, and Rel-cKO mice were isolated, stimulated with medium or low concentrations of soluble anti-CD3 and feeders, and cultured with or without IL-2 (B), or under Th1 (C), Th2 (D), or Th17 (E) for 4 days as detailed in Materials and methods, and their phenotype was analyzed by FACS after PMA-ionomycin restimulation. (A) Gating strategy for Tconv analysis. (B–E) Cumulative data from at least three experiments are shown. Each line represents an independent experiment; multiple paired t-tests were used. (F) Data from RelA ChIP-Seq in Tconv, from Oh et al. (2017), were visualized using Integrative Genome Viewer. (G) Naive Tconv were isolated and cultured as above for 24 h. The proportion of CD44hi cells was assessed by FACS. Mean ± SEM from three to four experiments are shown; each dot represents an individual experiment. Multiple Mann–Whitney tests were used; ns = non-significant. (H–M) EAE was induced in control (CD4cre), Rela-cKO, and Rel-cKO mice. (H) Representative Fluoromyelin staining in the spinal cord, showing delimitation of the dorsal horn, used for statistical quantification in Fig. 4. (I–L) At D21, MHC-II expression was measured by FACS in myeloid cells (mean ± SEM of n = 4–9 mice/group from two experiments). (I) CD45intCD11b+ microglia cells, (J) CD45highTCRβCD11c+F4/80 dendritic cells, (K) CD45highTCRβCD11b+F4/80Ly6C+Ly6G monocytes, and (L) CD45highTCRβ-CD11b+F4/80+ macrophages. Mean ± SEM are shown; each dot represents an individual mouse from two independent experiments. (M) Sections of spinal cords at D15, stained for Iba-1. Representative images (left) and cumulative proportion of Iba-1+ areas of 35 to 59 cross-sections from four to five mice/group of two independent experiments (right) are shown as box and whiskers plot (min to max). Kruskal–Wallis (I–L) and one-way ANOVA test (M) were used.
Figure 3.
Figure 3.
The roles of RelA and c-Rel in TH polarization in vitro. (A–E) Naive Tconv from control (CD4cre), Rela-cKO, and Rel-cKO mice were isolated, stimulated with high concentration of soluble anti-CD3 and feeders, and cultured with or without IL-2 (A), or under Th1 (B), Th2 (C), or Th17 (D) for 4 days as detailed in Materials and methods, and their phenotype was analyzed by FACS after PMA-ionomycin restimulation. Representative (left panels) and cumulative (right) data from at least three experiments are shown. Each line represents an independent experiment; multiple paired t tests were used.
Figure 4.
Figure 4.
T cell–restricted ablation of RelA, but not c-Rel, protects against EAE. EAE was induced in control (CD4cre), Rela-cKO, and Rel-cKO mice in a specific and opportunistic pathogen–free animal facility (CRCL, Lyon, France). (A) Disease score curves (n = 14–28 mice/group from five independent experiments). (B) Disease incidence. (C) Maximal clinical score. (D) Sections of spinal cords at D15 were stained with Luxol Fast Blue; representative images from four to five mice/genotypes of two independent experiments are shown. The dotted line underlines the border between demyelinated area of the tissue and normal white matter (homogenous blue staining). Most of the time, the demyelinated area juxtaposed immune cells infiltration revealed by the counterstaining with nuclear red. Scale bars = 200 µm. (E and F) Sections of spinal cords at D15 were stained for Fluoromyelin and DAPI. Representative images (E) and proportion of myelin loss in the dorsal horn from 35 to 59 cross-sections, from four to five mice/genotype of two independent experiments (F) are shown; scale bars = 250 µm (left) and 100 µm (right). Arrowheads point to demyelinated areas of the dorsal horn. In A, C, and E, mean ± SEM are shown. Two-way ANOVA followed by Bonferroni’s post-test (A), Log-rank (Mantel–Cox) (B), and Kruskal–Wallis tests (C and F) were used.
Figure 5.
Figure 5.
RelA is required for Tconv pathogenic function in EAE. EAE was induced in control (CD4cre), Rela-cKO, and Rel-cKO mice in a specific and opportunistic pathogen–free animal facility (CRCL, Lyon, France). (A) Enumeration of CD45+TCR-β+CD4+Foxp3CD8 cells at D15 in dLN, brain, and spinal cord (S.C.) (mean ± SEM of 6–18 mice/group from three independent experiments). (B–J) CD4+ T cells were sorted from the CNS at D15 and analyzed by scRNA-seq (performed once with 5–6 pooled mice/genotype). (B) Uniform Manifold Approximation and Projection (UMAP) representation and identification of Seurat clusters. (C) Violin plot showing expression of selected cluster-defining genes. (D) Cell distribution between genotypes (top) and expression of selected markers projected on UMAP (bottom). (E) Distribution of the eight clusters in each genotype. (F) Volcano plot representation of DEGs (blue: downregulated, red: upregulated, P-adj cutoff <0.05). (G) Number of DEGs in each cluster. (H) Venn diagram showing overlap of DEGs. (I and J) Percentage and intensity of expression of selected genes in all Tconv (I) and in the TH17p cluster specifically (J). (K–N) CNS-infiltrating Tconv were analyzed by FACS 20 days after disease induction, directly ex vivo (K and L) or after PMA-ionomycin restimulation (M and N) (data are representative of, or show the mean ± SEM of 4–15 mice/group from three independent experiments). Kruskal–Wallis tests were used.
Figure S4.
Figure S4.
The role of RelA and c-Rel in Tconv during EAE. EAE was induced in control (CD4cre), Rela-cKO, and Rel-cKO mice. (A–G) dLN and CNS-sorted CD4+ T cells were analyzed by scRNA-seq as in Fig. 5 (performed once with five to six pooled mice/genotype). (A) UMAP projection of total CD4+ T cells in each dLN. (B) UMAP projection of total CD4+ T cells in each dLN. (C) UMAP projection and Seurat clustering of dLN-Tconv upon removal of Treg cells. (D) Violin plot showing expression of selected cluster-defining markers in dLN. (E) Distribution of the eight clusters in each genotype in dLN. (F) Volcano plot representation of DEGs in dLN (blue: downregulated, red: upregulated, p-adj cutoff <0.05). (G) Expression of selected markers projected on UMAP. (H) FACS analysis of the proportion of exhausted (left) and EOMES+ cytotoxic (right) Tconv cells in the brain at D20 (mean ± SEM of n = 6–8 mice/group from two experiments). (I) Enrichment of the indicated signatures in CNS-infiltrating Tconv scRNA-seq data. (J) Proportion of apoptotic Annexin V+ Tconv cells in the brain at D10 and D20 (mean ± SEM of two experiments; each dot represents a mouse). (K) dLN Tconv were analyzed by FACS 20 days after disease induction, after PMA-ionomycin restimulation (mean ± SEM of 8–15 mice/group from three independent experiments). (L) EAE was induced in control and CD8creRelaF/F mice; clinical scores are shown as mean ± SEM of one experiment with 4–10 mice/group. (M and N) Tamoxifen was administered to control (CD4cre-ert2) and Rela-icKO mice as in Fig. 6 C. (M) Mean ± SEM of GFP+ in Tconv cells at the indicated time points (n = 3–4/time point, two experiments). (N) Mean ± SEM of GFP+ cells in Tconv and Treg cells at D20 following tamoxifen administration from D7 to D13 points (n = 4 mice, two experiments). Mann–Whitney (H, J, and N) Wilcoxon and Hedge’s G (I), Kruskal–Wallis (K), and two-way ANOVA followed by Bonferroni’s post-test (L) analyses were used.
Figure 6.
Figure 6.
RelA controls the priming phase but not the progression of EAE. (A and B) EAE was induced in control (CD4cre), Rela-cKO, and Rel-cKO mice. (A) Proportion of MOG33-55-specific cells among Tconv (left) and their proportion of CD62LCD44+ in dLN over time (right). Mean ± SEM of 3–10 mice/group/time point from two experiments are shown. (B) dLN cells were restimulated for 24 h with the MOG33-55 peptide and their expression of IL-17A and GM-CSF was assessed by FACS. Representative dot plots (left) and mean ± SEM of 3–10 mice/group/time point from two experiments are shown. (C) EAE was induced in control (CD4cre-ert2) and Rela-icKO mice treated with tamoxifen from D−18 to D−12 (left, gray box) or from D7 to D13 (right). Clinical scores are shown (7–13 mice/group from n = 2 [left] or 3 [right] experiments). Mann–Whitney tests (A and B) and two-way ANOVA followed by Bonferroni’s post-test (C) were used.
Figure 7.
Figure 7.
c-Rel orchestrates Tconv function in the tumor microenvironment. (A–M) Ctrl (CD4cre-ert2), Rela-icKO, and Rel-icKO mice were treated with tamoxifen from D−1 to D7 (gray box) and transplanted with B16-OVA melanoma cells. (A) Tumor volume over time (n = 7–21 mice/group from four experiments). (B) Tumor weight at D19. (C–G) FACS analysis at D19 in dLN (C–E) and tumors (C, F, and G) without (C, D, and F) or with (E and G) PMA-ionomycin restimulation. The proportion of CD45+TCRβ+CD4+CD8Foxp3 Tconv among total live cells and their expression of indicated markers are shown as mean ± SEM of 5–14 mice/group from three experiments. (H–M) CD4+ T cells were sorted from the tumor at D15 and analyzed by scRNA-seq (performed once with 6–7 pooled mice/genotype). (H) UMAP representation of Seurat clusters. (I) Violin plot showing expression of selected cluster-defining genes. (J) Cell distribution between genotypes, and expression of selected markers projected on UMAP. (K) Distribution of the eight clusters in each genotype. (L) Volcano plot representation of DEGs (blue: downregulated, red: upregulated, P-adj cutoff <0.05). (M) Percentage and intensity of expression of selected genes in all Tconv. (N–P) Rag2−/− mice were reconstituted with Tconv, Treg, B cells, with (N and O) or without (P) CD8+ T cells, and transplanted with MC-38 cells. (N) Tumor growth (left) and weight at D19 (n = 9 mice/group from two experiments). (O) FACS analysis at D19 in dLN and tumors are shown as mean ± SEM of 6–9 mice/group from two experiments. (P) Tumor growth (left) and weight at D19 (n = 8 mice/group from two experiments). Two-way ANOVA followed by Bonferroni’s post-test (A, N, and P), Kruskal–Wallis tests (B–G), and Mann–Whitney tests (O) were used.
Figure S5.
Figure S5.
The role of c-Rel in Tconv during tumor immunity. Control (CD4cre-ert2), Rela-icKO, and Rel-icKO mice were treated with tamoxifen from D1 to D7 and transplanted with B16-OVA melanoma cells as in Fig. 6. (A) FACS analysis of tumor-infiltrating CD8+ T cells as D19 following PMA-ionomycin stimulation. Data are shown as mean ± SEM of 5–14 mice/group from two experiments; Kruskal–Wallis tests were used. (B–J) scRNA-seq analysis of dLN and tumor CD4+ T cells (performed once with six to seven pooled mice/genotype). (B and C) UMAP projection of total CD4+ T cells in each tissue. (D) UMAP projection and Seurat clustering of dLN Tconv upon removal of Treg cells. (E) Violin plots showing expression of selected cluster-defining markers in dLN. (F) Global distribution of Ctrl and Rel-deficient dLN Tconv on UMAP. (G) Distribution of the four clusters in each genotype in dLN. (H) Volcano plot representation of DEGs in dLN (blue: downregulated, red: upregulated, p-adj cutoff <0.05). (I) Expression of selected markers projected on UMAP. (J) FACS analysis of the proportion of exhausted (left) and CD107A+ cytotoxic (right) Tconv cells in tumors at D19 (mean ± SEM of four mice/group from two experiments). (K) Expression of different GSEA signatures related to apoptosis and proliferation in tumor-infiltrating Tconv scRNA-seq dataset. Kruskal–Wallis tests (A), Wilcoxon and Hedge’s G (J), and Mann–Whitney (K) tests were used. GOBP, Gene Ontology Biological Process.
Figure 8.
Figure 8.
c-Rel is required for the response to anti-PD-1 therapy. (A) Control (CD4cre-ert2) and Rel-icKO mice were treated with tamoxifen from D−1 to D−7 (gray box), transplanted with MC38 colon adenocarcinoma cells, and treated with anti-PD1 at D7, 9, and 11. Tumor volume over time (mean ± SEM from three experiments with 7–9 mice/group) is shown. (B) Identification of a Rel-dependent gene signature as described in Materials and methods. (C) ssGSEA scores (left panels) and Kaplan–Meier overall survival (OS) curves with the number of patients at risk shown below (right panels) in cohorts of patients with cutaneous melanoma (SKCM), bladder carcinoma (BLCA), and stomach adenocarcinoma (STAD). NR, non-responders; R, responders. Two-way ANOVA followed by Bonferroni’s post-test (tumor volumes), Mann–Whitney tests (ssGSEA scores), and Log-rank tests (survival curves) were used.

References

    1. Adelaja, A., Taylor B., Sheu K.M., Liu Y., Luecke S., and Hoffmann A.. 2021. Six distinct NFκB signaling codons convey discrete information to distinguish stimuli and enable appropriate macrophage responses. Immunity. 54:916–930.e7. 10.1016/j.immuni.2021.04.011 - DOI - PMC - PubMed
    1. Badran, Y.R., Dedeoglu F., Leyva Castillo J.M., Bainter W., Ohsumi T.K., Bousvaros A., Goldsmith J.D., Geha R.S., and Chou J.. 2017. Human RELA haploinsufficiency results in autosomal-dominant chronic mucocutaneous ulceration. J. Exp. Med. 214:1937–1947. 10.1084/jem.20160724 - DOI - PMC - PubMed
    1. Balasubramani, A., Shibata Y., Crawford G.E., Baldwin A.S., Hatton R.D., and Weaver C.T.. 2010. Modular utilization of distal cis-regulatory elements controls Ifng gene expression in T cells activated by distinct stimuli. Immunity. 33:35–47. 10.1016/j.immuni.2010.07.004 - DOI - PMC - PubMed
    1. Barnes, S.E., Wang Y., Chen L., Molinero L.L., Gajewski T.F., Evaristo C., and Alegre M.-L.. 2015a. T cell-NF-κB activation is required for tumor control in vivo. J. Immunother. Cancer. 3:1. 10.1186/s40425-014-0045-x - DOI - PMC - PubMed
    1. Barnes, S.E., Wang Y., Chen L., Molinero L.L., Gajewski T.F., Evaristo C., and Alegre M.L.. 2015b. T cell-NF-κB activation is required for tumor control in vivo. J. Immunother. Cancer. 3:1. 10.1186/s40425-014-0045-x - DOI - PMC - PubMed