. 2024 Jun 3;221(6):e20232387.
doi: 10.1084/jem.20232387. Epub 2024 Apr 2.

Individuals with JAK1 variants are affected by syndromic features encompassing autoimmunity, atopy, colitis, and dermatitis

Affiliations

Individuals with JAK1 variants are affected by syndromic features encompassing autoimmunity, atopy, colitis, and dermatitis

Michael E Horesh et al. J Exp Med. .

Erratum in

  • Correction: Individuals with JAK1 variants are affected by syndromic features encompassing autoimmunity, atopy, colitis, and dermatitis.
    Horesh ME, Martin-Fernandez M, Gruber C, Buta S, Le Voyer T, Puzenat E, Lesmana H, Wu Y, Richardson A, Stein D, Hodeib S, Youssef M, Kurowski JA, Feuille E, Pedroza LA, Fuleihan RL, Haseley A, Hovnanian A, Quartier P, Rosain J, Davis G, Mullan D, Stewart O, Patel R, Lee AE, Rubinstein R, Ewald L, Maheshwari N, Rahming V, Chinn IK, Lupski JR, Orange JS, Sancho-Shimizu V, Casanova JL, Abul-Husn NS, Itan Y, Milner JD, Bustamante J, Bogunovic D. Horesh ME, et al. J Exp Med. 2024 Jun 3;221(6):e2023238704302024c. doi: 10.1084/jem.2023238704302024c. Epub 2024 May 6. J Exp Med. 2024. PMID: 38709237 Free PMC article. No abstract available.

Abstract

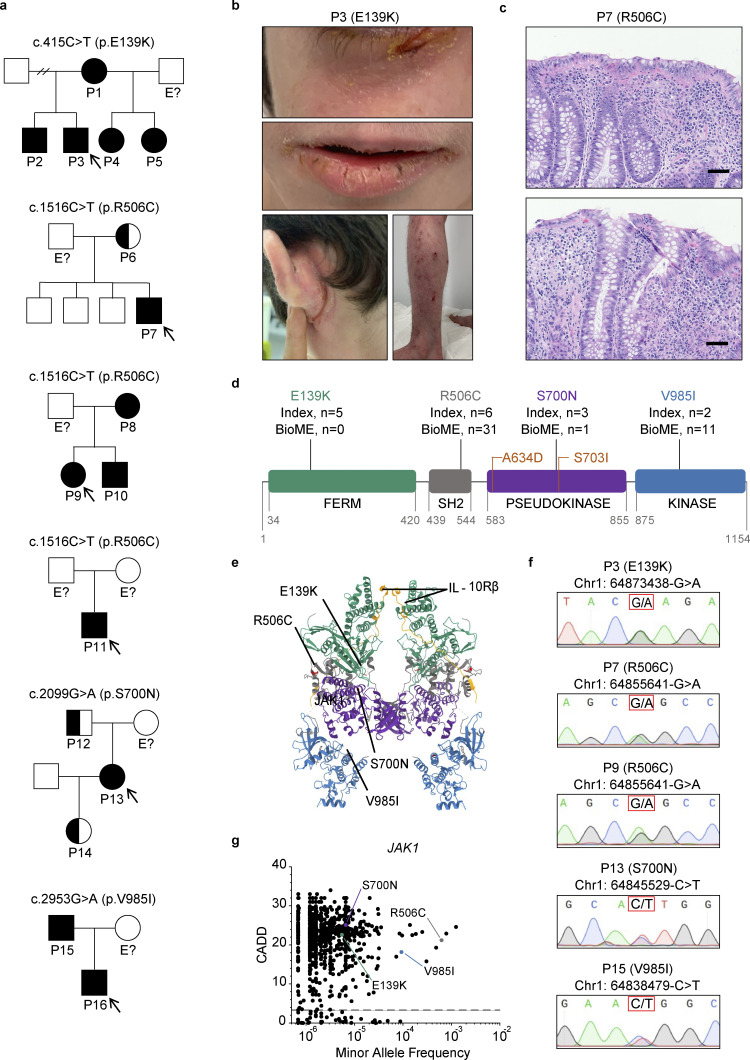
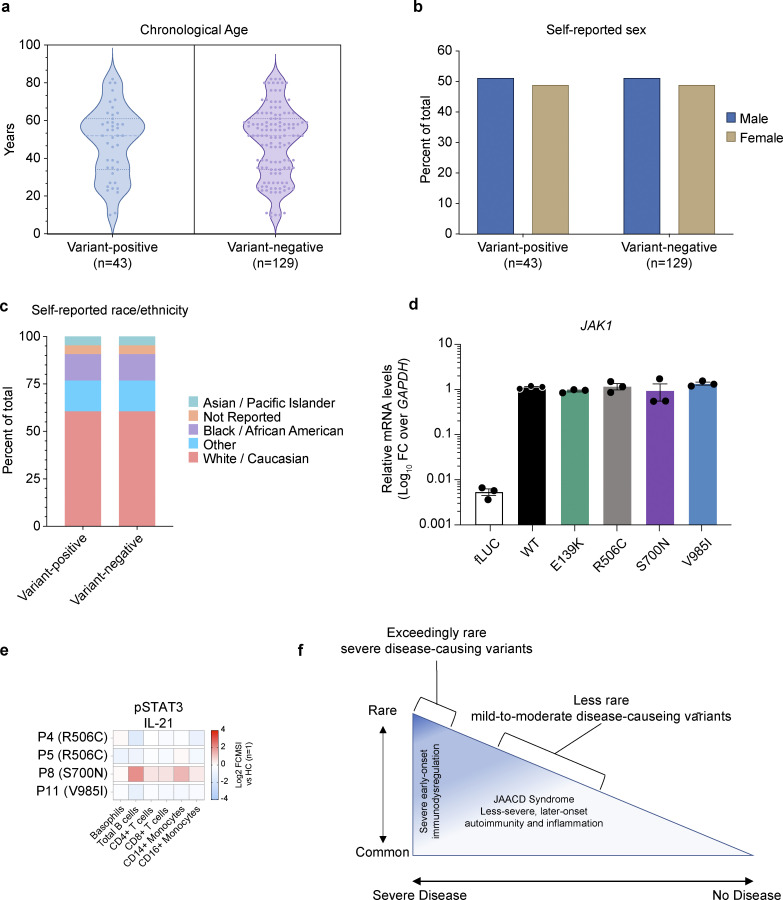
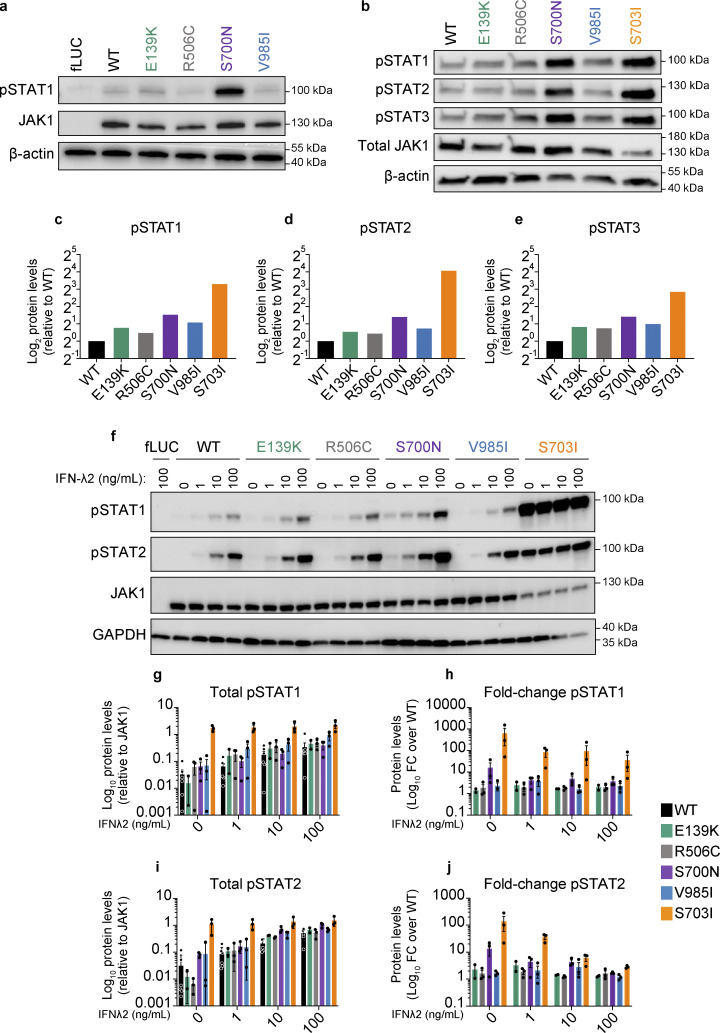
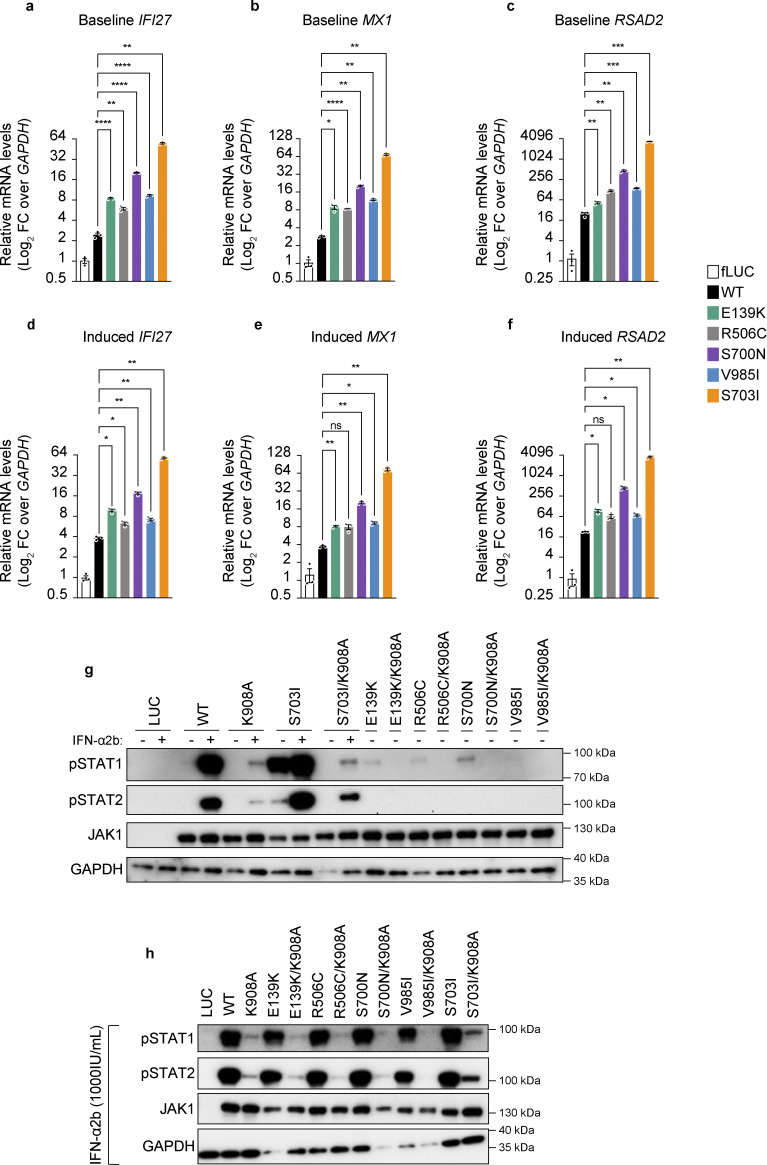
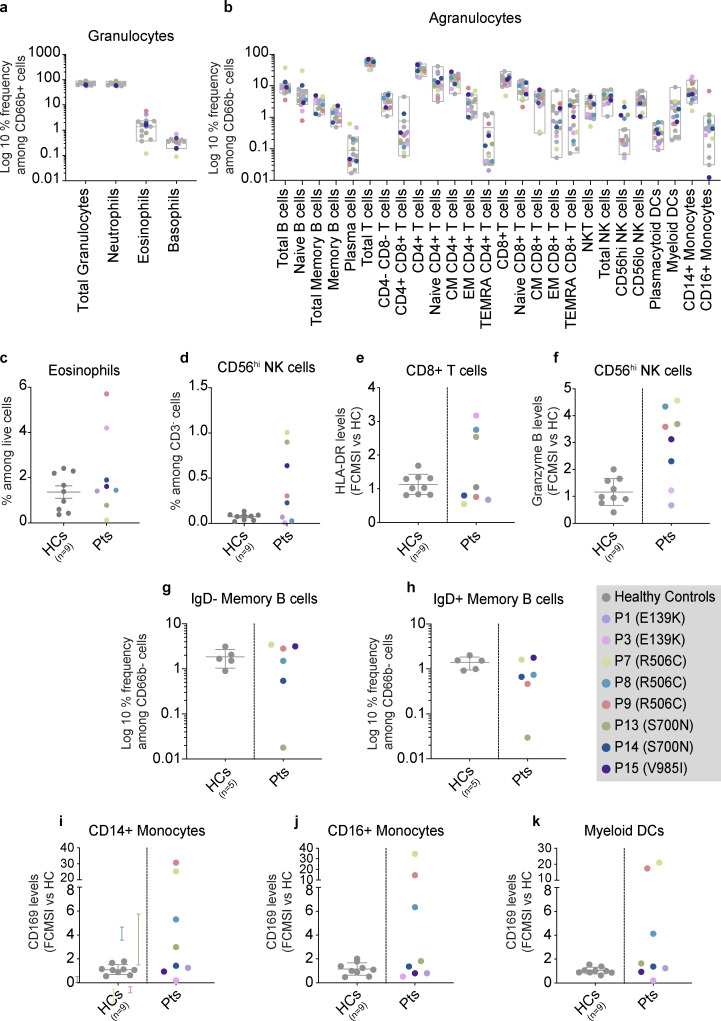
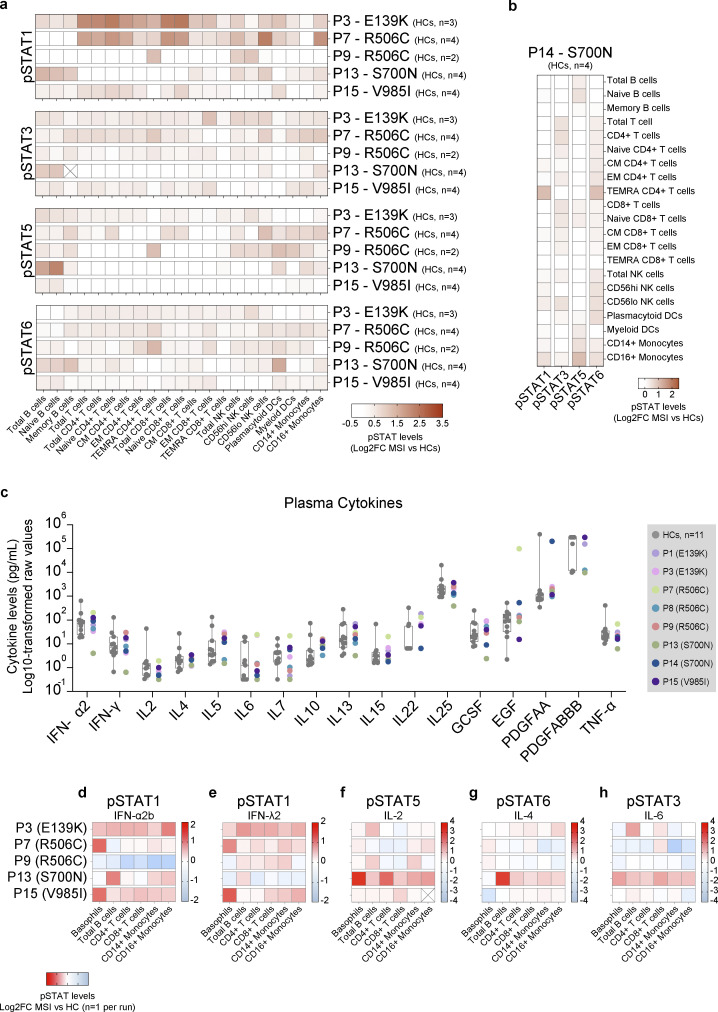
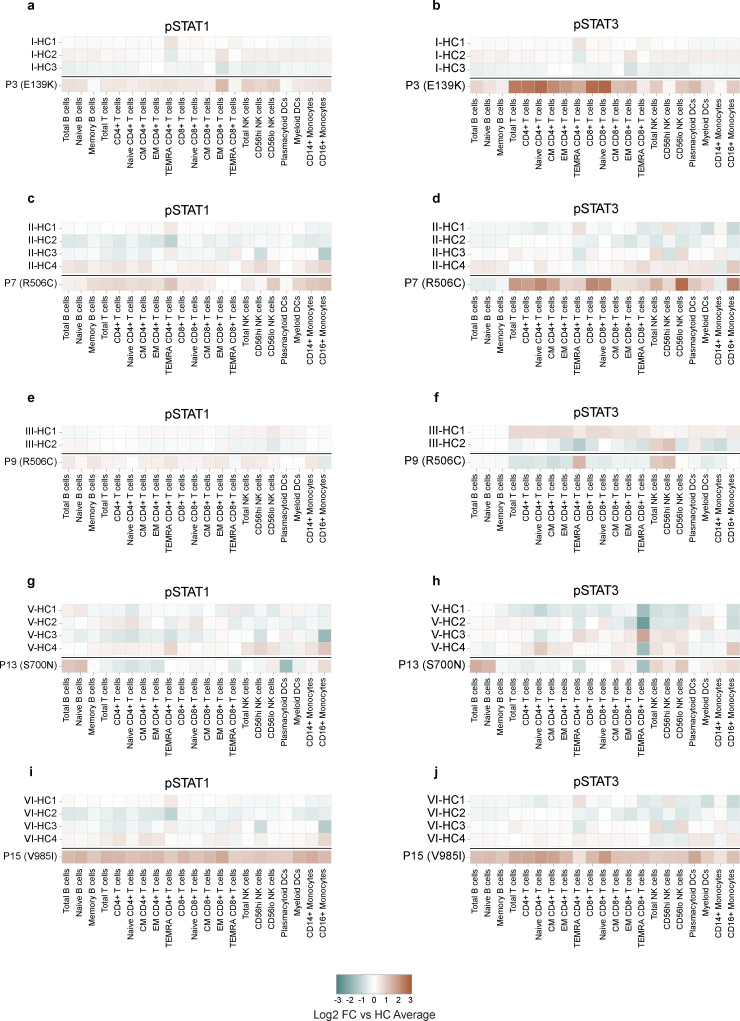
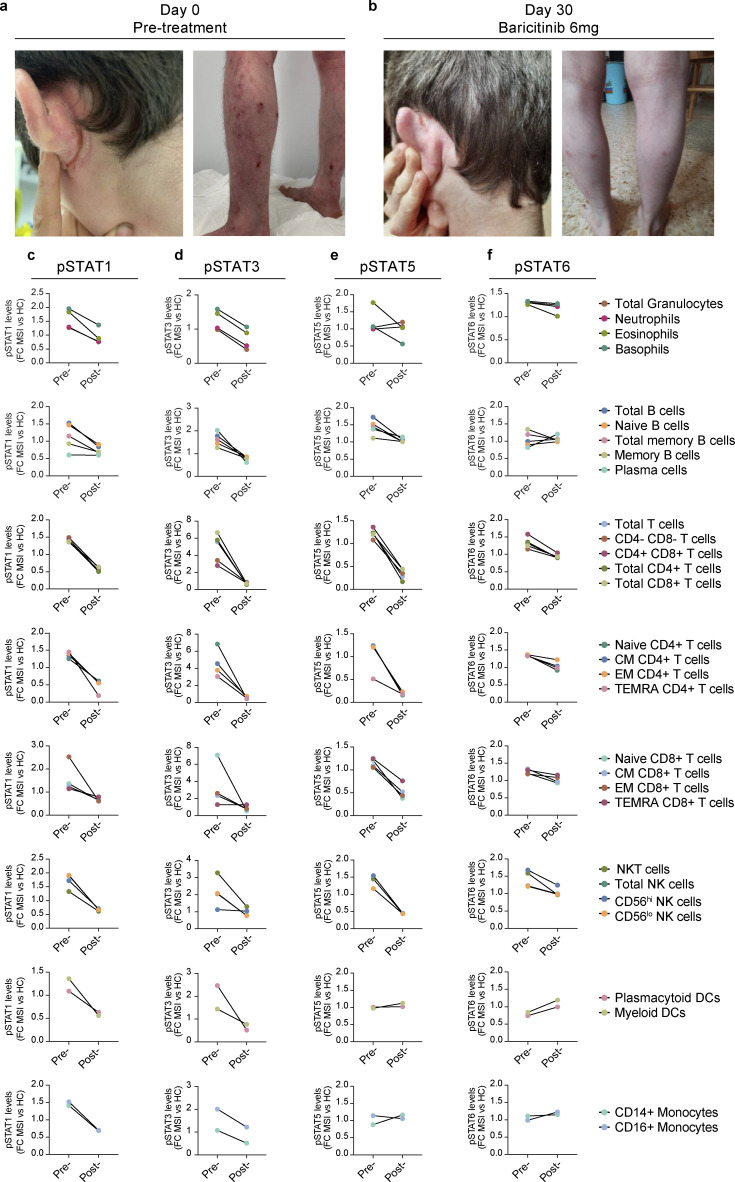
Inborn errors of immunity lead to autoimmunity, inflammation, allergy, infection, and/or malignancy. Disease-causing JAK1 gain-of-function (GoF) mutations are considered exceedingly rare and have been identified in only four families. Here, we use forward and reverse genetics to identify 59 individuals harboring one of four heterozygous JAK1 variants. In vitro and ex vivo analysis of these variants revealed hyperactive baseline and cytokine-induced STAT phosphorylation and interferon-stimulated gene (ISG) levels compared with wild-type JAK1. A systematic review of electronic health records from the BioME Biobank revealed increased likelihood of clinical presentation with autoimmunity, atopy, colitis, and/or dermatitis in JAK1 variant-positive individuals. Finally, treatment of one affected patient with severe atopic dermatitis using the JAK1/JAK2-selective inhibitor, baricitinib, resulted in clinically significant improvement. These findings suggest that individually rare JAK1 GoF variants may underlie an emerging syndrome with more common presentations of autoimmune and inflammatory disease (JAACD syndrome). More broadly, individuals who present with such conditions may benefit from genetic testing for the presence of JAK1 GoF variants.


Conflict of interest statement

Disclosures: D. Bogunovic reported being owner and part owner of Lab11 Therapeutics. R.L. Fuleihan reported personal fees from Horizon, Takeda, Pharming, and Grifols outside the submitted work. I.K. Chinn reported other from Wolters Kluwer (UpToDate), Pharming, and Sumitomo Pharma America outside the submitted work. J.R. Lupski reported other from 23andMe and personal fees from Genome International, Inc, during the conduct of the study. N.S. Abul-Husn reported other from 23andMe and Allelica outside the submitted work. J.D. Milner reported personal fees from Blueprint Medicines outside the submitted work. No other disclosures were reported.

Figures

Figure 1.
Figure 1.
Six families with inflammatory and autoimmune diseases are found to harbor heterozygous JAK1 variants affecting all four JAK1 protein domains. (a) Pedigrees for each kindred with the identified JAK1 variants. Affected individuals (shaded) or unaffected carriers (half-shaded) are numbered (P#). Unshaded individuals labeled with “E?” have an unknown JAK1 genotype status. All other unshaded individuals are JAK1 WT. Initially presenting probands are identified by arrows. Male sex is indicated by squares and female sex by circles. (b) Severe atopic dermatitis (SCORAD = 60) affecting P3. Upper panel represents affected areas underneath the eyes. Middle panel represents affected areas of the lower face. Lower left panel represents affected areas of the lower extremities and feet. Lower right panel represents affected areas of the upper extremities and hands. (c) H&E-stained tissue sections of small intestine from P7 (JAK1 R506C) depicting focal neutrophilic inflammation (upper and lower), granuloma (upper), and cryptitis (lower). 100× magnification. Representative micrographs shown from six individual images. Black scale bars are equivalent to 100 μm. (d) Location of four amino acid substitutions arising from the identified JAK1 SNVs along the four domains of the JAK1 protein. Counts of subjects from index families (Index) and subjects present in the Mount Sinai Biobank. Previously described GoF variants are indicated in orange. Digits below domains represent amino acid numbers bordering each domain. (e) Full crystal structure of murine JAK1 dimer, colored by domain, complexed with intracellular tails of IFN-λR1/IL-10Rb in yellow (PDB ID 7T6F) (Glassman et al., 2022). Domains colored as follows: FERM = green, SH2 = gray, pseudokinase = purple, kinase = blue. Corresponding murine-to-human amino acid substitutions depicted in red and labeled by protein consequence. (f) Chromatograms from Sanger sequencing of genomic DNA sampled from affected individuals. Corresponding genomic locations and nucleotide substitutions are indicated above each chromatogram. P11 and P16 did not provide a biological sample and are therefore not included in the data set. (g) Minor allele frequencies for missense JAK1 variants present in gnomAD (v4.0) mapped against corresponding CADD scores (99% confidence interval, HGMD). Prototype JAK1 variants are labeled for reference. The dotted line represents JAK1 mutation significance cutoff (MSC) of 3.313.
Figure S1.
Figure S1.
Demographics of individuals included in a systematic review of EHRs, in vitro, and ex vivo assessment of JAK1 variants. (a) Chronological age in years (calculated from the date of birth) of each JAK1 variant-positive and variant-negative individual at the time of systematic review (2022). Each dot represents a single subject; the width of the shaded area is proportionate to the number of points at that age. Dotted lines delineate quartiles; middle dotted line represents median age. (b) Sex (self-reported) for variant-positive and variant-negative individuals at the time of systematic review (2022). Proportions represented as percent of the total for each genotype. (c) Self-reported race/ethnicity for variant-positive and variant-negative individuals at the time of systematic review (2023). Proportions represented as percent of total for each genotype status. (d) JAK1 mRNA levels in stably transduced U4C cells expressing doxycycline-inducible negative control (fLUC) or JAK1 constructs. JAK1 levels are represented as log10-transformed RNA levels, normalized to the endogenous control transcript, GAPDH. Each individual point represents the average of technical triplicates from a single well (n = 3 wells per variant). Lines and whiskers represent the mean ± SEM from three wells. Representative data shown from three independent experiments for each variant. (e) Canonical pSTAT3 signaling in patient whole blood stimulated with IL-21 (100 ng/ml). Results expressed as log2-transformed fold-change versus stimulated HCs (n = 1 per run). (f) Rare-to-common JAK1 GoF variants lie on a correlated frequency and phenotype spectrum with JAACD syndrome accounting for more common presentations that are often less severe and later onset.
Figure 2.
Figure 2.
In vitro assessment of prototype JAK1 variants reveals baseline and cytokine-induced GoF in STAT phosphorylation and ISG production. (a) Western blot analysis of pSTAT1, JAK1, and β-actin (endogenous loading control) protein levels in stably transduced U4C cells expressing doxycycline-inducible fLUC or JAK1 constructs. Representative images are shown from three independent experiments for each variant. (b) Western blot analysis of pSTATs1-3, JAK1, and β-actin (endogenous loading control) protein levels in transfected U4C cells (JAK1 null) expressing either WT or variant JAK1 constructs. Representative images are shown from two independent experiments for each variant. (c–e) Band densitometry quantifying the levels of JAK1-relative (c) pSTAT1, (d) pSTAT2, and (e) pSTAT3 in lanes from panel b. Protein levels represented as log2-transformed β-actin–normalized protein levels relative to β-actin–normalized JAK1 levels from the same lane. (f) Western blot analysis of pSTAT1, pSTAT2, JAK1, and GAPDH (endogenous loading control) protein levels in stably transduced U4C cells expressing doxycycline-inducible fLUC or JAK1 constructs. Each lane corresponds to independent wells, which were doxycycline-induced then cytokine stimulated with the indicated doses of IFN-λ2 (0, 1, 10, 100 ng/ml). Representative images are shown from three independent experiments for each variant. (g–j) Band densitometry quantifying pSTAT1 (g and h) and pSTAT2 (i and j) protein levels in cells expressing JAK1 variants. Protein levels represented as GAPDH-normalized pSTAT levels relative to GAPDH-normalized JAK1 levels from the same lane (g and i), and as fold change in GAPDH-normalized relative pSTAT levels versus the WT condition (h and j). Each point represents an individual replicate for each variant from n = 7 total experiments. Lines and whiskers represent the mean ± SEM. Source data are available for this figure: SourceData F2.
Figure 3.
Figure 3.
In vitro assessment of baseline pSTAT activity on transcription and trans-regulation by JAK1 variants. (a–f) ISG (IFI27, MX1, and RSAD2) mRNA levels assessed by RT-qPCR of RNA from stably transduced and induced U4C cells that were stimulated with (a–c) mock or (d–f) IFN-α2b (1,000 IU/ml) for 30 min, then rested for 12 h. ISG levels are represented as log2-transformed relative mRNA levels over the endogenous control transcript, GAPDH. Each individual point represents the average of technical triplicates from a single well (n = 3 wells per condition). Lines and whiskers represent the mean ± SEM from three wells. P values indicated above bars were obtained by statistical testing by one-way ANOVA with Dunnett’s T3 comparison test, with statistical assessment as follows: *P < 0.05; **P < 0.005; ***P < 0.0005; ****P < 0.0005; ns = not significant. Representative data shown from experiments conducted three independent times for each condition. (g and h) Western blot analysis of pSTAT1-2, JAK1, and GAPDH (endogenous loading control) protein levels in stably transduced U4C cells expressing doxycycline-inducible variant JAK1 constructs (single mutants) or catalytically dead variant JAK1 constructs (double mutants). In panel g, minus signs (−) indicate mock stimulated cells, and plus signs (+) indicate IFN-α2b (1,000 IU/ml) stimulated cells. In panel h, all lanes represent cells stimulated with IFN-α2b (1,000 IU/ml). Source data are available for this figure: SourceData F3.
Figure 4.
Figure 4.
Ex vivo assessment of individuals with JAK1 variants by whole blood CyTOF. (a and b) Granulocytes (a) and agranulocytes (b) in whole blood from individuals with JAK1 variants and HCs. Results are depicted as log10-transformed percent frequencies of CD66b+ cells and CD66b cells, respectively. Gray box plots represent HC ranges (min-max) with the middle bar representing the average for HCs. For panels a and b, number of HCs for each patient are as follows: P3 n = 3; P7 n = 4; P9 n = 2; P13 n = 4; P15 n = 4. For panel b, CM = central memory; EM = effector memory; TEMRA = T effector memory CD45RA+; NKT = NK T cells; NK = natural killer. Populations labeled “granulocytes” comprise all CD66b+ cells (including neutrophils, eosinophils, and basophils). (c and d) Percent frequencies of manually gated (c) eosinophils and (d) NK cells in whole blood from individuals with JAK1 variants and healthy controls (HCs). HC group (n = 9) labeled as “HCs.” Patient group (n = 8) labeled as “Pts.” Results are expressed as a percent of live cells for eosinophils and as a percent of CD3 cells for CD56hi NK cells. Each point represents a single subject. Bars and whiskers represent the mean ± SEM for that group. (e and f) Baseline levels of (e) HLA-DR and (f) granzyme B in manually gated CD8+ T cells and CD56hi NK cells respectively. Levels measured in whole blood from individuals with JAK1 variants compared to HCs. For panels a and b, results are expressed as fold-change in mean signal intensity (FCMSI) over the average of nine HCs. Number of HCs for each patient are as follows: P3 n = 3; P7 n = 4; P9 n = 2; P13 n = 4; P15 n = 4. Results are from four independent runs with 1 (P1 and P3) or 2 (P7, P8, P9, P13, P14, P15) technical replicates. Gray bars and whiskers represent the mean ± SEM for HCs. (g and h) Percent frequencies of (g) IgD negative and (h) IgD positive memory B cells in whole blood from individuals with JAK1 variants. Results expressed as the log10-transformed percent frequencies of CD66b cells (agranulocytes). The number of HCs from three independent runs are as follows: P7 and P15, n = 2; P8 and P9, n = 2; P13 and P14, n = 1. There was no biological sample available for this experiment from Kindred I (P1 and P3), therefore IgD status was not assessed. (i–k) Baseline CD169 levels in (i) CD14+ monocytes, (j) CD16+ monocytes, and (k) myeloid DCs in whole blood from individuals with JAK1 variants compared to HCs. Results expressed as FCMSI over the average of nine HCs. Number of HCs for each patient are as follows: P3 n = 3; P7 n = 4; P9 n = 2; P13 n = 4; P15 n = 4. Results are from four independent runs with 1 (P1 and P3) or 2 (P7, P8, P9, P13, P14, P15) technical replicates. Gray bars and whiskers represent the mean ± SEM for HCs.
Figure 5.
Figure 5.
Ex vivo assessment of whole blood from individuals with JAK1 variants reveals cell typespecific GoF in STAT phosphorylation. (a) Baseline pSTAT1, 3, 5, and 6 levels in manually gated cells from unstimulated whole blood from individuals with JAK1 variants. Each row represents an individual run with the number of HCs for each run labeled. Manually gated cell types for each run are labeled by column. Cells marked with an X indicate no cells were captured for that run. Results are depicted as log2-transformed fold-change in mean signal intensity (MSI) versus the mean signal intensity of HCs from the same run. Number of HCs for each patient are as follows: P3 n = 3; P7 n = 4; P9 n = 2; P13 n = 4; P15 n = 4. (b) Baseline pSTAT1, 3, 5, and 6 levels in manually gated cells from P14. Results depicted as log2-transformed fold change in mean signal intensity (MSI) compared with the average of (HCs from the same run). Each row represents an individual run with HC (n = 4). (c) Multiplex Luminex assay on plasma from individuals with JAK1 variants (n = 8) and HCs (n = 11). Results are expressed as the log10-transformed raw values (pg/ml). All results depicted are from a single run. Gray boxes represent mean ± SD, whiskers represent minimum to maximum range of HCs. For panels a and b: CM = central memory; EM = effector memory; TEMRA = T effector memory CD45RA+; NKT = natural killer T cell; NK = natural killer, DC = dendritic cells. (d–h) Canonical pSTAT levels in stimulated whole blood from individuals with JAK1 variants. Cytokine concentrations as follows: IFN-α2b (P3 = 100 IU/ml; all other patients = 1,000 IU/ml), IFN-λ2, IL-2, IL4, or IL-6 (P3 = 10 ng/ml; all other patients = 100 ng/ml). Each row represents an individual run. Manually gated cell types for each run are labeled by column. Cells marked with an X indicate no cells were captured for that run. Results expressed as log2-transformed fold-change in mean signal intensity versus mean signal intensity of stimulated HCs from the same run (n = 1 HC per run).
Figure S2.
Figure S2.
Ex vivo assessment baseline pSTAT levels compared to individual healthy controls from the same run. (a–j) pSTAT1 (left) and pSTAT3 (right) levels in manually gated cells from unstimulated whole blood from individuals with JAK1 variants encoding JAK1 E139K (a and b), R506C (c and d), R506C (e and f), S700N (g and h), or V985I (i and j). Each panel represents a single run with the corresponding HCs labeled accordingly. Results expressed as log2-transformed fold-change in mean signal intensity (MSI) compared with the average of HCs for that run. HC counts are as follows: P3 n = 3; P7 n = 4; P9 n = 2; P13 n = 4; P14 n = 4; P15 n = 4.
Figure 6.
Figure 6.
JAK-inhibitor therapy resolves atopic dermatitis and abrogates hyperactive STAT phosphorylation in whole blood. (a–f) Severe atopic dermatitis in P3 (a) before (SCORAD = 60) and (b) after (SCORAD = 16) 30 days of in vivo treatment with baricitinib. Levels of pSTAT1 (c), pSTAT3 (d), pSTAT5 (e), and pSTAT6 (f) from P3 (E139K), who were treated with baricitinib in vivo. Results depicted as pretreatment (pre-) and posttreatment (post-) levels of pSTATs in granulocyte subsets, B cell subsets, major T cells subsets, CD4+ T cells subsets, CD8+ T cell subsets, NK cells subsets, dendritic cell subsets, and monocyte subsets. Results represented as fold-change in mean signal intensity (FCMSI) compared with non-treated HC (n = 1 for pre-treatment run and n = 1 for post-treatment run). For all panels, CM = central memory; EM = effector memory; TEMRA = T effector memory CD45RA+; NK = natural killer, DC = dendritic cell. Populations labeled “granulocytes” comprise all CD66b+ cells (including neutrophils, eosinophils, and basophils).

Similar articles

Cited by

References

    1. Del Bel, K.L., Ragotte R.J., Saferali A., Lee S., Vercauteren S.M., Mostafavi S.A., Schreiber R.A., Prendiville J.S., Phang M.S., Halparin J., et al. . 2017. JAK1 gain-of-function causes an autosomal dominant immune dysregulatory and hypereosinophilic syndrome. J. Allergy Clin. Immunol. 139:2016–2020.e5. 10.1016/j.jaci.2016.12.957 - DOI - PubMed
    1. European Task Force on Atopic Dermatitis . 1993. Severity scoring of atopic dermatitis: The SCORAD index. Consensus report of the European Task Force on atopic dermatitis. Dermatology. 186:23–31. 10.1159/000247298 - DOI - PubMed
    1. Fagerberg, L., Hallström B.M., Oksvold P., Kampf C., Djureinovic D., Odeberg J., Habuka M., Tahmasebpoor S., Danielsson A., Edlund K., et al. . 2014. Analysis of the human tissue-specific expression by genome-wide integration of transcriptomics and antibody-based proteomics. Mol. Cell. Proteomics. 13:397–406. 10.1074/mcp.M113.035600 - DOI - PMC - PubMed
    1. Fayand, A., Hentgen V., Posseme C., Lacout C., Picard C., Moguelet P., Cescato M., Sbeih N., Moreau T.R.J., Zhu Y.Y.J., et al. . 2023. Successful treatment of JAK1-associated inflammatory disease. J. Allergy Clin. Immunol. 152:972–983. 10.1016/j.jaci.2023.06.004 - DOI - PubMed
    1. Geanon, D., Lee B., Gonzalez-Kozlova E., Kelly G., Handler D., Upadhyaya B., Leech J., De Real R.M., Herbinet M., Magen A., et al. . 2021. A streamlined whole blood CyTOF workflow defines a circulating immune cell signature of COVID-19. Cytometry. 99:446–461. 10.1002/cyto.a.24317 - DOI - PMC - PubMed

Publication types