. 2024 May;80(2):451-463.
doi: 10.1007/s13105-024-01016-z. Epub 2024 Apr 2.

NCS-1 protein regulates TRPA1 channel through the PI3K pathway in breast cancer and neuronal cells

Affiliations

NCS-1 protein regulates TRPA1 channel through the PI3K pathway in breast cancer and neuronal cells

Julio C Sánchez et al. J Physiol Biochem. 2024 May.

Abstract

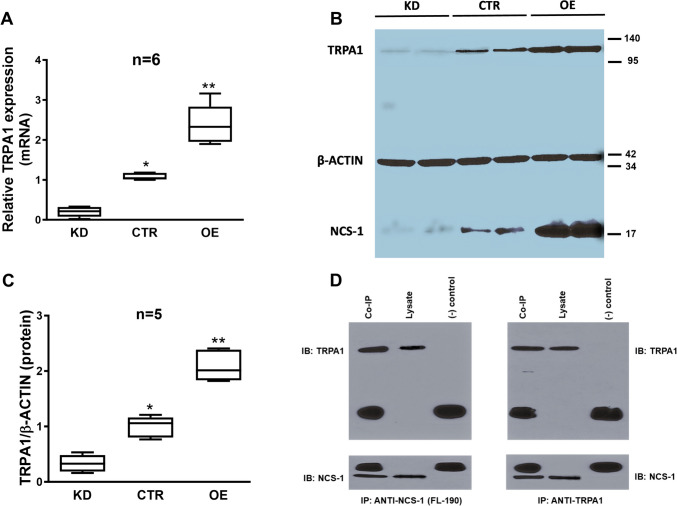
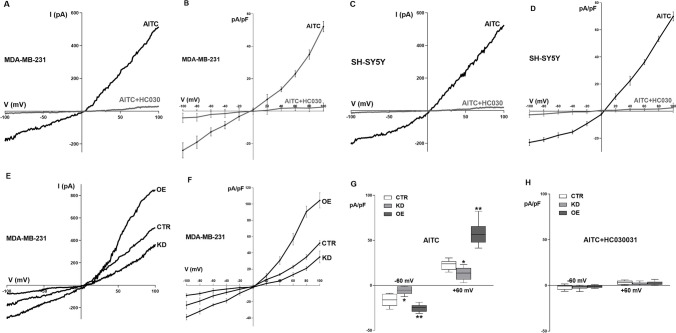
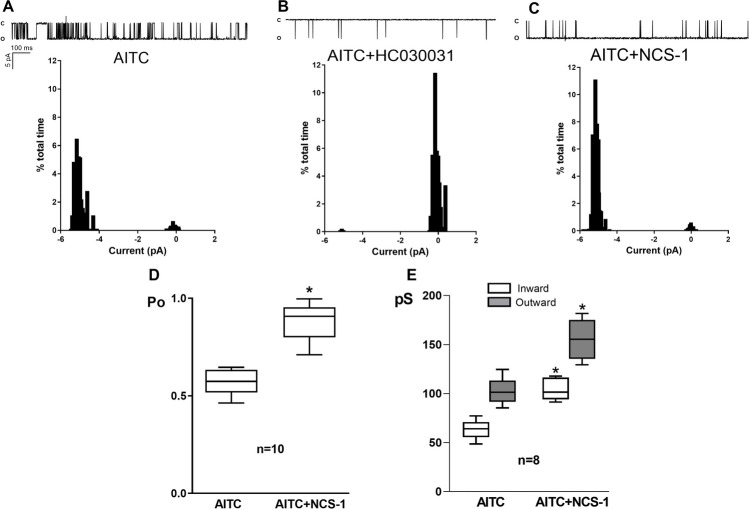
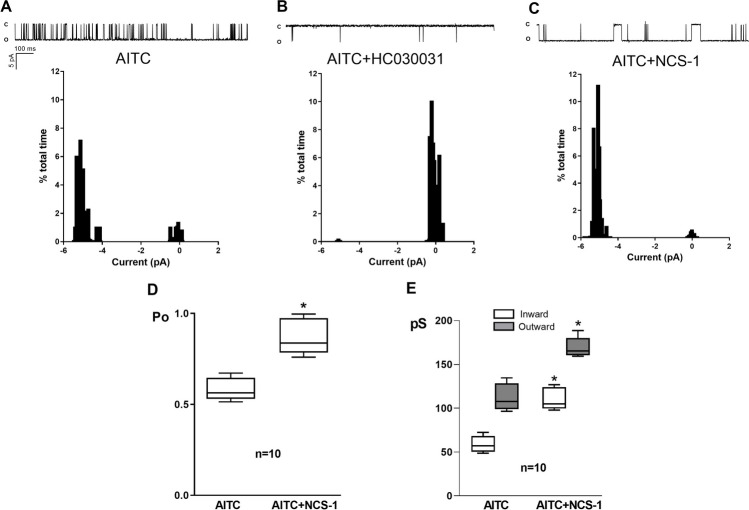
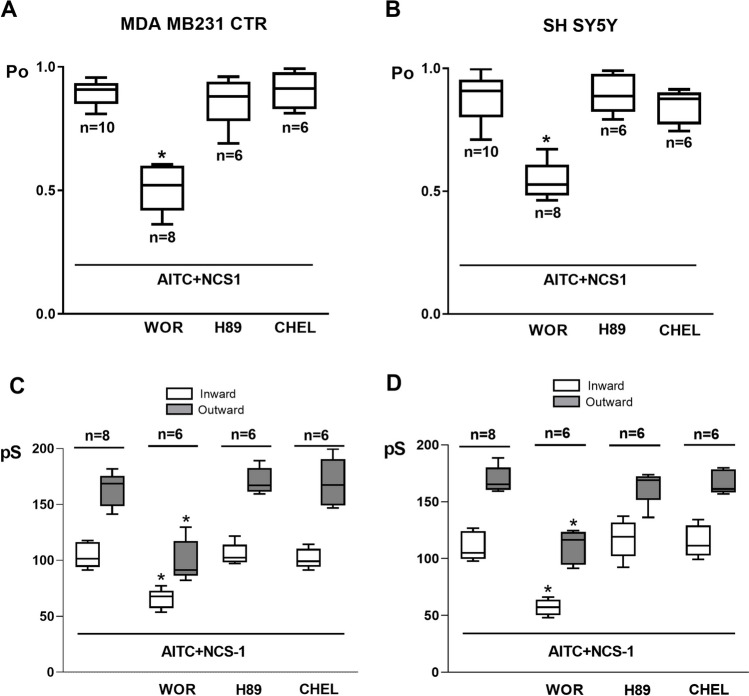
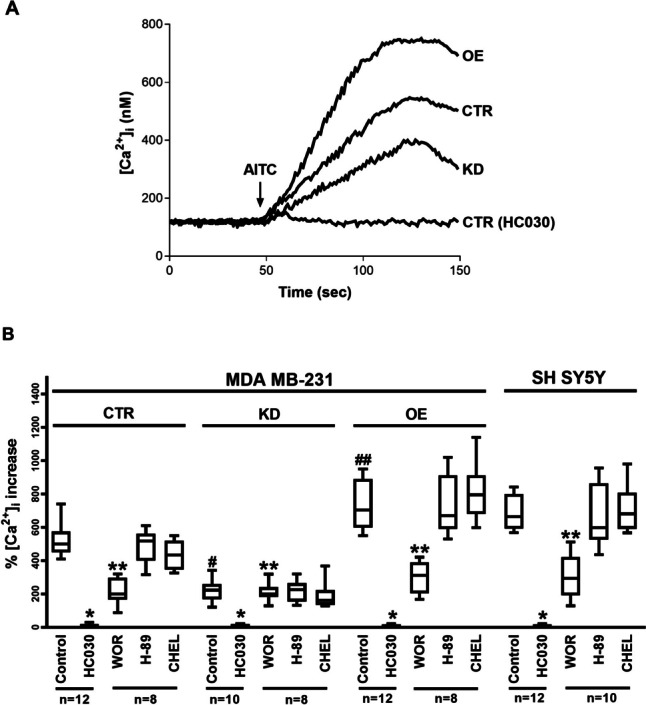
The physical and functional interaction between transient receptor potential channel ankyrin 1 (TRPA1) and neuronal calcium sensor 1 (NCS-1) was assessed. NCS-1 is a calcium (Ca2+) sensor found in many tissues, primarily neurons, and TRPA1 is a Ca2+ channel involved not only in thermal and pain sensation but also in conditions such as cancer and chemotherapy-induced peripheral neuropathy, in which NCS-1 is also a regulatory component.We explored the interactions between these two proteins by employing western blot, qRT-PCR, co-immunoprecipitation, Ca2+ transient monitoring with Fura-2 spectrophotometry, and electrophysiology assays in breast cancer cells (MDA-MB-231) with different levels of NCS-1 expression and neuroblastoma cells (SH-SY5Y).Our findings showed that the expression of TRPA1 was directly correlated with NCS-1 levels at both the protein and mRNA levels. Additionally, we found a physical and functional association between these two proteins. Physically, the NCS-1 and TRPA1 co-immunoprecipitate. Functionally, NCS-1 enhanced TRPA1-dependent Ca2+ influx, current density, open probability, and conductance, where the functional effects depended on PI3K. Conclusion: NCS-1 appears to act not only as a Ca2+ sensor but also modulates TRPA1 protein expression and channel function in a direct fashion through the PI3K pathway. These results contribute to understanding how Ca2+ homeostasis is regulated and provides a mechanism underlying conditions where Ca2+ dynamics are compromised, including breast cancer. With a cellular pathway identified, targeted treatments can be developed for breast cancer and neuropathy, among other related diseases.

Keywords: Calcium signaling; Cancer; Electrophysiology; NCS-1; Neuronal calcium sensor 1; Neurotoxicity; TRPA1; Transient receptor potential channel ankyrin 1.


Conflict of interest statement

BEE is a cofounder of Osmol Therapeutics, a company that is targeting NCS-1 for therapeutic purposes. The other authors declare that there are no conflicts of interest.

Figures

Fig. 1
Fig. 1
A. Comparative expression of TRPA1 mRNA in CTR, KD and OE MDA-MB231, measured by qRT-PCR. Human β-actin was amplified as a control. Note the different levels of expression in the three different MDA-MB231 cell lines. B. Representative Western blot showing the expression of TRPA1 protein in the same cell lines in two different batches of cells. Human β-actin was used as a control. Note the different protein levels in the three different MDA-MB231 cell lines. * denotes significance (p < 0.05) comparing with KD cells and ** denotes significance (p < 0.05) comparing with KD and CTR cells. C. Comparative levels of TRPA1 expression in MDA-MB231 cells normalized to levels of β-actin expression (n = 5). * denotes significance (p < 0.05) comparing with KD cells and ** denotes significance (p < 0.05) comparing with KD and CTR cells. D. Representative Western blot following co-immunoprecipitation as indicated, in CTR MDA-MB231 cells. Note that the non-identified bigger bands correspond to the antibody heavy and light chains in both panels
Fig. 2
Fig. 2
A. Typical I-V recording of the current obtained in individual MDA-MB231 CTR cells, elicited by a ramp protocol from -100 mV to + 100 mV and activated by AITC (black trace), which is abolished when the TRPA1 inhibitor HC-030031 is present (gray trace). B. I-V relationship of the AITC-induced current in MDA-MB231 CTR cells in the absence (black trace) and presence (gray trace) of HC-030031. C. Typical I-V recording of the current obtained in individual SH-SY5Y cells, elicited by a ramp protocol from -100 mV to + 100 mV and activated by AITC (black trace), which is abolished when the TRPA1 inhibitor HC-030031 is present (gray trace). D. I-V relationship of the AITC-induced current in SH-SY5Y cells in the absence (black trace) and presence (gray trace) of HC-030031. E. Typical I-V recording of the current obtained in individual CTR, KD and OE MDA-MB231 cells, elicited by a ramp protocol from -100 mV to + 100 mV and activated by AITC. F. I-V relationship of the AITC-induced current in CTR, KD and OE MDA-MB231 cells. G. Comparison between the mean maximal normalized AITC-induced current recorded at -60 mV and + 60 mV in the three different cell lines as indicated in E and F. H. Comparison between the mean maximal normalized AITC-induced current recorded at -60 mV and + 60 mV in the presence of HC-030031 in the three different cell lines. Note that the current was also completely inhibited. n = 12 in all cases. * denotes significant decrease (p = 0.021) and ** denotes significant increase (p = 0.015)
Fig. 3
Fig. 3
A. Recordings of single channel activity (opening is downward) and corresponding amplitude histogram of single-channel currents through TRPA1, activated by AITC, in MDA-MB231 CTR cells, at -60 mV. B. Recordings of single channel activity (opening is downward) and corresponding amplitude histogram of single-channel currents through TRPA1, activated by AITC, in the presence of HC030031, at -60 mV. C. Recordings of single channel activity (opening is downward) and corresponding amplitude histogram of single-channel currents through TRPA1, activated by AITC, in the presence of NCS1, at -60 mV. D. Comparison of the mean open probability (Po) in 10 different patches in the conditions described in A and C. E. Comparison of the mean inward (IGTRPA1) and outward (OGTRPA1) conductances in 8 different patches in the absence and the presence of NCS1, calculated from I-V linear regressions, for each condition. * denotes significance (p = 0.021 for IGTRPA1. p = 0.016 for OGTRPA1)
Fig. 4
Fig. 4
A. Recordings of single channel activity (opening is downward) and corresponding amplitude histogram of single-channel currents through TRPA1, activated by AITC, in SH-SY5Y cells, at -60 mV. B. C. Recordings of single channel activity (opening is downward) and corresponding amplitude histogram of single-channel currents through TRPA1, activated by AITC, in the presence of HC030031, at -60 mV. C. Recordings of single channel activity (opening is downward) and corresponding amplitude histogram of single-channel currents through TRPA1, activated by AITC, in the presence of NCS1, at -60 mV. D. Comparison of the mean open probability (Po) in 10 different patches in the conditions described in A and C. E. Comparison of the mean inward (IGTRPA1) and outward (OGTRPA1) conductances in 10 different patches in the absence and the presence of NCS1, calculated from I-V linear regressions, for each condition. * denotes significance (p = 0.03 for IGTRPA1. p = 0.024 for OGTRPA1)
Fig. 5
Fig. 5
A. Comparison of the mean open probability (Po) in 8 different patches from MDA-MB231 CTR cells in the conditions described in A. B. Comparison of the mean open probability (Po) in 8 different patches from SH-SY5Y cells in the conditions described in B. C. Comparison of the mean inward (IGTRPA1) and outward (OGTRPA1) conductances in 6 different patches from MDA-MB231 CTR cells in the presence of NCS1 and under the effect of wortmannin (WOR), H89 and chelerythrine (CHEL), calculated from I-V linear regressions. D. Comparison of the mean inward (IGTRPA1) and outward (OGTRPA1) conductances in 6 different patches from SH-SY5Y cells in the presence of NCS1 and under the effect of wortmannin (WOR), H89 and chelerythrine (CHEL), calculated from I-V linear regressions
Fig. 6
Fig. 6
A. Representative recordings of intracellular Ca2+ concentration in Fura-2-loaded MDA-MB231 (CTR, KD and OE) cells in steady-state conditions and following AITC treatment in the absence and presence of HC030. Fluorescence was recorded for 150 s. The arrow indicates the moment in which AITC was added to the external solution. B. Comparison between mean maximal AITC-induced intracellular Ca2+ increase percentage in Fura-2-loaded MDA-MB231 cells (CTR, KD, OE) and SH-SY5Y cells, in the absence and presence of HC-030, wortmannin (WOR), H-89 and chelerythrine (CHEL), as indicated. n is indicated in each case. * denotes significant difference with respect to the control situation (following AITC treatment alone) in the same type of cell. ** denotes significant difference with respect to control and HC030-treated cells. # denotes significant decrease with respect to MDA-MB231 CTR cells. ## denotes significant increase with respect to MDA-MB231 CTR cells

Similar articles

References

    1. Apasu JE, Schuette D, LaRanger R, Steinle JA, Nguyen LD, Grosshans HK, Zhang M, Cai WL, Yan Q, Robert ME. Neuronal calcium sensor 1 (NCS1) promotes motility and metastatic spread of breast cancer cells in vitro and in vivo. FASEB J. 2019;33(4):4802–4813. doi: 10.1096/fj.201802004R. - DOI - PMC - PubMed
    1. Boeckel GR. Ehrlich BE (2018) NCS-1 is a regulator of calcium signaling in health and disease. Biochimica et Biophysica (BBA)-Acta Molecular Cell Research. 1865;11:1660–1667. - PMC - PubMed
    1. Boehmerle W, Splittgerber U, Lazarus MB, McKenzie KM, Johnston DG, Austin DJ, Ehrlich BE. Paclitaxel induces calcium oscillations via an inositol 1,4,5-trisphosphate receptor and neuronal calcium sensor 1-dependent mechanism. Proc Natl Acad Sci U S A. 2006;103(48):18356–18361. doi: 10.1073/pnas.0607240103. - DOI - PMC - PubMed
    1. Boehmerle W, Splittgerber U, Lazarus MB, McKenzie KM, Johnston DG, Austin DJ, Ehrlich BE. Paclitaxel induces calcium oscillations via an inositol 1, 4, 5-trisphosphate receptor and neuronal calcium sensor 1-dependent mechanism. Proc Natl Acad Sci. 2006;103(48):18356–18361. doi: 10.1073/pnas.0607240103. - DOI - PMC - PubMed
    1. Bong AH, Robitaille M, Milevskiy MJ, Roberts-Thomson SJ, Monteith GR. NCS-1 expression is higher in basal breast cancers and regulates calcium influx and cytotoxic responses to doxorubicin. Mol Oncol. 2020;14(1):87–104. doi: 10.1002/1878-0261.12589. - DOI - PMC - PubMed