. 2024 Apr 2;134(10):e172014.
doi: 10.1172/JCI172014.

NFĸB signaling drives myocardial injury via CCR2+ macrophages in a preclinical model of arrhythmogenic cardiomyopathy

Affiliations

NFĸB signaling drives myocardial injury via CCR2+ macrophages in a preclinical model of arrhythmogenic cardiomyopathy

Stephen P Chelko et al. J Clin Invest. .

Erratum in

Abstract

Nuclear factor κ-B (NFκB) is activated in iPSC-cardiac myocytes from patients with arrhythmogenic cardiomyopathy (ACM) under basal conditions, and inhibition of NFκB signaling prevents disease in Dsg2mut/mut mice, a robust mouse model of ACM. Here, we used genetic approaches and single-cell RNA-Seq to define the contributions of immune signaling in cardiac myocytes and macrophages in the natural progression of ACM using Dsg2mut/mut mice. We found that NFκB signaling in cardiac myocytes drives myocardial injury, contractile dysfunction, and arrhythmias in Dsg2mut/mut mice. NFκB signaling in cardiac myocytes mobilizes macrophages expressing C-C motif chemokine receptor-2 (CCR2+ cells) to affected areas within the heart, where they mediate myocardial injury and arrhythmias. Contractile dysfunction in Dsg2mut/mut mice is caused both by loss of heart muscle and negative inotropic effects of inflammation in viable muscle. Single nucleus RNA-Seq and cellular indexing of transcriptomes and epitomes (CITE-Seq) studies revealed marked proinflammatory changes in gene expression and the cellular landscape in hearts of Dsg2mut/mut mice involving cardiac myocytes, fibroblasts, and CCR2+ macrophages. Changes in gene expression in cardiac myocytes and fibroblasts in Dsg2mut/mut mice were dependent on CCR2+ macrophage recruitment to the heart. These results highlight complex mechanisms of immune injury and regulatory crosstalk between cardiac myocytes, inflammatory cells, and fibroblasts in the pathogenesis of ACM.

Keywords: Arrhythmias; Cardiology; Cardiovascular disease; Immunology; Innate immunity.


Figures
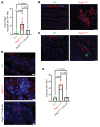
Figure 1
Figure 1. NFκB signaling in cardiac myocytes mobilizes CCR2+ macrophages to the heart.
(A) Quantification of Evans Blue+ cardiac myocytes (per ×20) field in 16-week-old WT (n = 7), Dsg2mut/mut (n = 10) and Dsg2mut/mut × IκBαΔN (n = 5) mice. (B) Representative immunostained myocardium showing CD68+ (violet) cells located in close proximity to Evans Blue+ cardiac myocytes (red). Scale bars: 40 μm. (C) Representative RNA in situ hybridization images (RNAscope) showing CCR2+ (green) cells in close proximity to Evans Blue+ cardiac myocytes (red). Scale bars: 40 μm. (D) Representative RNA in situ hybridization images (RNAscope) showing Ccr2+ (red) cells in 16-week-old mice. Scale bars: 40 μm. (E) Quantification of Ccr2+ cells in mice. WT, n = 10 samples; Dsg2mut/mut, n = 9 samples; Dsg2mut/mut × IκBαΔN, n = 10 samples. Data presented as mean ± SEM; P values inset; determined via 1-way ANOVA with Tukey’s post hoc analysis.
Figure 2
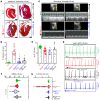
Figure 2. Blocking activation of NFκB signaling in cardiac myocytes mitigates myocardial injury and arrhythmias and preserves cardiac function in Dsg2mut/mut mice.
(A) Representative trichrome-stained hearts from mice at 16 weeks of age (16 wk). Scale bars: 1 mm. (B) Percent (%) fibrosis at 16 wk; WT (n = 18), Dsg2mut/mut (n = 15), Dsg2mut/mut × IκBαΔN (n = 17), and Dsg2mut/mut × Ccr2–/– mice (n = 22). (C) Representative echocardiographs from 16 wk mice; yellow scale bar: 6 mm. (D) Percent left ventricular ejection fraction (%LVEF). Note, preserved cardiac function in Dsg2mut/mut × IκBαΔN mice. WT (n = 49), Dsg2mut/mut (n = 30), Dsg2mut/mut × IκBαΔN (n = 15), and Dsg2mut/mut × Ccr2–/– mice (n = 15). *P < 0.05 any cohort versus WT; P < 0.05 any cohort versus Dsg2mut/mut; P < 0.05 Dsg2mut/mut × Ccr2–/– versus Dsg2mut/mut × IκBαΔN mice; using 1-way ANOVA with Tukey’s posthoc analysis. (E) Representative ECGs from 16 wk mice. Premature ventricular contractions (PVCs) are noted by red arrows. (F and G) QRS duration (QRSd) and percent PVCs (% PVCs), respectively, obtained from signal averaged ECGs. QRSd: WT (n = 49), Dsg2mut/mut (n = 27), Dsg2mut/mut × IκBαΔN (n = 15), and Dsg2mut/mut × Ccr2–/– mice (n = 14). %PVCs: WT (n = 49), Dsg2mut/mut (n = 30), Dsg2mut/mut × IκBαΔN (n = 15), and Dsg2mut/mut × Ccr2–/– mice (n = 15). Data presented as mean ± SEM; *P < 0.05 any cohort versus WT; P < 0.05 any cohort versus Dsg2mut/mut; P < 0.05 Dsg2mut/mut × Ccr2–/– versus. Dsg2mut/mut × IκBαΔN mice; using 1-way ANOVA with Tukey’s post hoc analysis.
Figure 3
Figure 3. NFκB signaling in cardiac myocytes mobilizes inflammatory cells to the heart in Dsg2mut/mut mice.
(A) Representative immunostained myocardial sections from 16-week-old (16 wk) mice showing CD68+ (violet) and Lyve1+ (white) cells. DAPI (blue); Scale bars: 40 μm. (B and C) Quantification of CD68+ cells and Lyve1+ cells as a percentage of CD68+ cells in mice. Data presented as mean ± SEM; n = 10 for WT, Dsg2mut/mut × IκBαΔN and Dsg2mut/mut × Ccr2–/– mice and n = 9 for Dsg2mut/mut mice. *P < 0.05 any cohort versus WT; P < 0.05 any cohort versus Dsg2mut/mut; using 1-way ANOVA with Tukey’s post hoc analysis.
Figure 4
Figure 4. NFκB signaling in cardiac myocytes and actions of CCR2+ cells increase myocardial cytokines levels in Dsg2mut/mut mice.
(A) Representative immunoblots from myocardial cytokine arrays in WT (n = 6), Dsg2mut/mut (n = 6), Dsg2mut/mut × Ccr2–/– (n = 6), and Dsg2mut/mut × IκBαΔN (n = 5) mice. Ref. Band, Reference Band. (BG) Bar graphs comparing levels of selected cytokines normalized to WT hearts. Data presented as mean ± SEM; *P < 0.05 any cohort versus WT; P < 0.05 any cohort versus Dsg2mut/mut; P < 0.05 any cohort versus Dsg2mut/mut × IκBαΔN using 1-way ANOVA with Tukey’s posthoc analysis.
Figure 5
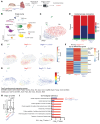
Figure 5. CITE-Seq reveals expansion of CCR2+ inflammatory macrophages in hearts of Dsg2mut/mut mice.
(A) Schematic depicting design of CITE-Seq experiments. Whole hearts from n = 3 mice per condition were homogenized and enzymatically digested. (B) Uniform Manifold Approximation and Projection (UMAP) of 8,775 cells after quality control (QC) and data filtering using standard Seurat pipeline. (C) UMAP reclustering of macrophage/monocyte population. (D) Composition graph showing proportion of different populations within the macrophage/monocyte cluster. (E) Gaussian kernel density estimation of cells within the macrophage/monocyte cluster across the indicated genotypes. (F) Heatmap of top 25 differentially expressed genes in the macrophage/monocyte cluster between WT and Dsg2mut/mut mice with sideby-side comparison of the expression of those same genes from Dsg2mut/mut × Ccr2–/– mice. Example genes are annotated. (G) Z-score feature plot, overlaying an inflammatory gene signature derived from the heatmap in F (genes listed to the side) and displayed on the macrophage/monocyte UMAP projection split by genotype. (H) Graph of Z-score values for inflammatory gene signature derived from heatmap in F compared across genotypes. Data presented as a box-and-whisker plot. The 5 number summary (minimum, 25% IQR, median, 75% IQR, and maximum) as well as total number of values for each group is provided as follows; WT: –0.7688, –0.4471, –0.3135, –0.005451, 1.337, n = 100; Dsg2mut/mut: –0.6884, –0.1186, 0.1394, 0.7270, 1.923, n = 124; Dsg2mut/mut × Ccr2–/–: –0.6941, –0.3559, –0.2186, –0.005207, 1,752, n = 145. P values inset and determined via 1-way ANOVA. (I) Top GO Biological pathways for the top 25 differentially upregulated genes in WT versus. Dsg2mut/mut mice (red) and WT versus Dsg2mut/mut × Ccr2–/– mice (blue) (derived from F).
Figure 6
Figure 6. PostN+ fibroblasts are expanded in Dsg2mut/mut hearts through a CCR2+ monocyte- and macrophage-dependent mechanism.
(A) UMAP re-clustering of fibroblast population. (B) Gaussian kernel density estimation of cells within the fibroblast cluster across the indicated genotypes. (C) Heatmap of top 25 differentially expressed genes in the fibroblast cluster between WT and Dsg2mut/mut mice with sideby-side comparison of the expression of those same genes from Dsg2mut/mut × Ccr2–/– mice. Example genes are annotated. (D) Z-score feature plot, overlaying a fibroblast gene signature derived from the heatmap in C (genes listed to the side) and displayed on the fibroblast UMAP projection, split by genotype. (E) Graph of Z-score values for fibroblast gene signature derived from heatmap in C compared across genotypes. Data presented as a box-and-whisker plot. The 5 number summary (minimum, 25% IQR, median, 75% IQR, and maximum) as well as total number of values for each group is provided as follows; WT: –0.7450, –0.4597, –0.2805, –0.07749, 0.9996, n = 1717; Dsg2mut/mut: –0.6437, –0.008809, 0.2165, 0.4886, 1.611, n = 1675; Dsg2mut/mut × Ccr2–/–: –0.7450, –0.2865, –0.06280, –0.2262, 1,371, n = 2625. P values inset and determined by 1-way ANOVA. (F) Top GO Biological pathways for the top 25 differentially upregulated genes in WT versus Dsg2mut/mut mice (red) and WT versus Dsg2mut/mut × Ccr2–/– mice (blue) (derived from C). (G) Representative immunostained myocardium displaying colocalization of CCR2+ macrophages (green) with Periostin+ (PostN+) fibroblasts (red) at 16 weeks of age. Scale bars: 60 μm. (H) Representative immunostained myocardium depicting PostN+ (red) areas via immunofluorescence staining from mice aged 16 weeks from indicated genotypes. Scale bars: 40 μm. (I) Quantification of PostN+ area as a percentage of total area in mice of the indicated genotypes (P values inset, determined via 1-way ANOVA); WT (n = 5); Dsg2mut/mut (n = 4); and Dsg2mut/mut × Ccr2–/– (n = 4). Data presented as mean ± SEM, n = 4 per cohort, P values inset and determined via 1-way ANOVA.
Figure 7
Figure 7. snRNA-Seq reveals a role for CCR2+ monocytes and macrophages in cardiac myocyte remodeling in ACM.
(A) Schematic depicting design of snRNA-Seq experiments. Frozen whole hearts (n = 3 mice per group) were mechanically homogenized. (B) UMAP of 13,176 nuclei after QC and data filtering using standard Seurat pipeline. (C) UMAP reclustering of cardiac myocyte population. (D) Composition graph showing proportion of different populations within the cardiac myocyte cluster. (E) Gaussian kernel density estimation of cells within the cardiac myocyte cluster across the indicated genotypes. (F) Heatmap of top 25 differentially expressed genes in the cardiac myocyte cluster between WT and Dsg2mut/mut mice with side-by-side comparison of the expression of those same genes from Dsg2mut/mut × Ccr2–/–. Example genes are annotated. (G) Z-score feature plot, overlaying a cardiac myocyte gene signature derived from the heatmap in F (genes listed to the side) and displayed on the cardiac myocyte UMAP projection split by genotype. (H) Graph of Z-score values for cardiac myocyte gene signature derived from heatmap in F compared across genotypes. Data presented as a box-and-whisker plot. The 5 number summary (minimum, 25% IQR, median, 75% IQR, and maximum) as well as total number of values for each group is provided as follows; WT: –0.8992, –0.3708, –0.2077, –0.04161, 0.7185, n = 564; Dsg2mut/mut: –0.5954, –0.01474, 0.2699, 0.6183, 1.742, n = 412; Dsg2mut/mut × Ccr2–/–: –0.8130, –0.2706, –0.08073, –0.1536, 1,705, n = 659. P values inset and determined via 1-way ANOVA. (I) Top GO Biological pathways for the top 25 differentially upregulated genes in WT versus Dsg2mut/mut mice (red) and WT versus Dsg2mut/mut × Ccr2–/– mice (blue) (derived from F).
Figure 8
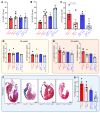
Figure 8. Contractile dysfunction is rescued in Dsg2mut/mut × Ccr2–/– mice via NFκB-inhibition.
(A and B) Percent left ventricular ejection fraction (%LVEF) at 16 (16 wk) and 24 weeks (24 wk) of age in Dsg2mut/mut and Dsg2mut/mut × Ccr2–/– mice treated for 8 weeks with either vehicle (Veh) or the NFκB inhibitor, Bay11-7082 (Bay11; 5 mg/kg/day via continuous infusion at 0.11 μL/h for 8 weeks). Note, preserved cardiac function in Veh-treated Dsg2mut/mut × Ccr2–/– mice, whereas Bay11-treated Dsg2mut/mut × Ccr2–/– mice showed notable improvement in function following 8 weeks of Bay11 treatment. (C) Percent PVCs (%PVCs) at 24 wk. (D and E) Left ventricular internal diameter in diastole (LV diameter;d) and systole (LV diameter;s) at 16 wk and 24 wk in Dsg2mut/mut and Dsg2mut/mut × Ccr2–/– mice treated with either Veh or Bay11. (F) Representative trichrome-stained hearts (Scale bar: 1 mm) and (G) percent (%) fibrosis at 24 wk from Veh-treated Dsg2mut/mut (n = 4) and Dsg2mut/mut × Ccr2–/– mice (n = 4), and Bay11-treated Dsg2mut/mut (n = 5) and Dsg2mut/mut × Ccr2–/– mice (n = 5) at 24 wk. Data presented as mean ± SEM; *P < 0.05 any cohort versus Dsg2mut/mut (Veh); P < 0.05 Bay11-treated mice versus Veh-treated mice within genotype; using 1-way ANOVA with Tukey’s posthoc analysis.

References

    1. Corrado D. Arrhythmogenic right ventricular cardiomyopathy: evaluation of the current diagnostic criteria and differential diagnosis. Eur Heart J. 2020;41(14):1414–1429. doi: 10.1093/eurheartj/ehz669. - DOI - PMC - PubMed
    1. Marcus FI. Diagnosis of arrhythmogenic right ventricular cardiomyopathy/dysplasia: proposed modification of the Task Force Criteria. Eur Heart J. 2010;31(7):806–814. doi: 10.1093/eurheartj/ehq025. - DOI - PMC - PubMed
    1. Corrado D. Spectrum of clinicopathologic manifestations of arrhythmogenic right ventricular cardiomyopathy/dysplasia: a multicenter study. J Am Coll Cardiol. 1997;30(6):1512–1520. doi: 10.1016/S0735-1097(97)00332-X. - DOI - PubMed
    1. Marcus FI. Right ventricular dysplasia: a report of 24 adult cases. Circulation. 1982;65(2):384–398. doi: 10.1161/01.CIR.65.2.384. - DOI - PubMed
    1. Fontaine G. The arrhythmogenic right ventricle. Dysplasia versus cardiomyopathy. Heart Vessels. 1995;10(5):227–235. doi: 10.1007/BF01744901. - DOI - PubMed

MeSH terms