. 2024 Apr 2;19(4):e0298139.
doi: 10.1371/journal.pone.0298139. eCollection 2024.

Gradients of bacteria in the oceanic water column reveal finely-resolved vertical distributions

Affiliations

Gradients of bacteria in the oceanic water column reveal finely-resolved vertical distributions

Rachel C Harbeitner et al. PLoS One. .

Abstract

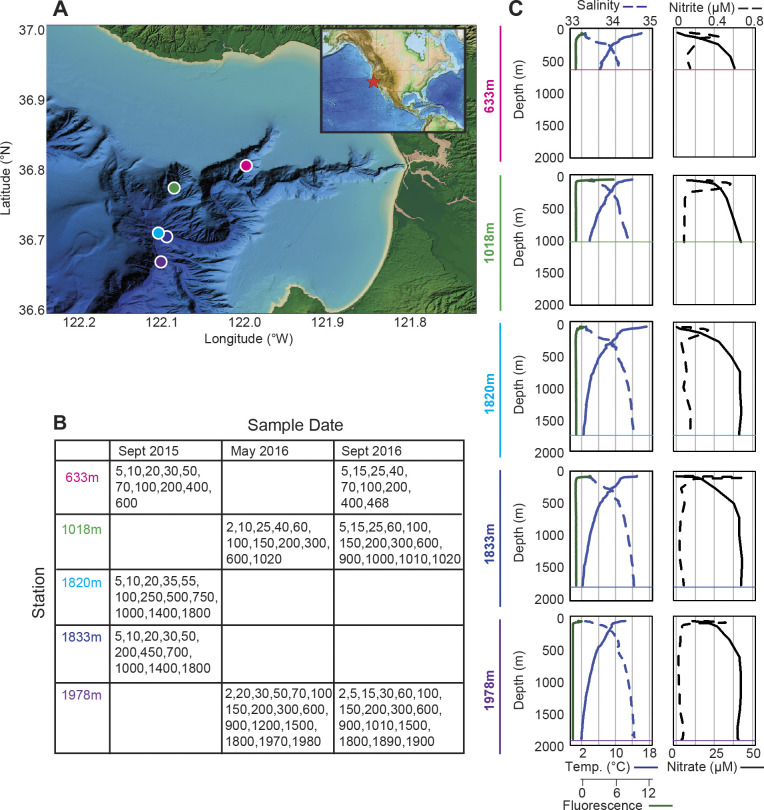
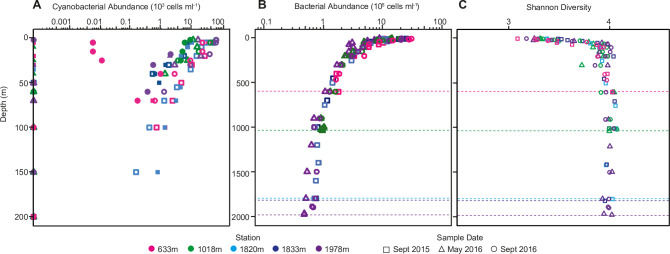
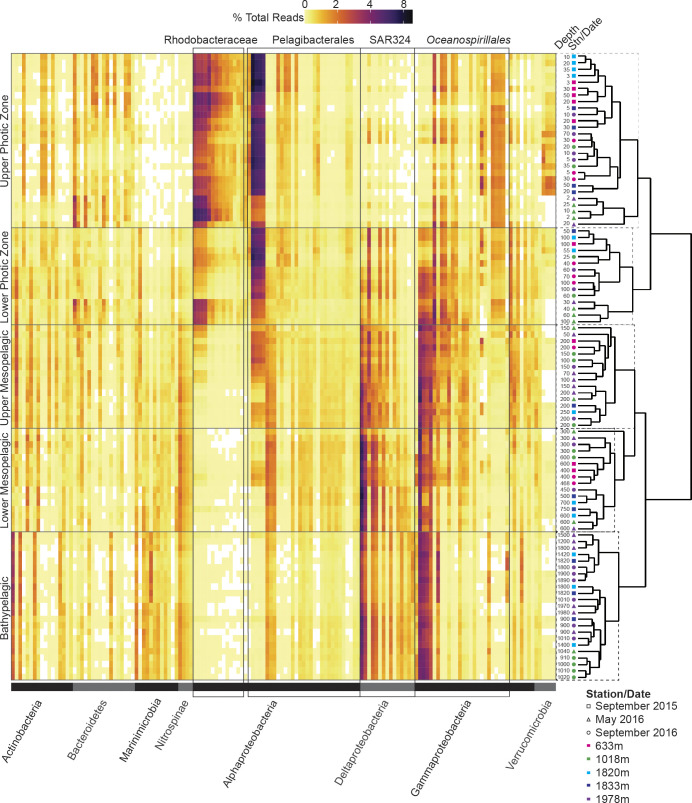
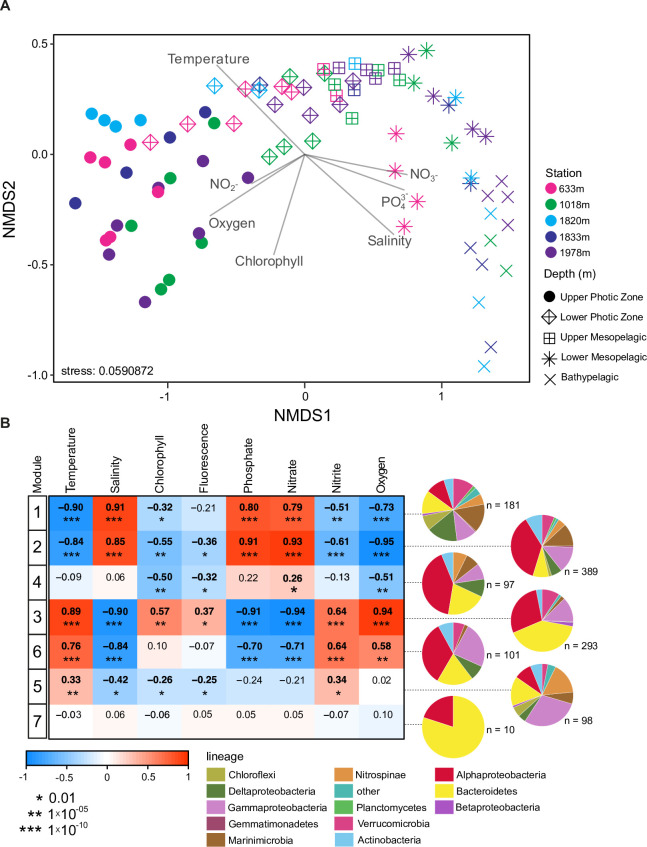
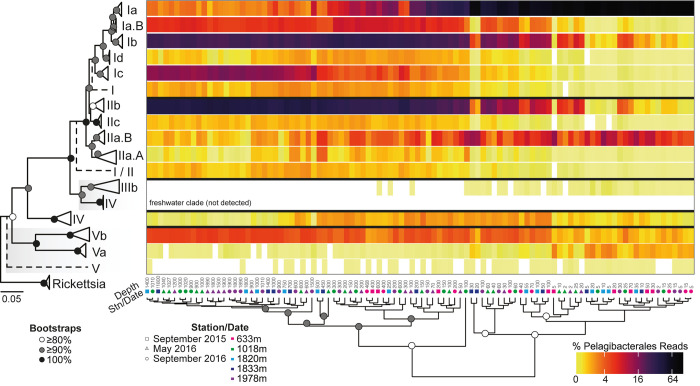
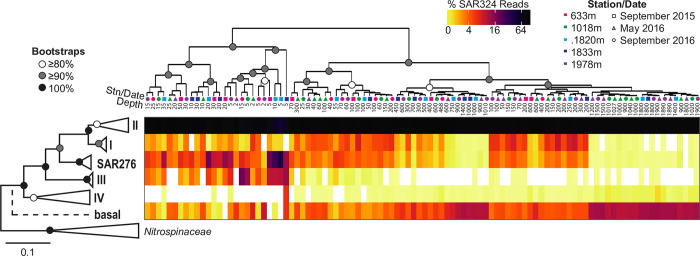
Bacterial communities directly influence ecological processes in the ocean, and depth has a major influence due to the changeover in primary energy sources between the sunlit photic zone and dark ocean. Here, we examine the abundance and diversity of bacteria in Monterey Bay depth profiles collected from the surface to just above the sediments (e.g., 2000 m). Bacterial abundance in these Pacific Ocean samples decreased by >1 order of magnitude, from 1.22 ±0.69 ×10⁶ cells ml-1 in the variable photic zone to 1.44 ± 0.25 ×10⁵ and 6.71 ± 1.23 ×10⁴ cells ml-1 in the mesopelagic and bathypelagic, respectively. V1-V2 16S rRNA gene profiling showed diversity increased sharply between the photic and mesopelagic zones. Weighted Gene Correlation Network Analysis clustered co-occurring bacterial amplicon sequence variants (ASVs) into seven subnetwork modules, of which five strongly correlated with depth-related factors. Within surface-associated modules there was a clear distinction between a 'copiotrophic' module, correlating with chlorophyll and dominated by e.g., Flavobacteriales and Rhodobacteraceae, and an 'oligotrophic' module dominated by diverse Oceanospirillales (such as uncultured JL-ETNP-Y6, SAR86) and Pelagibacterales. Phylogenetic reconstructions of Pelagibacterales and SAR324 using full-length 16S rRNA gene data revealed several additional subclades, expanding known microdiversity within these abundant lineages, including new Pelagibacterales subclades Ia.B, Id, and IIc, which comprised 4-10% of amplicons depending on the subclade and depth zone. SAR324 and Oceanospirillales dominated in the mesopelagic, with SAR324 clade II exhibiting its highest relative abundances (17±4%) in the lower mesopelagic (300-750 m). The two newly-identified SAR324 clades showed highest relative abundances in the photic zone (clade III), while clade IV was extremely low in relative abundance, but present across dark ocean depths. Hierarchical clustering placed microbial communities from 900 m samples with those from the bathypelagic, where Marinimicrobia was distinctively relatively abundant. The patterns resolved herein, through high resolution and statistical replication, establish baselines for marine bacterial abundance and taxonomic distributions across the Monterey Bay water column, against which future change can be assessed.


Conflict of interest statement

The author have declared that no competing interests exist.

Figures

Fig 1
Fig 1. Sampling locations and environmental characteristics throughout the water column.
(A) Seafloor bathymetry is indicated in the region of sampling (Monterey Bay) with stations indicated (circles). The inset shows the location of the sampling region within a broader context of the eastern North Pacific. (B) Table of sampling periods for the individual stations (see S1 Table for latitudes, longitude, and other metadata). The depths listed indicate those for which sequencing was performed (16S V1-V2 rRNA gene amplicons). (C) Temperature, salinity, and in vivo chlorophyll fluorescence (left panels) and nitrate and nitrite (right panels) representative profiles from each site. Data for these and additional profiles and parameters are provided in the supplementary tables.
Fig 2
Fig 2. Abundance and diversity of bacteria and cyanobacteria across depth and sample periods.
(A) Cell abundance of Prochlorococcus (closed symbols) and Synechococcus (open symbols) in the upper 200 m as enumerated by flow cytometry; cyanobacterial cells were not detected below this depth. (B) Heterotrophic bacterial cell abundance (i.e., non-pigmented; analyzed by flow cytometry after SYBR Green I staining) decreased with depth by 1.5 orders of magnitude. Replicates from individual sampling dates revealed a variance of 16% (n = 8) that can be attributed to methodology. (C) Shannon diversity indices for all sequenced samples and depth profiles as calculated from V1-V2 16S rRNA gene ASV data. September 2015 (squares), May 2016 (triangles), and September 2016 (circles) sampling dates are indicated, while stations are represented by color for all panels. Horizontal dotted lines (plots B and C) represent the bottom depth for the respective stations.
Fig 3
Fig 3. Community and taxonomic patterns in bacterial communities along the depth gradient.
The right side shows hierarchical clustering performed on Bray-Curtis dissimilarities of bacterial communities based on the 1000 most relatively abundant ASVs of bacteria (both non-photosynthetic and cyanobacteria (i.e., photosynthetic); see S4 Fig for non-photosynthetic bacteria only). Stations (color) and sampling dates (shape) are indicated as is the depth sampled (m). The left side shows relative abundance of the 50 most relatively abundant ASVs (columns) per sample from the five main depth zones as defined herein. Ordering along the X-axis is by phyla (indicated by horizontal gray bars at the base of figure) and rows represent individual water samples–corresponding to those immediately adjacent (i.e., to the right). ASV relative abundances, sequences, and taxonomic classification are detailed in S3 Table. The four groups with the overall highest relative abundances are indicated (boxes overlaying heat map) and were alphaproteobacterial ASVs assigned to the Rhodobacteraceae and Pelagibacterales Ia in the photic zone, whereas in mesopelagic and bathypelagic samples ASVs from SAR324 and Gammaproteobacteria Oceanospirillales exhibited the highest relative abundances. Taxonomic assignment for ASVs is based on the SILVA database.
Fig 4
Fig 4. Bacterial community and ASV relationships with habitat.
(A) NMDS exploring the relationship between communities within samples from the five refined depth zones (see Fig 3) and environmental parameters. (B) Pearson correlations relating to untransformed environmental physiochemical parameters to the eigengene (first principal component of the abundance matrix) of each WGCNA module. Positive relationships are in red and negative relationships are in blue (as indicated by the color bar). The top number is the Pearson correlation value and asterisks in parenthesis represent the P-value for each relationship. Bolded numbers are significant correlations (P<0.01; *, <0.01; **, <1x10⁻⁵; ***, <1x10⁻¹⁰). Relationships were examined between the 7 modules and temperature (°C), salinity (PSU), chlorophyll (mg m-3), fluorescence, phosphate (μM), nitrate (μM), nitrite (μM), and oxygen (mg L-1). Pie charts show the taxonomic groups within each of the 7 modules of co-occurring bacterial ASVs that emerged from WGCNA based on taxonomy assigned using the SILVA database (S4 Table).
Fig 5
Fig 5. Phylogeny and distributions of Pelagibacterales.
The 16S rRNA gene phylogenetic reconstruction utilized full-length sequences and identifies 10 recognized subclades and 3 previously unrecognized subclades, all with bootstrap support >90% (1,000 replicates) except subclade IIb (86% support; see also S4 Fig). Note that dashed lines indicate LCA placements at unsupported nodes, some with relatively few amplicons. For example, that demarked ‘Clade V’—with a dashed line comprised >0.01% of amplicons . Some others with dashed lines were notable, but lacked full length sequences and therefore references sequences were not in the reconstruction. Also shown is the relative abundance of Pelagibacterales subclades as percent of all Pelagibacterales ASVs in each sample for the Monterey Bay Stations and depths sampled. Pelagibacter amplicons were first retrieved using PhyloAssigner and a global 16S rRNA gene reference tree [17]. These amplicons were then run in PhyloAssigner using the above Pelagibacterales reference tree. Heat map columns represent individual samples ordered by hierarchical clustering based on the Bray-Curtis similarities of the Pelagibacterales community composition. White in the heat map indicates not detected. Stations (color) and sampling dates (shape) are indicated as is sample depth (m) for each column.
Fig 6
Fig 6. SAR324 16S rRNA gene reference tree identifies novel clades and distributions.
Shown is the ML reconstruction with percent relative abundance of SAR324 clade members out of total SAR324 amplicons at the study sites shown to the right of the tree topology. All clades retained support >90% apart from clades II and IV (82 and 88%, respectively; see also S5 Fig). Amplicons were phylogenetically placed on the SAR324 reconstruction developed herein using PhyloAssigner [17] after initial assignment and retrieval using a global 16S rRNA gene reference tree [17]. Heat map columns represent individual samples ordered by hierarchical clustering based on the Bray-Curtis similarities of the SAR324 composition. White in the heat map indicates not detected. Stations (color) and sampling dates (shape) are indicated as is sample depth (m) for each column.

References

    1. Zinger L, Amaral-Zettler LA, Fuhrman JA, Horner-Devine MC, Huse SM, Welch DBM, et al.. Global Patterns of Bacterial Beta-Diversity in Seafloor and Seawater Ecosystems. PLoS One 2011; 6: e24570. doi: 10.1371/journal.pone.0024570 - DOI - PMC - PubMed
    1. Sunagawa S, Coelho LP, Chaffron S, Kultima JR, Labadie K, Salazar G, et al.. Structure and function of the global ocean microbiome. Science (1979) 2015; 348: 1261359. - PubMed
    1. Cram JA, Chow C-ET, Sachdeva R, Needham DM, Parada AE, Steele JA, et al.. Seasonal and interannual variability of the marine bacterioplankton community throughout the water column over ten years. ISME J 2015; 9: 563–580. doi: 10.1038/ismej.2014.153 - DOI - PMC - PubMed
    1. Brown M V, Philip GK, Bunge JA, Smith MC, Bissett A, Lauro FM, et al.. Microbial community structure in the North Pacific ocean. ISME J 2009; 3: 1374–1386. doi: 10.1038/ismej.2009.86 - DOI - PubMed
    1. Walsh EA, Kirkpatrick JB, Rutherford SD, Smith DC, Sogin M, Hondt SD. Bacterial diversity and community composition from seasurface to subseafloor. ISME J 2016; 10: 979–989. doi: 10.1038/ismej.2015.175 - DOI - PMC - PubMed