. 2024 Apr 9;121(15):e2400675121.
doi: 10.1073/pnas.2400675121. Epub 2024 Apr 2.

The IRG1-itaconate axis protects from cholesterol-induced inflammation and atherosclerosis

Affiliations

The IRG1-itaconate axis protects from cholesterol-induced inflammation and atherosclerosis

Yannick Cyr et al. Proc Natl Acad Sci U S A. .

Abstract

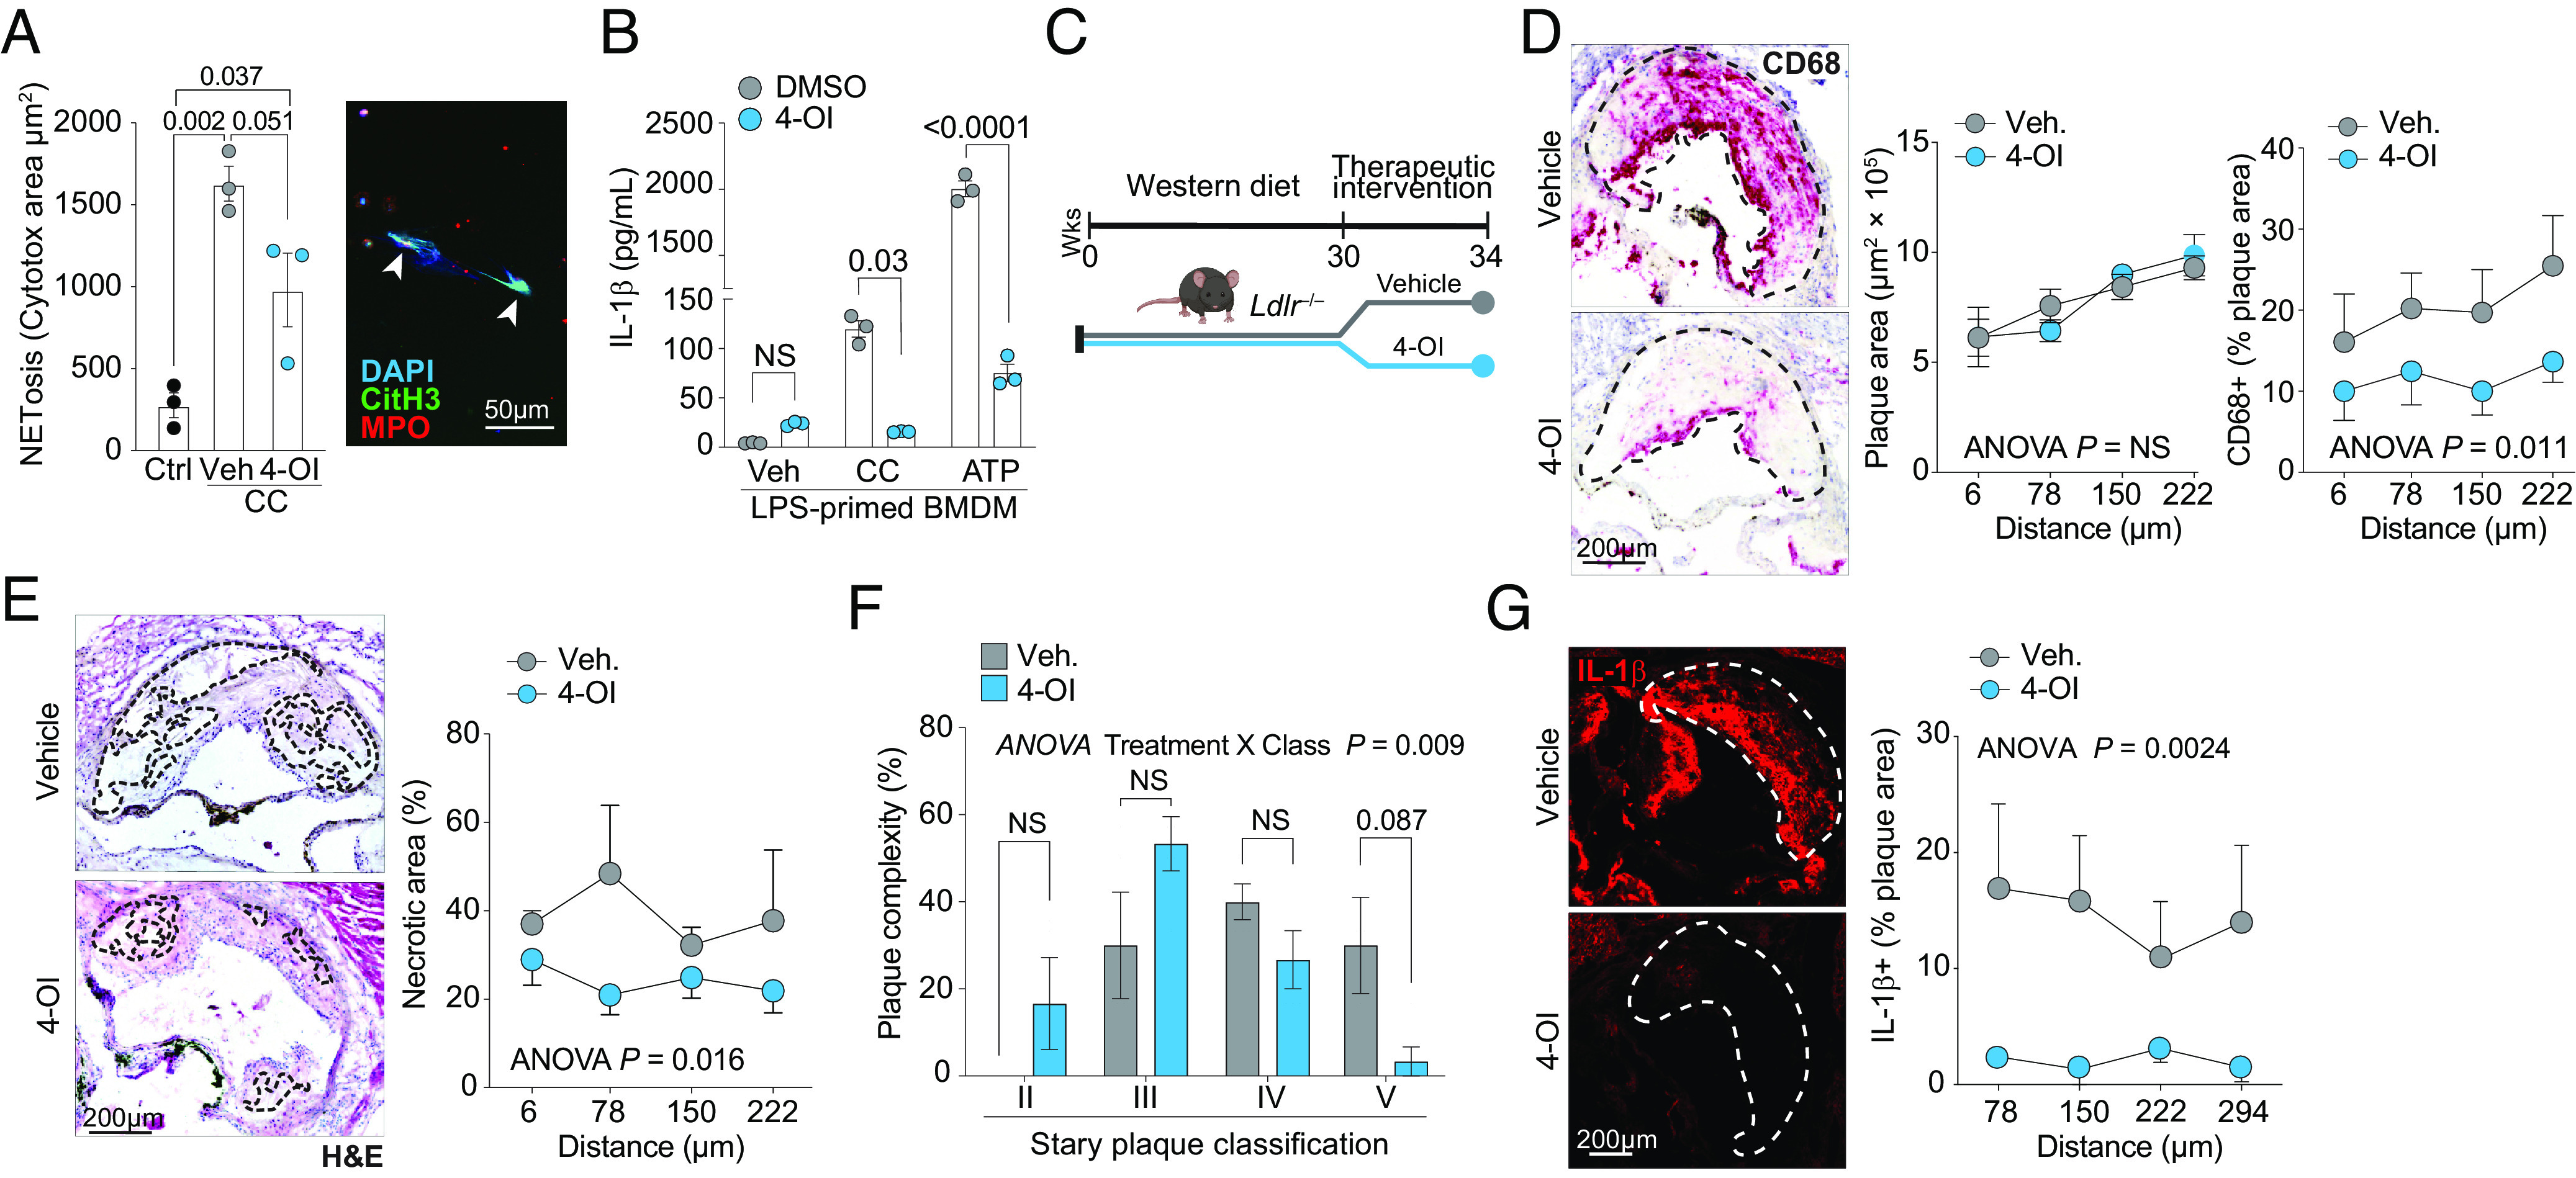
Atherosclerosis is fueled by a failure to resolve lipid-driven inflammation within the vasculature that drives plaque formation. Therapeutic approaches to reverse atherosclerotic inflammation are needed to address the rising global burden of cardiovascular disease (CVD). Recently, metabolites have gained attention for their immunomodulatory properties, including itaconate, which is generated from the tricarboxylic acid-intermediate cis-aconitate by the enzyme Immune Responsive Gene 1 (IRG1/ACOD1). Here, we tested the therapeutic potential of the IRG1-itaconate axis for human atherosclerosis. Using single-cell RNA sequencing (scRNA-seq), we found that IRG1 is up-regulated in human coronary atherosclerotic lesions compared to patient-matched healthy vasculature, and in mouse models of atherosclerosis, where it is primarily expressed by plaque monocytes, macrophages, and neutrophils. Global or hematopoietic Irg1-deficiency in mice increases atherosclerosis burden, plaque macrophage and lipid content, and expression of the proatherosclerotic cytokine interleukin (IL)-1β. Mechanistically, absence of Irg1 increased macrophage lipid accumulation, and accelerated inflammation via increased neutrophil extracellular trap (NET) formation and NET-priming of the NLRP3-inflammasome in macrophages, resulting in increased IL-1β release. Conversely, supplementation of the Irg1-itaconate axis using 4-octyl itaconate (4-OI) beneficially remodeled advanced plaques and reduced lesional IL-1β levels in mice. To investigate the effects of 4-OI in humans, we leveraged an ex vivo systems-immunology approach for CVD drug discovery. Using CyTOF and scRNA-seq of peripheral blood mononuclear cells treated with plasma from CVD patients, we showed that 4-OI attenuates proinflammatory phospho-signaling and mediates anti-inflammatory rewiring of macrophage populations. Our data highlight the relevance of pursuing IRG1-itaconate axis supplementation as a therapeutic approach for atherosclerosis in humans.

Keywords: atherosclerosis; immunometabolism; innate immunity; macrophage; neutrophil.


Conflict of interest statement

Competing interests statement:K.J.M. is on the scientific advisory Board of Beren Therapeutics and Bitterroot Bio. K.J.M. and A.M.S. have patents and patent applications through NYU Grossman School of Medicine that have been submitted/published and that are not related to the work detailed in this manuscript. The other authors declare no conflict of interest.

Figures

Fig. 1.
Fig. 1.
IRG1 is expressed in plaque immune cells and wanes with atherosclerosis progression in humans and mice. (AD) Experimental outline of scRNA-seq of human coronary fibroatheroma (FA) or patient-matched regions of adaptive intimal thickening (AIT) (A, Left). Average IRG1 normalized expression (NE) in immune and nonimmune populations by disease pathology (A, Right). Average IRG1 NE by immune cell type (B). Uniform Manifold Approximation and Projection (UMAP) visualization of myeloid cells from human coronary plaques stratified by cell type (C) or showing IRG1 NE (D), n = 3,556 cells; Mono/Mø, monocyte/macrophage; DC, dendritic cell; NK, natural killer; ILC, innate lymphoid cell. (E) Immunofluorescent staining showing colocalization (arrows) of CD68 and IRG1 in human coronary plaque, (F) UMAP visualization of myeloid cell clusters from scRNA-seq of the aortic arch of male and female Ldlr–/– mice fed a WD for 16 wk (Left), with violin plot showing Irg1 expression (Right) (n = 8,669 cells). (G) Immunofluorescent staining for IRG1 and Mono/Mø (CD68, Left) or neutrophils (Ly6G, Right) in aortic root plaques of Ldlr–/– mice fed WD (12 wk). Arrows indicate staining colocalization. (H) Quantification of plaque IRG1+ cells along the aortic root of WD-fed Ldlr–/– male mice. P-values calculated by one-way ANOVA with Tukey’s multiple-comparison test. (I) Normalized gene expression matrix showing the 500 most DEG between Irg1 expressing (Irg1+) and nonexpressing (Irg1) myeloid cells by cluster. (J) Volcano plot of genes differentially expressed between Irg1+ and Irg1 myeloid cells, with predicted pathways and upstream regulators. Dashed lines indicate fold change |Log2| ± 0.5. (AD) n = 2 patients, matched for AIT and FA; (F, I, and J) n = 10; 5 mice/sex, (H) n = 8 to 9 mice/group.
Fig. 2.
Fig. 2.
Genetic deletion of Irg1 aggravates atherosclerosis development. (A) Targeted metabolomic measurements and (B) absolute quantification of itaconate in BMDMs treated with aggregated (ag)LDL or oxidized (ox)LDL (50 µg/mL, 24 h). (C) Irg1 mRNA levels in BMDMs stimulated with agLDL and oxLDL for 8 h. (DG) Aortic root plaques of male WT and Irg1–/– mice treated with PCSK9-AAV and WD (12 wk), showing representative staining and quantification of IRG1 (D), H&E stain and plaque area through the aortic root (E), CD68 (F), and BODIPY neutral lipid stain (G). (HK) scRNA-seq analysis of CD45+ cells isolated from the aortic arch of WT and Irg1–/– male mice treated with PCSK9-AAV and WD (16 wk) visualized by UMAP (H); bar plot showing frequency of myeloid cell subpopulations (I); Differential gene expression in myeloid subpopulations between WT and Irg1–/– mice (Left), with predicted canonical pathways altered in Irg1–/– vs. WT Lyve1+ Mø (J); and chord diagram of predicted IL10–IL10ra signaling in WT Lyve1+ Mø (Left) and communication strength (Right) (K). P-values calculated by (B) one ANOVA with Tukey’s multiple-comparison test; (C, F, G, and I) Student’s t test; (E) two-way ANOVA; (K) Kolmogorov–Smirnov test. (B) n = 2 mice/group; (C) n = 3 mice/group; (DF) n = 10 to 14 mice/group; (G) n = 7 to 8 mice/group; and (H) n = 5 mice/group.
Fig. 3.
Fig. 3.
Myeloid Irg1 expression protects against atherosclerosis development. (A and B) Aortic root plaques of male and female Ldlr–/– mice reconstituted with bone marrow from WT (WT → Ldlr–/–) or Irg1–/– (Irg1–/–Ldlr–/–) mice and fed WD (12 wk), showing representative staining and quantification of (A) H&E and plaque area through the aortic root, and (B) CD68 and BODIPY neutral lipid stain in male mice. (C) Neutral lipid accumulation in BMDMs from WT or Irg1–/– mice treated with oxLDL (50 µg/mL, 48 h) as assessed by BODIPY staining and quantification of relative fluorescence intensity (RFU). (DG) Immunostaining and quantification of (D) ACTA2, (E) CD68 to ACTA2 ratio, (F) necrotic area, and (G) IL-1β in aortic root plaques of WT → Ldlr–/– or Irg1–/–Ldlr–/– male mice. (H) Quantification of IL-1β secretion in BMDMs from WT and Irg1–/– mice primed with LPS (10 ng/mL, 4 h) and activated with CC (500 µg/mL, 8 h). P-values were calculated by (A) two-way ANOVA for group differences (genotypes), (BG) Student’s t test, (H) two-way ANOVA with Sidak’s multiple-comparison test. (A, B, and DG) n = 13 to 14 mice/group/sex. (C) n = 3 individual mouse/group.
Fig. 4.
Fig. 4.
Irg1 mitigates proinflammatory cross-talk between macrophages and neutrophils. (A) Representative staining and quantification for the extracellular trap markers citrunillated-H3 (CitH3) and myeloperoxidase (MPO) in aortic root plaques from male WT and Irg1–/– mice fed WD (12 wk). (B) Visualization of NETosis with Cytotox DNA dye and quantification per field of view (FOV, 4 FOV/well in triplicates) in bone marrow-derived neutrophils from WT and Irg1–/– mice stimulated with vehicle or PMA (100 nM, 4 h). (C) Quantification of NET-DNA extrusion from WT or Irg1–/– neutrophils treated with CC (500 µg/mL, 4 h). (D) Schematic of proposed pathway showing priming of macrophages by CC-induced NETs, leading to CC-induced inflammasome activation and IL-1β release. (E) qRT-PCR quantification of NLRP3-inflammasome priming genes in WT and Irg1–/– BMDM treated with NET-DNA from neutrophils exposed to CC. (F) Quantification of IL-1β secretion in WT and Irg1–/– BMDM primed with CC-induced NET-DNA and then activated with CC (500 µg/mL, 24 h). P-value calculated by (A and C) Student’s t test; (B, E, and F) two-way ANOVA with Sidak’s MCT. (A) n = 6 to 12 mice, (BF) n = 3 individual mouse/group.
Fig. 5.
Fig. 5.
Itaconate reduces atherogenic inflammation and remodels the atherosclerotic plaque. (A) Representative NETosis imaging showing colocalization (arrows) of citrunillated-H3 (CitH3) and DNA (DAPI) around a neutrophil (MPO), and quantification by IncuCyte live cell imaging in bone marrow-derived neutrophils untreated (Ctrl) or pretreated with 4-OI (500 µM, 1 h) and stimulated with CC (500 µg/mL, 4 h). (B) IL-1β secretion by LPS-primed BMDM pretreated with vehicle or 4-OI (250 µM, 1 h) and activated with CC (500 µg/mL, 8 h) or ATP (5 mM, 2 h) as a positive control. (C) Experimental design of 4-OI therapeutic intervention in Ldlr–/– male mice fed WD for 34 wk and injected interperitoneally during the last 4 wk of diet with 4-OI (25 mg/kg) or vehicle (7.5% DMSO). (D) Representative CD68 staining and quantification in aortic root plaques of 4-OI or vehicle-treated mice. (E) Representative H&E staining and quantification of the necrotic area in aortic root plaques of 4-OI or vehicle-treated mice. (F) Histological classification of aortic root plaques according to Stary: II, moderate lesions; III, preatheroma; IV, atheroma; V, fibroatheroma. (G) Representative IL-1β immunostaining and quantification in aortic root plaques of 4-OI or vehicle-treated mice. P-value calculated by (A) one-way ANOVA with Tukey’s MCT; (B) two-way ANOVA with Sidak’s MCT; (D, E, and G) two-way ANOVA with group differences (treatment), (F) two-way ANOVA with interaction between Stary classification and treatment.
Fig. 6.
Fig. 6.
Itaconate derivative reduces CVD plasma-associated inflammation. (A) Schematic of experimental design. Human PBMCs isolated from healthy donors were treated with vehicle (Veh) or plasma from patients with CVD (plasma, n = 4), with or without pretreatment with 4-OI (250 µM; CVD plasma + 4-OI), and subjected to phospho-cytometry by time-of-flight (phospho-CyTOF) and scRNA-seq. (B) Representative viSNE plot of PBMCs showing major immune cell subsets based on canonical expression marker. (C and D) Representative viSNE visualization of pCREB and pS6 levels in major immune cell subsets (C), and heatmap of phosphorylation levels in CD14+, CD16+, and CD14/16+ monocyte populations (D) quantified by phospho-CyTOF. (E) t-Statistics visualization of monocyte-specific phosphorylation, with positive values outside the gray box indicating significant upregulation and negative value downregulation comparing CVD plasma to vehicle (Top), or CVD plasma + 4-OI treatment vs. CVD plasma (Bottom). (F) UMAP visualization of myeloid PBMCs analyzed by scRNA-seq (Left) and frequency of cell populations identified, stratified by treatment group. (G) Average IRG1 expression by cell type. NE = normalized expression. (H) Venn diagram depicting shared DEG between vehicle vs. CVD plasma, and CVD plasma + 4-OI vs. CVD plasma in CD163+ Mø and PLIN2+ Mø (Left) with canonical pathway enrichment analyses of DEGs (Right). (I) Normalized gene expression matrix showing differential transcriptional signature for NRF2 and neutrophil degranulation pathways between treatment groups in indicated myeloid populations. (J) Chord diagram of predicted IL10-IL10RA signaling between PBMC populations treated with CVD plasma (Left) or CVD plasma + 4-OI (Right). (E) t-Statistics significance threshold set at ±1.638 (df: 3, P < 0.1); (F) P-value by one-way ANOVA. n = 4 independent plasma samples per condition.

References

    1. Libby P., Inflammation during the life cycle of the atherosclerotic plaque. Cardiovasc. Res. 117, 2525–2536 (2021). - PMC - PubMed
    1. Soehnlein O., Libby P., Targeting inflammation in atherosclerosis–From experimental insights to the clinic. Nat. Rev. Drug Discov. 20, 589–610 (2021). - PMC - PubMed
    1. Moore K. J., et al. , Macrophage trafficking, inflammatory resolution, and genomics in atherosclerosis JACC macrophage in CVD series (part 2). J. Am. Coll. Cardiol. 72, 2181–2197 (2018). - PMC - PubMed
    1. Soehnlein O., Multiple roles for neutrophils in atherosclerosis. Circ. Res. 110, 875–888 (2012). - PubMed
    1. Sheedy F. J., et al. , CD36 coordinates NLRP3 inflammasome activation by facilitating intracellular nucleation of soluble ligands into particulate ligands in sterile inflammation. Nat. Immunol. 14, 812–820 (2013). - PMC - PubMed