. 2024 Apr 9;121(15):e2321502121.
doi: 10.1073/pnas.2321502121. Epub 2024 Apr 2.

Transcriptional elongation control of hypoxic response

Affiliations

Transcriptional elongation control of hypoxic response

Shimaa Hassan AbdelAziz Soliman et al. Proc Natl Acad Sci U S A. .

Abstract

The release of paused RNA polymerase II (RNAPII) from promoter-proximal regions is tightly controlled to ensure proper regulation of gene expression. The elongation factor PTEF-b is known to release paused RNAPII via phosphorylation of the RNAPII C-terminal domain by its cyclin-dependent kinase component, CDK9. However, the signal and stress-specific roles of the various RNAPII-associated macromolecular complexes containing PTEF-b/CDK9 are not yet clear. Here, we identify and characterize the CDK9 complex required for transcriptional response to hypoxia. Contrary to previous reports, our data indicate that a CDK9 complex containing BRD4 but not AFF1/4 is essential for this hypoxic stress response. We demonstrate that BRD4 bromodomains (BET) are dispensable for the release of paused RNAPII at hypoxia-activated genes and that BET inhibition by JQ1 is insufficient to impair hypoxic gene response. Mechanistically, we demonstrate that the C-terminal region of BRD4 is required for Polymerase-Associated Factor-1 Complex (PAF1C) recruitment to establish an elongation-competent RNAPII complex at hypoxia-responsive genes. PAF1C disruption using a small-molecule inhibitor (iPAF1C) impairs hypoxia-induced, BRD4-mediated RNAPII release. Together, our results provide insight into potentially targetable mechanisms that control the hypoxia-responsive transcriptional elongation.

Keywords: RNA polymerase II; chromatin; epigenetic mechanisms; gene expression; transcription.


Conflict of interest statement

Competing interests statement:The authors declare no competing interest.

Figures

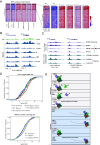
Fig. 1.
Fig. 1.
Identification of the hypoxia-specific RNAPII protein interactome in DLD-1 cells. (A) RNA-seq expression levels of genes identified as differentially expressed (N = 198, adj. P-value ≤ 0.05, |log2FC| ≥ 1) in DLD-1 cells cultured under normoxic (21% O2) or hypoxic (1% O2) conditions for 6 h. Gene expression is represented as standardized log2(x + 1) counts. (B) UCSC genome browser track visualization of RNA-seq signal at the example genes Hexokinase 2 (HK2) and Enolase 2 (ENO2) in DLD-1 cells [cultured as in (A)]. RPM: Reads Per Million. (C) Schematic of RNAPII purification from the nuclear extracts of normoxic or hypoxic DLD-1 cells, analyzed by mass spectrometry. (D) Volcano plot of Log2FC in the abundance of proteins within the hypoxic vs. normoxic RNAPII interactomes. Colored dots represent hits with significantly higher (red) or lower (blue) RNAPII binding in hypoxic vs. normoxic conditions. Differentially bound hits were selected using a LogFC threshold >1.00, P value < 0.05.
Fig. 2.
Fig. 2.
Acute depletion of BRD4 but not AFF1/4 impairs hypoxia-induced transcriptional program. (A) RNA-seq expression levels of genes identified as differentially expressed under hypoxia in AID-tagged AFF1/4 DLD-1 cells grown for 6 h under either normoxic or hypoxic conditions. Gene expression is represented as standardized log2(x + 1) counts. N = 198, NT: Nontreated. (B) Immunoblot analysis of HIF-1β protein levels in nontargeting gRNA control and HIF-1β KO DLD-1 cells. Samples were loaded in 1:2 ratio. Heat Shock Protein 90 (HSP90) is used as loading control. (C) Violin plot for log2 ratio of hypoxic vs. normoxic levels of HIF-dependent genes in each indicated treatment/genotype. N = 110 genes. (D) UCSC genome browser track visualization of RNA-seq signal at the example gene Enolase 2 (ENO2) in pIAA7-tagged BRD4 and AID-tagged AFF1/4 DLD-1 cells. RPM: Reads Per Million.
Fig. 3.
Fig. 3.
A BRD4- but not AFF1/4-containing CDK9 complex is required for hypoxia-induced transcriptional activation. (A) Schematic of DLD-1 cell treatment with either 250 nM dBET6 or 1 μM KL2 for 2 h, followed by 6 h of normoxic or hypoxic culture prior to RNAPII ChIP-Seq to assess RNAPII release. (B) UCSC genome browser visualization of RNAPII ChIP-Seq signal in response to the indicated treatments at the example hypoxia-responsive gene ADM. RPM: Reads Per Million. (C) Boxplot of log2 average RNAPII ChIP-seq signal (hypoxic vs. the nontreated normoxic condition) within the gene bodies of hypoxia-released genes in each indicated treatment. NT: nontreated. N = 705 genes. The P-value was calculated using the Wilcoxon rank test. (D) UCSC genome browser visualization of RNAPII pSer2 ChIP-Seq signal at the hypoxia response gene ENO1 in control or auxin-treated BRD2, BRD3, and BRD4-AID lines under hypoxia. Auxin treatment was performed 2 h prior to hypoxic culture at 1% O2 for 6 h. RPM: Reads Per Million. (E) Global difference plot for hypoxic RNAPII pSer2 ChIP-Seq signal in the auxin treated vs. nontreated condition for each AID line. NT: nontreated, TSS: transcription start site, TES: transcription end site.
Fig. 4.
Fig. 4.
BRD4 bromodomains are dispensable for hypoxia-induced transcriptional activation. (A) Schematic of FLAG-tagged BRD4 mutant constructs expressed in pIAA7-tagged BRD4 cells under the control of a doxycycline-inducible promoter. FL: Full length, ΔBD: dual bromodomain deletion, ΔCTM: C-terminal Motif deletion, C: C-terminal fragment. Number of amino acid residues is indicated. (B) RNA-seq expression heatmap of genes identified as differentially expressed under hypoxic vs. normoxic conditions, shown in each of the BRD4 mutant constructs, in comparison with HIF-1β KO and control cells. Gene expression is represented as standardized log2(x + 1) counts. N = 198 genes. N: Normoxia, H: Hypoxia. (C) UCSC genome browser visualization of hypoxic RNA-seq signal at the hypoxia-activated genes ADM and DDIT4 for each of the BRD4 mutant constructs. RPM: Reads Per Million. (D) RNA-seq expression heatmaps of pIAA7-tagged BRD4 cells treated with either auxin or JQ1 (10 μM) for 3 h followed by 6 h of exposure to normoxic or hypoxic conditions. Gene expression is represented as standardized log2(x + 1) counts. (E) UCSC genome browser visualization of RNA-seq signal at the hypoxia-activated genes ADM and DDIT4 upon JQ1 treatment under normoxia or hypoxia. RPM: Reads Per Million. (F) Venn-diagram for genes significantly impaired under hypoxia (|log2FC| > 1) following BRD4 depletion using auxin vs. bromodomain deletion or inhibition using 10 μM of JQ1 treatment.
Fig. 5.
Fig. 5.
Bromodomain-independent regulation of RNAPII pause release at hypoxia-up-regulated genes by the BRD4-containing CDK9 complex. (A) RNAPII ChIP-Seq signal at the hypoxia-induced example gene DDIT4 in WT and BRD4 C mutant-expressing DLD-1 cells. RPM: Reads Per Million. (B) Empirical cumulative distribution function (ECDF) plot illustrating log2 Full Gene Body Coverage (GBC) for RNAPII occupancy within gene bodies normalized by length in each indicated cell/treatment. N = 597 hypoxia-released genes. (C) UCSC genome browser visualization of ChIP-seq signal for CDK9 and cyclinT1 (CCNT1) in WT or BRD4-depleted cells cultured under normoxic or hypoxic conditions for 6 h in comparison to the ChIP-seq signal for BRD4 in BRD4 C mutant-expressing cells cultured under hypoxic conditions at the example genes ADM and LDHA. RPM: Reads Per Million. (D) Global occupancy heatmaps for CCNT1 and CDK9 at 597 hypoxia-released genes in indicated line/treatment (Left) in comparison to global occupancy heatmaps for BRD4 in C mutant-expressing cells (Right). (E) Pie chart of annotated global localization sites for the BRD4 C-terminal-only mutant construct following 6 h of hypoxic culture. The percentage of total C mutant localization is indicated for each annotated site type.
Fig. 6.
Fig. 6.
iPAF1C impairs bromo-less BRD4-dependent RNAPII elongation in response to hypoxia. (A) Heat maps for Log2FC PAF1 chromatin occupancy at 481 PAF1-occupied genes in the indicated cell lines. Gene clusters highly occupied by PAF1 (n = 155) were used to assess BRD4 domains/regions required for PAF1 chromatin recruitment. FL: full length, ΔBD: dual bromodomain deletion, ΔCTM: C-terminal motif deletion, C: C-terminal fragment. (B) PAF1 ChIP-seq signal at the hypoxia-induced example genes LDHA and ADM. DLD-1 cells expressing different BRD4 mutant constructs were cultured for 6 h in normoxic or hypoxic conditions following the indicated treatments. RPM: reads per million. (C) ChIP-seq signal for PAF1 and RNAPII at the hypoxia-induced example gene ADM. Cells were treated with either 500 μM auxin for 2 h or with 20 μM iPAF1C or DMSO for 6 h prior to culture for 6 h in normoxic or hypoxic conditions. RPM: reads per million. ChIP-Seq signals are spike-in normalized using drosophila S2 cells. (D) Empirical cumulative distribution function (ECDF) plot illustrating log2 Full Gene Body Coverage (FGBC) for RNAPII occupancy within gene bodies normalized by length of the gene, in each indicated treatment in pIAA7-tagged BRD4 WT cells (Left) and C mutant-expressing cells (Right). N = 242 genes. (E) Schematic of RNAPII elongation mechanism in response to hypoxia. SEC is dispensable for RNAPII elongation in response to hypoxia. However, depletion of BRD4 impairs RNAPII elongation over hypoxia-induced genes. Moreover, targeting BRD4 function via JQ1 treatment has a minimal effect on RNAPII elongation.

References

    1. Giaccia A. J., Simon M. C., Johnson R., The biology of hypoxia: The role of oxygen sensing in development, normal function, and disease. Genes. Dev. 18, 2183–2194 (2004). - PMC - PubMed
    1. Lee P., Chandel N. S., Simon M. C., Cellular adaptation to hypoxia through hypoxia inducible factors and beyond. Nat. Rev. Mol. Cell Biol. 21, 268–283 (2020). - PMC - PubMed
    1. Semenza G. L., Hypoxia-inducible factor 1: Oxygen homeostasis and disease pathophysiology. Trends Mol. Med. 7, 345–350 (2001). - PubMed
    1. Smith T. G., Robbins P. A., Ratcliffe P. J., The human side of hypoxia-inducible factor. Br J. Haematol. 141, 325–334 (2008). - PMC - PubMed
    1. Wang G. L., et al. , Hypoxia-inducible factor 1 is a basic-helix-loop-helix-PAS heterodimer regulated by cellular O2 tension. Proc. Natl. Acad. Sci. U.S.A. 92, 5510–5514 (1995). - PMC - PubMed

MeSH terms